How to cite this paper: Dagogo, T., Ehirim, C.N. and Ebeniro, J.O. (2016) Enhanced Prospect Definition Using Well and 4D Seismic Data in a Niger Delta Field. International Journal of Geosciences, 7, 977-990.
http://dx.doi.org/10.4236/ijg.2016.78074
Received 24 March 2016; accepted 12 August 2016; published 15 August 2016
Copyright © 2016 by authors and Scientific Research Publishing Inc.
This work is licensed under the Creative Commons Attribution International License (CC BY). http://creativecommons.org/licenses/by/4.0/
Abstract
We carried out time-lapse analysis in a producing Niger Delta X-field, by first investigating the re-sponse and sensitivity of rock properties/attributes to lithology and pore fill in 3-D cross plot do-main and by Gassmann’s fluid substitution modeling. Furthermore, 4-D seismic data were inverted into acoustic impedance volumes through model based inversion scheme. This served as input in-to a multi-attribute neural network algorithm for the extraction of rock attribute volumes based on the results of the petrophysical log analysis. Subsequently, horizon slices of rock properties/ attributes were extracted from the inverted seismic data and analyzed. In this way, we mapped hydrocarbon depleted wells in the field, and identified probable by-passed hydrocarbon zones. Thus, the integration of well and time lapse seismic (4-D) data in reservoir studies has remarkably improved information on the reservoir economic potential, and enhanced hydrocarbon recovery factor.
Keywords
Base Data, Monitor Data, Inversion, Neural Network Analysis, Time-Lapse Analysis
1. Introduction
Reservoir characterization is aimed at identifying hydrocarbon bearing reservoirs, delineating them and subse-quently, determining the distribution of relevant physical properties such as lithology, porosity, permeability, water saturation and pore pressure, which will make for an easy determination of the reservoir’s economic po-tential [1]. Prospect definition requires more than just mapping of geologic structures that can bear hydrocarbon. It entails a more quantitative evaluation of both the static and dynamic properties of the specific reservoir.
Recent interests in reservoir characterization focus on optimizing the clarity of the geological and reservoir
simulation models of prospects, by accurately defining both the static and dynamic properties of reservoirs, through the integration of petrophysics in the interpretation of seismic data. The use of inversion algorithms based on the approximations of Zoeppritz’s equations has been studied by various researchers [2][3], for the inversion of prestack seismic data into acoustic and shear impedance volumes. Their results demonstrated the use of seismically derived attributes such as acoustic impedance, lambda-rho, Poisson impedance and Murho as effective tools for lithology and fluid prediction in a hydrocarbon reservoir.
During the production life of a reservoir, changes in fluid saturation, pressure and temperature induce changes in the reservoir’s density and compressibility properties. These changes undoubtedly, will affect the seismic re-sponse of reservoir rocks which could be investigated over a time lapse using (4-D) seismic data. This serves as a veritable tool to monitor and update reservoir models for optimized hydrocarbon recovery.
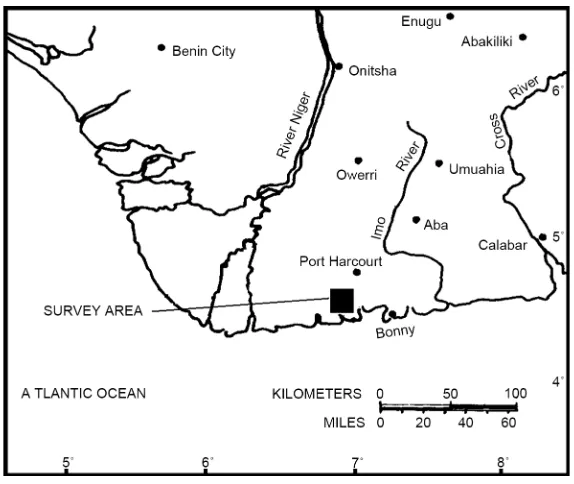
The study area lies to the NE of Niger delta in southeastern Nigeria, situated on the continental margin of the gulf of Guinea (Figure 1). The present work attempts to enhance hydrocarbon prospect definition in the field by integrating well and 4-D seismic data sets for effective monitoring of the in-situ reservoir properties over the producing regions and map possible by-passed hydrocarbon resources in the field.
2. Geology of the Study Area
The Niger delta is a sedimentary basin formed as a complex regressive off lap of clastic sediments and contains only one identifiable petroleum system referred to as the tertiary Niger delta (Akata-Agbada) petroleum system. This is characterized by structural and stratigraphic hydrocarbon plays overlain by the most recent Benin For-mation [4].
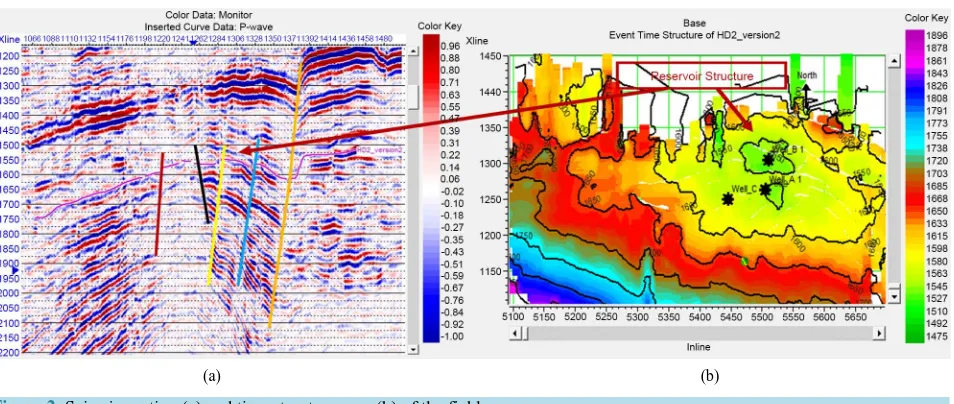
Preliminary analysis of the 4-D seismic data shows that the producing reservoir is situated on the crest of a multi-fractured rollover anticlinal structure (Figure 2), bounded by a major growth fault on the North-East of the field. The significant petroleum reservoir sands in the field consist mainly of middle Miocene deltaic sand-stones, which are poorly consolidated, with high effective porosities and permeability’s [5]. This makes the field ideally suited for a time-lapse analysis, as effects due to fluid saturation change could be readily discernible.
3. Method of Research
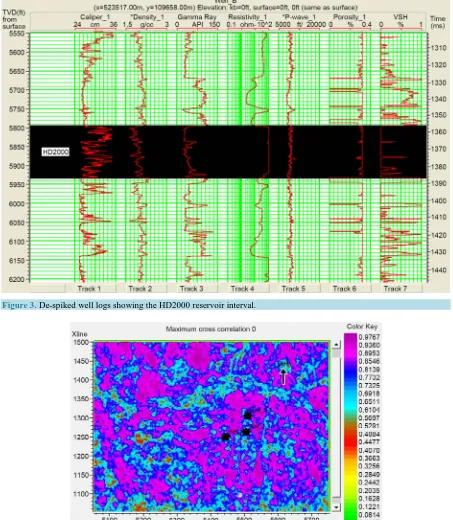
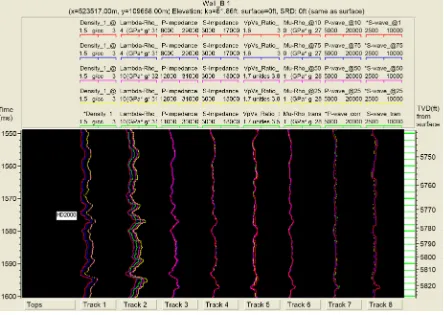
[image:2.595.170.457.466.708.2]Logs from producing wells (A, B, and C) and 4-D seismic data from the field were used in this study. The well logs comprising Density, Gamma ray, Sonic and Resistivity were de-spiked using a median filter, after correc-tions for mud filtrate invasions, well bore wash outs and missing data. Gamma ray and Resistivity logs were
(a) (b)
Figure 2. Seismic section (a) and time structure map (b) of the field.
used in delineating HD2000 hydrocarbon reservoir based on low gamma ray counts and high electrical resistivi-ty values (Figure 3). VpVs ratio, Poisson’s ratio, Lambdarho, Murho, acoustic and shear impedance logs were
derived from appropriate rock physics empirical models [6]-[9]. These rock attributes were analyzed over the reservoir interval in 3-D cross plot space and by Gassmann’s fluid substitution modeling for varying oil and brine saturations. Generally, common lithologic units and fluid types tend to form distinct clusters in cross plot space, and this helps in making a straight forward interpretation of probable lithology and pore fill saturant.
The original oil-water contact (OOWC) for HD2000 reservoir was about 5900 ftss while as at the year 2000, the oil water contact (OWC) was at about 5856 ftss. Average pressure and gas-oil ratio were 2532 psi and 298 scf/stb respectively, for well B. Well information’s were not available for wells (A and C) in this study.
The 4-D seismic data were reprocessed in parallel to ensure no extraneous effects due to acquisition footprint and processing shows up during 4-D analysis. Also, a cross correlation test was carried out between the vintages to ensure repeatability. Minimum correlation coefficient of 0.61 and maximum of 0.85 were obtained around and beyond the producing wells (Figure 4). This is an indication that the repeatability between the two vintages is good enough to allow for effective visualization of production induced effects in the field.
Subsequently, the seismic data from the two vintages were independently inverted into acoustic impedance volumes through a model based inversion scheme. These inverted impedances were used to generate the Lamb-da-mu-rho attributes for saturated media [5] [8] [10], to quantitatively characterize the reservoir in the field based on the results of well log cross plot analysis. The generation of Lambda-mu-rho attributes was done using a multi-attribute neural network algorithm. This algorithm works by identifying all possible linear and non- linear relationships that may exist between the desired log attribute and the several available seismic attributes at the well location. Based on these relationships, networks are trained to predict the log attribute over the seismic volume away from the well position in a least-squares sense, after validation.
4. Presentation of Results
4.1. Well Log Cross Plot Analysis
Several rock properties were cross plotted for the primary purpose of investigating their sensitivity and potential for fluid and lithology discrimination in 3-D cross plot space. The cross plotted rock/attribute property pairs are acoustic impedance versus lambda-rho (Ip vs. λρ), compressional to shear wave velocity ratio versus lambda-rho
(VpVs ratio vs. λρ), and mu-rho versus lambda-rho (μρ vs. λρ). The acoustic impedance (Ip) is the product of the
compressional wave velocity (Vp) and the bulk density (ρ), lambda-rho (λρ) is a scaled difference between
acoustic and shear impedances, which is very sensitive to fluid saturation as it ideally contains only effects re-lated to the saturating fluid, mu-rho (μρ) is a scaled form of the shear impedance and is mainly related to the rock matrix. VpVs ratio is the ratio of the compressional wave velocity to the shear wave velocity, which can be
Figure 3. De-spiked well logs showing the HD2000 reservoir interval.
Figure 4. Cross correlation slice of HD2000 seismic horizon.
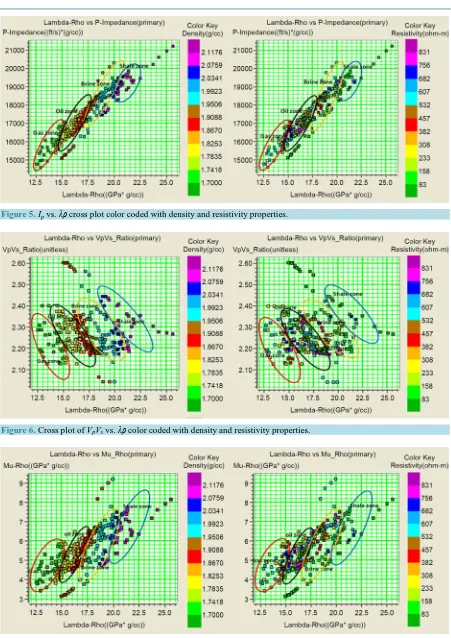
Cross plots of Ip vs. λρ, VpVs ratio vs. λρ, and μρ vs. λρ color coded with density and resistivity properties as
the third dimension respectively (Figures 5-7), isolated four distinct anomalous zones which are interpreted as gas sands, oil sands, brine sands and shale, respectively. Generally, gas and oil sands plots as low property clus-ters on the Ip vs. λρ, VpVs vs.λρ, and μρ vs. λρ cross plot space, while brine sands and shales plots as medium to
Figure 5.Ip vs. λρ cross plotcolor coded with density and resistivity properties.
Figure 6. Cross plot of VpVs vs. λρ color coded with density and resistivity properties.
[image:5.595.89.537.513.703.2]Results show that these cross plotted property pairs show good discrimination for pore fluids and lithology with varying sensitivities within the reservoir. μρ vs. λρ and Ip vs.λρ cross plot pairs are the most robust for pore
fill discrimination than the other cross plotted property pairs. Gas and oil sands plot as low ρ, λρ, μρ and Ip, and
high R (Resistivity) clusters than brine sands and shale.
These cross plot results were further validated by Gassmann’s fluid substitution modeling for 0% - 100% oil and brine saturations in the reservoir zone. The model shows a heightened sensitivity to varying oil saturations by ρ and λρ properties in tracks 1 and 2, followed by Ip in track 3 of the panel (Figure 8).
Model analysis show higher oil saturations associated with low ρ, λρ and Ip properties. This is consistent with
the results of the cross plot analysis. Result of the model analysis suggests λρ as the most sensitive attribute with distinct separations for 0% to 100% oil and brine saturations, while ρ and Ip are most sensitive to saturations
above 75% oil saturations. The other properties are less responsive to these saturation changes.
4.2. Seismic Horizon Attribute Analysis
Rock properties and attributes identified to be robust for fluid and lithology discrimination in the petrophysical well log cross plot analysis and Gassmann’s fluid substitution modeling, were extracted through a probabilistic Neural network algorithm [8]. These extracted rock/attribute property slices (Ip, λρ, ρ and Sw) for base and monitor data, were subsequently analyzed for 4-D effects.
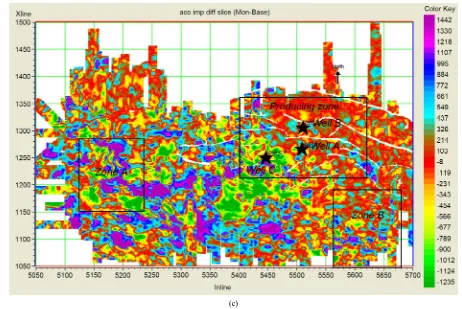
The Ip slice (Figure 9) delineated the producing well locations (producing zone) as low Ip zones for the base
data than the monitor slice. The difference slice show relatively high change index for well B location and high-er values for wells A and C. This is attributed to changes in pore fill saturation and pore pressure due to produc-tion. The region north of well B, bounded by regional faults, shows no observable 4-D effects. Zones A and B interpreted as sand packs that are probably hydrocarbon charged were also mapped in the slice.
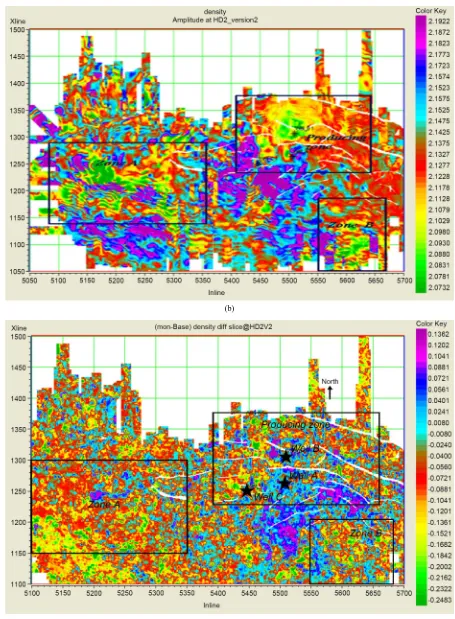
The ρ horizon slice (Figure 10), is in agreement with the Ip slices. It delineated the producing well locations
[image:6.595.94.538.393.708.2](producing zone) and other sand bodies (zones A and B), as low ρ zones. The producing well locations exhibit
(a)
(c)
Figure 9. Acoustic impedance horizon slices. (a) Base; (b) Monitor; (c) Difference slice.
(b)
[image:9.595.83.538.79.698.2](c)
4-D effects shown by increased ρ values on the monitor slices. This is evidenced on the difference slice. The difference slice show a moderate degree of change for well B location and higher degrees for wells A and C.
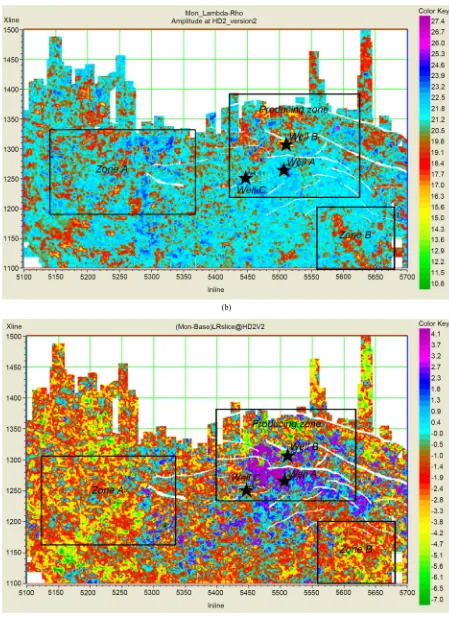
The λρ horizon slice (Figure 11), exhibits low λρ values around the producing well locations in the base than the monitor slice. The difference slice shows a moderate change around well B location and high λρ change around wells A and C locations. These are likely indications of changes in pore fill saturations in the reservoir induced by hydrocarbon production. The λρ slice also showed that zones A and B which had been previously interpreted as probable by-passed hydrocarbon zones by Ip and ρ slices are not hydrocarbon bearing. The region
north of well B is associated with no observable 4-D change and is thus, considered to be a probable by-passed hydrocarbon zone.
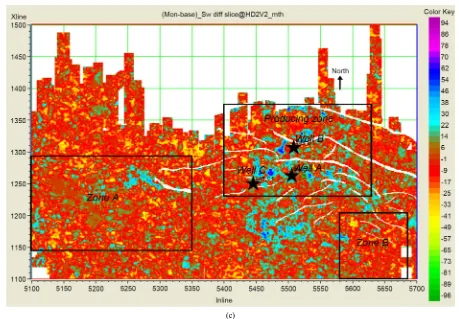
The water saturation slices (Figure 12), indicate low water saturation around the producing well locations on the base slice and increased water saturation on the monitor. The difference slice shows no much 4-D effect around well B, while wells A and C are pronounced.
The results of the inversion provided a quantitative estimate of rock/fluid property changes that validated the log-based analysis of HD2000 reservoir in this study.
5. Discussion of Results
The petrophysical well log analysis in cross plot domain and fluid sensitivity modeling using Gassmann’s fluid substitution, revealed that low ρ, λρ and Ip, and high R are associated with gas and oil sands, while medium to
high ρ, λρ and Ip, and low R values are associated with brine sands and shale, respectively. Results also show
that λρ attribute is the most robust in discriminating for reservoir pore fill than the other investigated properties for all saturations. ρ and Ip properties are only sensitive to saturations above 75% oil saturation.
The sensitivity of ρ and Ip properties to oil and brine sands is dependent on saturation. At low oil saturation, ρ
and Ip do not distinctly distinguish oil from brine sands, but becomes more responsive with increasing oil
satura-tion. This is attributed to the comparable densities of these reservoir saturants, such that increasing oil saturation will mask the effect of brine density on the responses of ρ and Ip properties in the reservoir.
(b)
[image:11.595.86.535.80.698.2](c)
(a)
(c)
Figure 12. Water saturation horizon slices. (a) Base; (b) Monitor; (c) Difference slice.
Reservoir sands plotted as low μρ and Ip, and high R clusters than shale. This low μρ for oil sands is in
va-riance with the high μρ associated with hydrocarbon sands from petrophysical studies [7]. Low μρ value sug-gests that the reservoir sands are probably unconsolidated and might be associated with minor shale intrusions in the investigated field.
The horizon attribute slices delineated the producing well locations as low ρ, λρ, Ip and water saturation zones
in the base compared to the monitor slice, which is consistent with the results of the log-based analysis. The dif-ference slice show that well B location is delineated by moderate ρ, λρ, Ip and water saturation values, while
wells A and C lies on higher values. These results are obvious indications that well B will soon water out, while wells A and C have watered out. This effect is attributed to hydrocarbon withdrawal and replacement by brine associated with pore pressure depletion in the reservoir.
The region north of well B is associated with no observable 4-D change and is thus, considered to be a proba-ble by-passed hydrocarbon zone. The presence of NE and SW faults bordering this region supports this pay proposal, as the faults are adequate seal structures for hydrocarbon accumulation in the field. Other mapped zones (A and B) which do not show convincing prospects for hydrocarbon accumulations from petrophysical analysis, could be further investigated for probable by-passed resources.
6. Conclusions
The horizon attribute slices show that low ρ, λρ and Ip associated with hydrocarbon charged sands are consistent
with the result of the log-based petrophysical analysis. These rock attributes were observed to have increased in magnitude on the monitor slices, indicating pore fill saturation changes and pore pressure depletion. Wells A and C have watered out, while well B will soon water out.
fur-ther petrophysical investigation.
Acknowledgements
We express our appreciation to the HAMPSON-RUSSELL Corporation and the SHELL PETROLEUM DEVELOPMENT COMPANY Port Harcourt, for their technical support and permission to use data for this study, without which we would not have succeeded.
References
[1] Dopkin, D. and Joanne, W. (2008) Seismic-Driven Reservoir Characterization, Exploration and Production.
[2] Chaveste, A. (2003) Risk Reduction in Estimation of Petrophysical Properties from Seismic Data through Well-Log Modeling, Seismic Modeling, and Rock Properties Estimation. The Leading Edge, 5, 406-418.
http://dx.doi.org/10.1190/1.1579572
[3] Fatti, J.L., Smith, G.C., Vail, P.J., Strauss, P.J. and Levitt, P.R. (1994) Detection of Gas in Sandstone Reservoirs Using AVO Analysis: A 3-D Seismic Case History Using the Geostack Technique. Geophysics, 59, 1362-1376.
http://dx.doi.org/10.1190/1.1443695
[4] Whiteman, A.J. (1982) Nigeria, Its Petroleum, Geology, Resources and Potential. Edinburgh Graham and Trotman, Vol. I and II. http://dx.doi.org/10.1007/978-94-009-7361-9
[5] Abrakasa, S. and Muhammad, A.B. (2011) Organic Geochemical Assessment of the Source, Depositional Environment and Migration Trends of the Oils in the Nembe Creek E1.0 and Kolo Creek E2.0 Reservoirs. Archives of Applied Science Research, 3, 342-349.
[6] Castagna, J.P., Batzle, M.L. and Eastwood, R.L. (1985) Relationship between Compressional-Wave and Shear-Wave Velocities in Clastic Silicate Rocks. Geophysics, 50, 571-581. http://dx.doi.org/10.1190/1.1441933
[7] Goodway, B., Chen, T. and Downton, J. (1997) Improved AVO Fluid Detection and Lithology Discrimination Using Lame’s Petrophysical Parameters. Expanded Abstracts, CSEG Convention.
[8] Hampson, D.P., Schuelke, J.S. and Quirein, J.A. (2001) Use of Multi Attributes Transform to Predict Log Properties from Seismic Data. Geophysics, 66, 230-236. http://dx.doi.org/10.1190/1.1444899
[9] Pickford, S., Chavestes, A. and Hill, B. (2001) Lithology and Fluid Type Determination in Tertiary Clastic Reservoirs through Elastic Rock Properties Estimation. First Break, 19, 571-574.
[10] Russell, B.H., Hedlin, K., Hilterman, F.J. and Lines, L.R. (2003) Fluid Property Discrimination with AVO: A Biot- Gassmann Perspective. Geophysics, 68, 29-39. http://dx.doi.org/10.1190/1.1543192
Submit or recommend next manuscript to SCIRP and we will provide best service for you:
Accepting pre-submission inquiries through Email, Facebook, LinkedIn, Twitter, etc. A wide selection of journals (inclusive of 9 subjects, more than 200 journals) Providing 24-hour high-quality service
User-friendly online submission system Fair and swift peer-review system
Efficient typesetting and proofreading procedure
Display of the result of downloads and visits, as well as the number of cited articles Maximum dissemination of your research work