http://dx.doi.org/10.4236/pp.2013.48087
Rapid and Simple Extraction Method for Volatile
N-Nitrosamines in Meat Products
Mohammad Al-Kaseem*, Zaid Al-Assaf, Franswa Karabet
Department of Analytical and Food Chemistry, Faculty of Pharmacy, Damascus University, Damascus, Syria. Email: *[email protected]
Received September 21st, 2013; revised October 22nd, 2013; accepted October 29th, 2013
Copyright © 2013 Mohammad Al-Kaseem et al. This is an open access article distributed under the Creative Commons Attribution
License, which permits unrestricted use, distribution, and reproduction in any medium, provided the original work is properly cited.
ABSTRACT
A new methodology for extraction, pre-concentration and analysis of volatile nitrosamines in meat-derived products was developed and compared with conventional methods (Distillation and two-step solid-phase extraction). The sam- ples (canned sausages, cured meat, luncheon and smoked meat) were treated with an aqueous sodium hydroxide (NaOH) by autoclaving at 121˚C for 10 min and extracted by liquid-liquid extraction with dichloromethane, then the nitrosa- mines were pre-concentrated using activated silica. Then, gas chromatography coupled with flame ionization detector was used for the separation and determination of the different nitrosamines contained in a real sample and gas chroma- tography with mass spectrometry detection was used as the confirmation technique. The newly invented autoclaving method allowed the determination of nitrosamine compounds at trace levels with limit of detection ranged from 0.077 to 0.18 ppb and quantitation limits were from 0.26 to 0.6 ppb for all nitrosamines, and found to be superior to the con- ventional ones, yielding approximately about 10% - 20% increasing in the recovery compared with the mean recovery obtained when applying conventional methods.
Keywords: GC-FID; N-Nitrosamines; LLE; Meat; Autoclave
1. Introduction
N-Nitrosamines (NAs), mainly N-nitrosodimethylamine (NDMA), and N-nitrosodiethylamine (NDEA) are re- ceiving special attention, because they present high mu- tagenic and carcinogenic potential that can induce tumors in variety of organs, including the liver, lung, kidney, bladder, pancreas, esophagus and tongue depending on the species, but not in the skin, brain, colon or bone. For example, N-nitrosodimethylamine at the levels of 20 ppm can induce liver cancer in a human [1]. The Interna- tional Agency for Research on Cancer (IARC) classified NDMA and NDEA as most carcinogenic to humans, and N-nitrosodi-n-butylamine (NDBA), N-nitrosopiperidine (NPIP) and N-nitrosopyrrolidine (NPYR) as possibly carcinogenic to humans [2,3]. In the diet, they occur as unintentional byproducts of food preparation, preserva- tion and processing [4], although they can also occur in the environmental tobacco smoke [5], and may be formed endogenously within the human body [6]. These com- pounds are formed by the reaction of secondary amines
with nitrosating agents, such as nitrates or nitrites, which are commonly used in the manufacture of meat products [4-7]. For this reason, the use of these nitrosating agents for curing meat is strictly controlled in some countries [8]. Moreover, some known inhibitors of the nitrosation reaction, such as ascorbic acid, are used in the processing of several foods [9]. The determination of nitrosamines in food and water samples has been carried out by dif- ferent analytical methods, including colorimetry [10,11], capillary electro-chromatography [12], micellar electro- kinetic capillary chromatography [13], gas chromatogra- phy with flame ionization detection, nitrogen phospho- rous detection, thermal energy detection, nitrogen chem- iluminescence detection [14-17], and mass spectrometry detection [18-20], high-performance liquid chromatog- raphy with thermal energy analyzer, mass spectrometry and fluorescence detection [21,22]. The extraction of the nitrosamine from the complex food matrices and the cleanup of the extract have been the critical points of the sample preparation step, and several approaches are do- cumented in the literatures, including distillation (steam or vacuum) [23-25], solvent extraction, [26] solid-phase
extraction [27], solid-phase micro-extraction (SPME) [28], and supercritical fluid extraction [29].
This paper describes the development of a simple method for the extraction of volatile nitrosamines from meat products using sodium hydroxide to enhance the stability under autoclaving conditions and comparing the new method with the conventional procedures (vacuum distillation and two-step solid-phase extraction with Ex- trelut and Florisil sorbents).
2. Methods
2.1. Samples
All meat samples (10 samples of each of cured meat, sausage, luncheon, and smoked meat) were purchased from supermarkets in Damascus. The samples were crushed and mix with no addition of the fluid and then stored in −20˚C before analysis.
2.2. Materials
EPA 521 nitrosamine mix standard was purchased from Supleco (USA), this solution contained seven analytes at 2000 µg/mL of each: N-nitrosodimethylamine (NDMA), N-nitrosomethylethylamine (NMEA), N-nitrosodiethyla- mine (NDEA), N nitrosopyrrolidine (NPYR), N-nitroso- din-propylamine (NDPA), N-nitrosopiperidine (NPIP) and N-nitrosodi-n-butylamine (NDBA). For sample pre- paration, sodium hydroxide, ethanol, Methanol, hexane, octane and dichloromethane (DCM) and Florisil were purchased from Sigma-Aldrich (USA). Florisil water sep-pak cartridges from Waters (Milford, MA, USA). Extrelut and Activated Silica Gel (silica gel 60 extra pure. 70 - 230 mesh) were obtained from Merck (Germany). All other chemicals (ascorbic acid, sulfanilic acid, sul- furic acid, anhydrous sodium sulfate and sodium chlo- ride) used in this research were of analytical laboratory grade.
2.3. Apparatus
Pyrex tubes (20 ml) with heat-stable Teflon-lined caps and glass column (30 cm × 1.5 cm) were used. Kuderna- Danish (KD) concentrator was used for the concentration of organic solvents. Autoclave (Selecta, Spain, 4001757) and gas chromatograph equipped with a flame ionization detector controlled by computer running GC-Solution software (GC-2014, Shimadzu, Japan) and an optima- XLB Capillary Columns (0.25 mm i.d. 30 m, 0.25 μm) from (MACHEREY-NAGEL GmbH & Co) were used. Agilent gas chromatography 7890A equipped with mass selective detector MS 5975C controlled by computer running Agilent Chemstation software (Agilent Tech- nologies, Madrid, Spain) for confirmation of the results. Local steam distillation device and glassware were used
for sample preparation.
2.4. Preparation of Nitrosamine Mix Standard
A series of working standard solutions were prepared by appropriate dilution of the EPA 521 nitrosamine mix with dichloromethane and stored at −20˚C before use. From the primary stock solution 2000 µg/mL of each nitrosamine, a 1/200 dilution was done to get 100 µg/mL secondary stock solution of each nitrosamine. Sequen- tially dilute secondary stock solution was performed to get standards titrating at 4, 10, 50, 100, 500, 1000 µg/L in by taking the following volumes from secondary stock solution, 40 µl, 100 µl, 500 µl, 1000 µl, 5 mL, 10 mL in series of 100 mL volumetric flasks respectively, these solution kept in the absence of light.
2.5. Analytical Conditions
GC analysis was carried out using GC-2014 gas chro- matograph equipped with flame ionization. (GC-FID) (Shimadzo Technologies, Japan). One microliter of the extracted solution sample was injected into optima-XLB Capillary Column (30 m × 0.25 mm I.D. × 0.25 film thickness (df)). For the gas chromatograph separation of N-nitrosamines, the injection port and detector tempera- ture were kept at 250˚C and 300˚C. The oven program was as follows: 40˚C, held for 3 min; ramp to 100˚C at 10˚C/min, held isothermally for 1 min; ramp to 250˚C at 15˚C/min, held isothermally at 250˚C for 2 min. The sample was injected in splitless mode; using an injection volume of 1 µl. Nitrogen was used as make-up gas. The purity of all gases used was greater than 99.999%. The velocity of the helium carrier was 1 mL/min. GC-MS were carried out to confirmation of the results using an optima XLB column (30 m × 0.25 mm I.D. × 0.25 film thickness (df) column with same conditions used in GC- FID and the injector and transfer line temperature in GC- MS were 240˚C and 275˚C, respectively. The ion source temperature was 240˚C and operated in positive electron ionization (EI) 70 eV mode.
2.6. Conditions for Autoclave Treatment
nal extract in the separatory funnel. After being shaken, the dichloromethane layer was collected, and the water layer was re-extracted with 10 ml of dichloromethane. The dichloromethane extracts were combined, dried over anhydrous sodium sulfate and concentrated to approxi- mately 0.5 mL using KD concentrator and nitrogen gas flow. The concentrate was loaded onto a silica gel col- umn (30 cm × 1.5 cm) (equilibrated with dichloro- methane) and the column was eluted with 10 ml of di- chloromethane. After the addition of 100 µL of octane (to prevent exsiccation of the solvent), the elute was concentrated to 1 mL using KD concentrator and nitro- gen gas flow and analyzed by GC-FID using 1 µL injec- tion volume, and confirmatory analyses were performed on GC-MS.
2.7. Extraction of N-Nitrosamine from Meat
2.7.1. Autoclave Treatment
Approximately one gram of meat sample was placed in the Pyrex tube into which 10 mL of sodium hydroxide 1 N was poured. The tube was capped tightly and auto- claved at 121˚C for 5, 10 and 30 min; dichloromethane extract was obtained by the procedure described for the standard solution in (Section 2.6). The individual extracts were analyzed by GC-FID, GC-MS as in the case of the standard solution (Section 2.5).
2.7.2. Steam Distillation
Extraction was done as described by Komarova and Ve- likanov (2000) [22]. A weighed portion (80 - 100 g) of a meat reduced in a homogenizer was placed in a 500-mL round-bottom flask connected with a steam generator and a condenser. Distilled water (100 - 150 mL depending on the humidity of the foodstuff) and 0.1 mL of 50 ppb so- lution of each nitrosamine were added to the foodstuff and stirred. Next, 10 g of sodium chloride, 10 g of so- dium or magnesium sulfate, 5 mL of a 2% sulfanilic acid solution (to inhabit endogenous nitrosation), and 10 mL of a 1 N sulfuric acid solution were added, and N-ni- trosamines were steam distilled off collecting 250 mL of the distillate. The distillate was transferred into a separa- tory funnel, and N-nitrosamines were extracted with di- chloromethane five times (with portions of 10 mL each). Each portion of the extract was passed through a funnel with a red-ribbon paper filter filled with 5 g of anhydrous sodium sulfate. The filter was washed with 10 mL of the extractant. All portions of the extract were combined and condensate using KD to 1 ml and analyzed using GC- FID.
2.7.3. Two-Step Solid-Phase Extraction
Extraction of nitrosamines was performed using the same method as Yurchenko and Molder (2007) [31]. A two- step solid-phase extraction using Extrelut and Florisil
sorbents was used for sample cleaning. Each sample (6.0 ± 1.0 g) was minced and mixed with 0.1 mol·L−1 NaOH (6 mL). For the first step, 6 g of Extrelut was placed at the bottom of the glass column (30 cm × 1.5 cm) and wetted with 20 mL hexane/dichloromethane 40:60 (v:v). Then, the sample was eluted with two 20 mL portions of hexane/dichloromethane solution 40:60 (v: v). the eluate was collected in a 50 mL concentrator flask and evapo- rated under a nitrogen stream. During the second step, 1 g of Florisil was placed at the bottom of the Florisil car- tridge (6.5 cm × 1.3 cm) and wetted with 6 mL di- chloromethane/methanol 95:5 (v:v). Then the sample solution was eluted with 6 mL dichloromethane/metha- nol solution 95:5 (v: v). the solution was evaporated un- der a nitrogen stream to about 1 mL. The prepared solu- tion was transferred to the GC auto sampler vial. Extrac- tions were performed in triplicate [30].
3. Results and Discussion
3.1. Optimization of Conditions for Autoclave Treatment
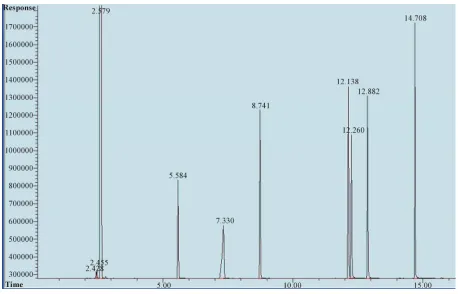
Figure 1 shows a chromatogram of the N-nitrosamines
standard solution obtained by GC-FID. The total recov- ery of nitrosamine for the autoclave treatment in water ranged from 61.1% to 98% depending on the heating period as shown in Table 1. This indicates that N-ni- trosamines remained almost stable during the autoclave treatment because of the stability of N-nitrosamines un- der the alkaline conditions and difficulty to destroy them under these conditions [31], however, the total recovery of N-nitrosamines slightly decreased as the NaOH con- centration increased or the heating period elongated. To clarify the reason for the decrease in the total N-ni- trosamine recovery, the volatile nitrosamines in Figure 1 were analyzed and the results are shown in Table 2.
The recoveries of some N-nitrosamines with rather short retention times such NDMA and NDEA were sat- isfactory under any conditions. In contrast, the decrease in the recovery was notable for the peaks with much longer retention times as the NaOH concentration in- creased or the heating period became longer. Since NPYR and NPIP giving longer retention times that, the decrease in the total N-nitrosamines recovery would re- sult from the instability under the conditions of high NaOH concentration and lasted heating at 121˚C. Con- sequently, it was proposed that samples for N-nitrosa- mines analysis should be treated with 1 N NaOH for 10 min.
3.2. Efficacy of Autoclave Treatment for Extraction of N-Nitrosamines from Meat
Table 3 shows the peak areas and total peak areas of N-
Figure 1. Chromatogram of 50 µg/L of N-nitrosamine mix (GC-FID).
Table 1. Effect of alkali concentration and autoclaving times on total recovery of N-nitrosamine.
Autoclaving time (min)
5 10 30 Alkali concentration
Recovery (%) RSD (%) Recovery (%) RSD (%) Recovery (%) RSD (%)
0 N NaOH (water) 61.1 6.8 76 8.9 62.7 9.24
0.5 N NaOH 85.9 2.7 97.8 4.3 87.9 8.5
1 N NaOH 88.4 2.8 98.1 1.05 88.4 3.1
2 N NaOH 87.2 5.6 87.6 4.6 88.5 6.4
Each value represents mean (S) and relative standard deviation (RSD) in three experiments.
Table 2. Effect of alkali concentration and autoclaving times on recovery of N-nitrosamines.
Autoclaving time (min)
5 min 10 min 15 min 5 min 10 min 15 min 5 min 10 min 15 min
NA
With NaOH 0.5 N (Recovery %)
With NaOH 1 N (Recovery %)
With NaOH 2 N (Recovery %)
NDMA 80.0 89.7 88.9 90.2 105.5 93.7 88.4 80.7 80.6
NMEA 88 89 76 67 89 89 76 73 89
NDEA 85.6 87.8 85.6 80.1 102.3 91.4 88.5 79.3 80.5 NPYR 77.1 79.0 77.1 80.2 99.1 90.2 86.9 75.3 70.3
NDPA 80.6 86.3 76.4 80.3 98.5 93.8 86.4 77.1 83.6 NPIP 73.2 80.2 75.3 86.3 99.3 88.9 83.4 77.3 86.1 NDBA 69.9 73.7 69.3 80.3 92.1 88.3 85.3 82.9 71.6
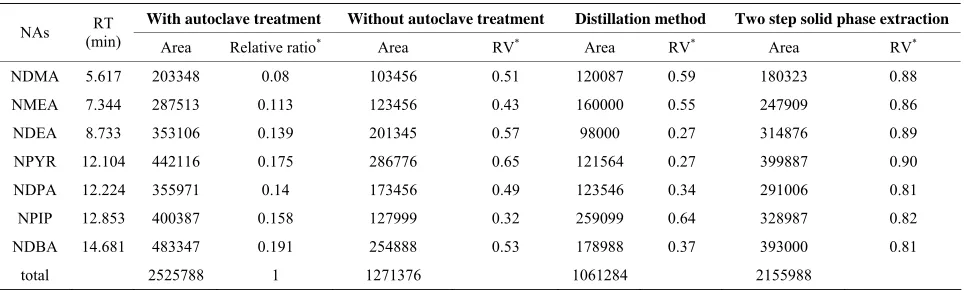
[image:4.595.57.539.555.711.2]Table 3. Determination of N-nitrosamines with and without autoclave treatment, and with conventional methods.
With autoclave treatment Without autoclave treatment Distillation method Two step solid phase extraction
NAs (min) RT
Area Relative ratio* Area RV* Area RV* Area RV*
NDMA 5.617 203348 0.08 103456 0.51 120087 0.59 180323 0.88
NMEA 7.344 287513 0.113 123456 0.43 160000 0.55 247909 0.86
NDEA 8.733 353106 0.139 201345 0.57 98000 0.27 314876 0.89
NPYR 12.104 442116 0.175 286776 0.65 121564 0.27 399887 0.90
NDPA 12.224 355971 0.14 173456 0.49 123546 0.34 291006 0.81
NPIP 12.853 400387 0.158 127999 0.32 259099 0.64 328987 0.82
NDBA 14.681 483347 0.191 254888 0.53 178988 0.37 393000 0.81
total 2525788 1 1271376 1061284 2155988
Relative ratio*: area/total area, RV*: peak area as the percentages of that of the autoclave treatment, NAs: nitrosamines, RT: retention time.
after the conventional treatments were shown as the per- centages of the peak areas corresponding of autoclave treatment. All N-nitrosamines tested were detected after autoclaving. The peaks of N-nitrosamines were sharp and completely separated, and there is an increasing of the recovery (expressed as peak area) after autoclave treat- ment compared with the same sample when extracted without an autoclaving, or by conventional methods. Ob- viously, the relative percentage of peak area for each nitrosamine (Table 3) under autoclaving conditions was as twice as that of extraction without autoclaving or by distillation, and it was about 10% - 20% more than that of the two-step solid-phase extraction.
3.3. Method Validation
The new method was validated to demonstrate that it is suitable for its intended purpose by the standard proce- dure to evaluate adequate validation characteristics [30, 32]. Retention times of selected N-nitrosamines was de- termined by using standard solutions of each nitrosamine, and the confirmation was performed using GC-MS. Fig-
ure 1 shows the chromatogram obtained by GC-FID of
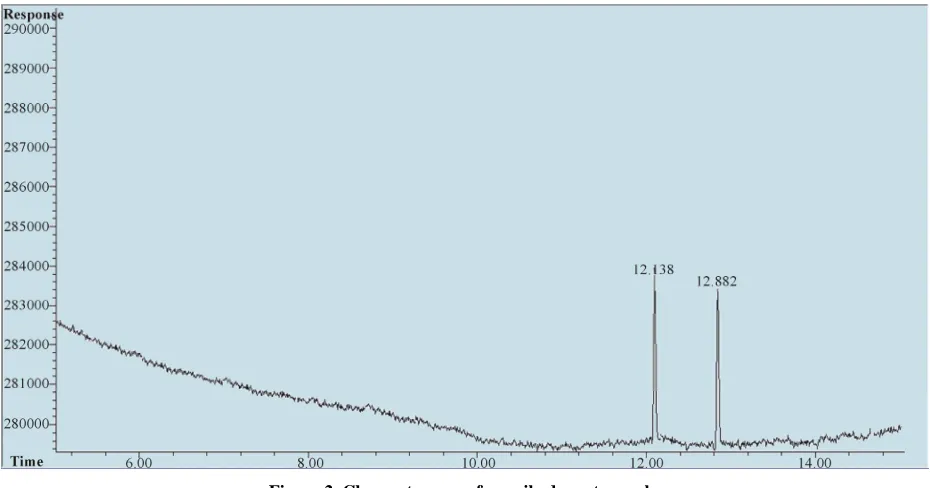
50 ppb (part per billion) standard solution of each N- nitrosamines. Figure 2 shows the chromatogram ob- tained by unspiked meat sample. Table 4 shows the con- firmation results of seven nitrosamines obtained when analyzing the same solution and identifying the retention times using GC-MS. In order to examine the linearity a series of working standard solutions at the concentrations of 4, 10, 50, 100, 500, 1000 µg/L of each N-nitrosamine were prepared and analyzed under the selected chroma- tographic and flame ionization detector conditions. The linear equations, linear ranges and correlation coeffi- cients for the seven nitrosamines are shown in Table 4. The limits of quantification with a signal-to-noise ratio of 10 for the seven nitrosamines were from 0.26 to 0.6 ppb with limits of detection with a signal-to-noise ratio of 3 for the seven nitrosamines were from 0.077 to 0.18 ppb.
The recovery and precision experiments were conducted by spiking different blank samples at three spiking levels of 1, 5, 10 µg/L, six replicates at each level, the mean recoveries were from 89% - 105.5% with the relative standard deviations (RSDs) from 2.8% to 4.4%.
3.4. Sample Results
Meat samples were treated with 1 N NaOH for 10 min in autoclaved conditions and then analyzed by GC-FID and the results are shown in Table 5. The results of 40 sam- ples of different meat products which examined for the test of the extraction procedure shows the presence of some volatile nitrosamine in all different products, and the absence of NDEA, NDPA, and NDBA in all the sample tested which may related to the presence of these three nitrosamines in low amounts which may below under the quantitation limit of our procedure, or the real absence of these nitrosamine in the sample tested. Statis- tically when applying (PASW Statistics 18) one way ANOVA test for statistical comparisons between the means of sum of seven nitrosamines in meat samples, there was significant difference (p > 0.05) which may related to the low number of different samples, or be- cause that some of tested samples are commonly pre- served by nitrite salts (sausages and luncheon) which contributing in nitrosamine formation and the effect of processing (smoking) in the formation of these carcino- genic compounds in smoked meat.
4. Conclusion
Figure 2. Chromatogram of unspiked meat sample.
Table 4. Linear equations, linear ranges and correlation coefficients of seven volatile nitrosamines.
N-nitrosamine GC-FID RT* Confirmation RTGC-MS * Linear equation Linear range µg/L Correlation coefficients µg/kg LOQ µg/kg LOD
NDMA 5.617 5.617 y = 4161.7x − 9274.8 0.6 - 500 0.9997 0.6 0.18
NMEA 7.344 7.344 y = 5816.1x − 14015 0.43 - 500 0.9994 0.43 0.13
NDEA 8.733 8.733 y = 7095.3x − 13214 0.33 - 500 0.9996 0.33 0.1
NPYR 12.104 12.104 y = 8699.3x − 8839.9 0.26 - 500 0.9995 0.26 0.08
NDPA 12.224 12.224 y = 6674.6x − 3555.2 0.25 - 500 0.9981 0.25 0.077
NPIP 12.853 12.853 y = 7992.3x − 141000 0.34 - 500 0.9995 0.34 0.105
NDBA 14.681 14.681 y = 9805.1x − 16361 0.30 - 500 0.9998 0.309 0.093
RT*: retention time (minutes), GC-FID: gas chromatography-flame ionization detection, LOQ: limit of quantitation, LOD: limit of detection.
Table 5. Results on nitrosamine results in meat samples.
Mean concentration (n = 3) of N-nitrosamine µg/kg
products No. of samples
NDMA NDEA NDPA NDBA NPYR NPIP Sum of seven N-nitrosamine µg/kg
Sausage 10 nd* nd* nd* nd* 2.78 2.98 4.76
Cured Meat 10 nd* nd* nd* nd* 3.2 nd 3.20
Luncheon 10 nd* nd* nd* nd* 2.60 nd 2.60
Smoked meat 10 nd* nd* nd* nd* 3.70 2.60 6.60
nd*: not detected.
invented method which employs an autoclave for the estimation of volatile N-nitrosamines contents in meat products.
REFERENCES
[1] M. W. Byun, H. J. Ahn, J. H. Kim, J. W. Lee, H. S. Yook and S. B. Han, “Determination of Volatile N-Nitrosam- ines in Irradiated Fermented Sausage by Gas Chromatog-
raphy Coupled to a Thermal Energy Analyzer,” Journal of Chromatography A, Vol. 1054, No. 1-2, 2004, pp. 403-
407.
[2] IARC Monographs on the Evaluation of Carcinogenic Risks to Humans, “Monographs Programme Finds Smoke- less Tobacco Is Carcinogenic to Humans,” International Agency for Research on Cancer, 2004.
[image:6.595.55.539.527.613.2]Grilled Lamb and Vegetables Using Comprehensive Gas Chromatography—Nitrogen Chemiluminescence Detec- tion,” Food Chemistry, Vol. 135, No. 4, 2012, pp. 2215-
2220. http://dx.doi.org/10.1016/j.foodchem.2012.07.002 [4] N. Campillo, P. Viñas, N. C. Martinez and M. H. Cór-
doba, “Determination of Volatile Nitrosamines in Meat Products by Microwave-Assisted Extraction and Disper- sive Liquid-Liquid Micro-Extraction Coupled to Gas Chromatography-Mass Spectrometry,” Journal of Chro- matography A, Vol. 1218, No. 14, 2011, pp. 1815-1821.
http://dx.doi.org/10.1016/j.chroma.2011.02.010
[5] W. G. Lin, F. Wei, F. N. Gu, X. Dong, L. Gao, T. T. Zhuang, M. B. Yue and J.H. Zhu, “Adsorption of Ni- trosamines by Mesoporous Zeolite,” Journal of Colloid and Interface Science, Vol. 348, No. 2, 2010, pp. 621-627.
http://dx.doi.org/10.1016/j.jcis.2010.05.012
[6] R. Andrade, F. G. Reyes and S. Rath, “A Method for the Determination of Volatile N-Nitrosamines in Food by HS-SPME-GC-TEA,” Food Chemistry, Vol. 91, No. 1, 2005, pp. 173-179.
http://dx.doi.org/10.1016/j.foodchem.2004.08.015 [7] B. J. Sanchez, E. Ballesteros and M. Gallego, “Automatic
Screening Method for the Pre-Concentration and Deter- mination of N-Nitrosamines in Water,” Talanta, Vol. 73, No. 3, 2007, pp. 498-504.
http://dx.doi.org/10.1016/j.talanta.2007.04.007
[8] K. O. Honikel, “The Use and Control of Nitrate and Ni- trite for the Processing of Meat Products,” Meat Science,
Vol. 78, No. 1-2, 2008, pp. 68-76.
http://dx.doi.org/10.1016/j.meatsci.2007.05.030
[9] R. A. Scanlan, “Encyclopedia of Food and Nutrition,” Elsevier, 2003, pp. 4142-4147.
http://dx.doi.org/10.1016/B0-12-227055-X/00831-2 [10] M. J. Dennis, P. E. Key, T. Papworth, M. Pointer and R.
C. Massey, “The Determination of Nitrate and Nitrite in Cured Meat by HPLC/UV,” Food Additives and Con- taminants, Vol. 7, No. 4, 1990, pp. 455-461.
http://dx.doi.org/10.1080/02652039009373908
[11] F. E. Okieimana, E. O. Akintola, T. C. A. Anucha and M. M. Ajibola, “Determination of Total Level of Nitrosa- mine Contamination of Some Consumer Products in Ni- geria,” International Journal of Environmental Analytical Chemistry, Vol. 21, No. 4, 1985, pp. 261-266.
http://dx.doi.org/10.1080/03067318508077067
[12] M. T. Matyska, J. J. Pesek and L. Yang, “Screening method for Determining the Presence of N-Nitrosodie- thanolamine in Cosmetics by Open-Tubular Capillary Elec- trochromatography,” Journal of Chromatography A, Vol.
887, No. 1-2, 2000, pp. 487-503.
http://dx.doi.org/10.1016/S0021-9673(00)00451-9 [13] M. Qiang, X. H. Wei, W. Chao, B. Hua, X. G. Cheng, S.
Ning, X. L. Yan and W. J. Bing, “Determination of Ten Volatile Nitrosamines in Cosmetics by Gas Chromatog- raphy Tandem Mass Spectrometry,” Chinese Journal of Analytical Chemistry, Vol. 39, No. 8, 2011, pp. 1201-
1207. http://dx.doi.org/10.1016/S1872-2040(10)60466-5 [14] J. E. Grebel and H. I. Suffet, “Nitrogen-Phosphorus De-
tection and Nitrogen Chemiluminescence Detection of Volatile Nitrosamines in Water Matrices: Optimization
and Performance Comparison,” Journal of Chromatog- raphy A, Vol. 1175, No. 1, 2007, pp. 141-144.
http://dx.doi.org/10.1016/j.chroma.2007.09.073
[15] M. Z. Ozel, F. Gongus, S. Yagci, J. F. Hamilton and A. C. Lewis, “Determination of Volatile Nitrosamines in Vari- ous Meat Products Using Comprehensive Gas Chroma- tography-Nitrogen Chemiluminescence Detection,” Food and Chemical Toxicology, Vol. 48, No. 11, 2010, pp.
3268-3273. http://dx.doi.org/10.1016/j.fct.2010.08.036 [16] B. Hfiger and R. Niessner, “Determination of N-Nitroso-
methylaniline and Methylaniline in the Gas Phase,” Mi- crochimica Acta, Vol. 122, No. 1-2, 1996, pp. 35-44.
http://dx.doi.org/10.1007/BF01252403
[17] J. A. Incavo and M. A. Schafer, “Simplified Method for the Determination of N-Nitrosamines in Rubber Vulcani- zates,” Analytica Chimica Acta, Vol. 557, No. 1-2, 2006,
pp. 256-261. http://dx.doi.org/10.1016/j.aca.2005.10.018 [18] D. Tsikas, “Methods of Quantitative Analysis of the Ni-
tric Oxide Metabolites Nitrite and Nitrate in Human Bio- logical Fluids,” Free Radical Research, Vol. 39, No. 8,
2005, pp. 797-815.
http://dx.doi.org/10.1080/10715760500053651
[19] J. W. Dallinga, D. M. Pachen, A. H. Lousberg, J. A. Van Geel, G. M. Houben, R. W. Stockburgger, J. M. Maanen and J. C. Kleinjans, “Volatile N-Nitrosamines in Gastric Juice of Patients with Various Conditions of the Gastro- intestinal Tract Determined by Gas Chromatography- Mass Spectrometry and Related to Intragastic pH and Ni- trate and Nitrite Levels,” Cancer Letters, Vol. 124, No. 2,
1998, pp. 119-125.
http://dx.doi.org/10.1016/S0304-3835(97)00467-9 [20] Y. Xia, J. E. McGuffey, S. Bhattacharyya, B. Sellergren,
E. Yilmaz and L. Wang, “Analysis of the Tobacco-Speci- fic Nitrosamine 4-(Methylnitrosamino)-1-(3-Pyridyl)-1- Butanol in Urine by Extraction on a Molecularly Im- printed Polymer Column and Liquid Chromatography/ Atmospheric Pressure Ionization Tandem Mass Spec- trometry,” Analytical Chemistry, Vol. 77, No. 23, 2005,
pp. 7639-7645. http://dx.doi.org/10.1021/ac058027u [21] G. Bellec, M. C. Cauvin, K. L. Calve, Y. Dreano, H.
Gouerou, J. F. Menez and F. Berthou, “Analysis of N-Nitrosamines by High-Performance Liquid Chroma- tography with Post-Column Photohydrolysis and Colori- metric Detection,” Journal of Chromatography A, Vol.
727, No. 1, 1996, pp. 83-92.
http://dx.doi.org/10.1016/0021-9673(95)01073-4
[22] N. V. Komarova and A. A. Velikanov, “Determination of Volatile N-Nitrosamines in Food by High-Performance Liquid Chromatography with Fluorescence Detection,”
Journal of Analytical Chemistry, Vol. 56, No. 4, 2001, pp.
359-363. http://dx.doi.org/10.1023/A:1016652213062 [23] Association of Official Analytical Chemists, “N-Nitrosa-
mines (Volatile) in Fried Bacon. Mineral Oil Vacuum Distillation—Thermal Energy Analyzer Method,” No. 982.22, Official Methods of Analysis, 15th Edition, 1990. [24] E. L. Greenfield, W. J. Smith and A. J. Malanovski,
“Mineral Oil Vacuum Distillation for Nitrosamines in Fried Bacon, with Thermal Energy Analyser,” Journal of the Association Official Analytical Chemists, Vol. 65, No.
[25] G. M. Telling, T. A. Bryce and J. J. Althorpe, “Use of Vacuum Distillation and Gas Chromatography-Mass Spectrometry for Determining Low Levels of Volatile Nitrosamines in Meat Products,” Journal of Agricultural and Food Chemistry, Vol. 19, No. 5, 1971, pp. 937-940.
http://dx.doi.org/10.1021/jf60177a011
[26] J. Nawrocki and P. Andrzejewski, “Nitrosamines and Water,” Journal of Hazardous Materials, Vol. 189, No.
1-2, 2011, pp. 1-18.
http://dx.doi.org/10.1016/j.jhazmat.2011.02.005
[27] S. Raoul, E. Gremaud, H. Biaudet and R. Tureski, “Rapid Solid-Phase Extraction Method for the Detection of Vola- tile Nitrosoamines in Food,” Journal of Agricultural and Food Chemistry, Vol. 45, No. 12, 1997, pp. 4706-4713. http://dx.doi.org/10.1021/jf970232q
[28] S. Ventanas, D. Martín, M. Estévez and J. Ruiz, “Analy- sis of Volatile Nitrosamines from a Model System Using SPME-DED at Different Temperatures and Times of Ex-
traction,” Food Chemistry, Vol. 99, No. 4, 2006, pp. 842-
850. http://dx.doi.org/10.1016/j.foodchem.2005.08.035 [29] W. Fiddler and J. W. Pensabene, “Supercritical Fluid
Extraction of Volatile N-Nitrosamines in Fried Bacon and Its Drippings: Method Comparison,” Journal of AOAC International, Vol. 79, No. 4, 1996, pp. 895-901.
[30] International Conference on Harmonization, “Validation of Analytical Procedure, Text and Methodology Q2 (R1),” 2005 IFPMA, Geneva, Switzerland.
[31] M. L. Nollet and F. Toldra, “Handbook of Processed Meats and Poultry Analysis,” In: S. Rath and F. G. R. Reyes, Nitrosamines, Taylor & Francis Group, An In- forma Business, New York, 2009, p. 688.
[32] S. Yurchenko and U. Molder, “The Occurrence of Vola- tile N-Nitrosamines in Estonian Meat Products,” Food Chemistry, Vol. 100, No. 4, 2007, pp. 1713-1721.