Munich Personal RePEc Archive
The effects of workforce composition,
labor turnover, and the qualities of
entering and exiting workers on
productivity growth
Kronenberg, Kristin and Carree, Martin
Maastricht University
2010
Online at
https://mpra.ub.uni-muenchen.de/25844/
The effects of workforce composition, labor turnover,
and the qualities of entering and exiting workers
on productivity growth
Kristin Kronenberg1
Maastricht University, Maastricht, The Netherlands Statistics Netherlands (CBS), Heerlen, The Netherlands
Martin Carree2
Maastricht University, Maastricht, The Netherlands
This version: 12 October 2010
Abstract
This study identifies and analyzes the effects of firms’ workforce composition, labor turnover, and the qualities of entering and exiting employees on consequent changes in their productivity. Using register data provided by Statistics Netherlands, we examine the productivity dynamics of Dutch manufacturing firms between the years 2002 and 2005. The regression results illustrate that changes in firm productivity are not only determined by the composition of the firm’s current workforce and the degree of labor turnover, but also by the characteristics of the workers who enter and exit the firm. Firms benefit from the inflow of employees previously employed with other firms in the same industry, and with highly productive firms, whereas the inflow of workers from non-employment has a negative effect on their new employers’ productivity growth. Furthermore, the outflow of workers into non-employment, and to highly productive firms positively affects their old employers’ productivity growth, while the exit of workers who leave for firms in the same industry, and of those who simultaneously relocate (across long distances) has a negative effect.
JEL classification: J24, J61, J62, J63
Keywords: workforce composition, labor turnover, job mobility, employee mobility, productivity growth
1
Department of Organization and Strategy, School of Business and Economics, P.O. Box 616, 6200 MD Maastricht, The Netherlands. Phone: +31-43-3884793, Fax: +31-43-3884893, e-mail: K.Kronenberg@maastrichtuniversity.nl
2
1 Introduction
With a growing number of linked employer-employee datasets available, researchers
increasingly examine the relationship between employee characteristics and firm outcomes.
Firms employing workers with specific characteristics (e.g. longer firm tenure or higher
educational attainment) have been found to exhibit higher levels of productivity (e.g. Black &
Lynch, 1996; Blakemore & Hoffman, 1989; Cörvers, 1996; Eriksson and Lindgren, 2009;
Haltiwanger et al., 1999; Haskel et al., 2003; Ilmakunnas et al., 2004), or to experience
higher productivity growth in the future (Cörvers, 1996). Furthermore, it has been established
that the degree of labor turnover taking place within a firm also has an impact on its future
performance (e.g. Bingley & Westergaard-Nielsen, 2004; Boschma et al., 2009; Ilmakunnas
et al., 2005).
While numerous studies investigate how the qualities of a firm’s current workforce or
the entry and exit rates of employees are related to its productivity, the features of those
workers who enter and exit the firm are rarely taken into account. Notable and very recent
exceptions are the studies by Boschma et al. (2009), who found that the productivity growth
of firms is positively influenced by the inflow of employees having skills which are related to
the existing knowledge base of their new employer, while the inflow of workers having skills
which are similar to those already present in the company has a negative effect, and by
Somaya et al. (2008), who established that losing employees to competitors has a negative
impact on the performance of firms.
Yet, as pointed out by Ettlie (1980) in his seminal paper on manpower flows and
innovation three decades ago, ‘manpower flows are likely to have an important direct
influence on (...) the knowledge and skills of an organization’ (p. 1087). Hence, especially
when looking at changes regarding firms’ future performance, we argue that the
characteristics of those employees who altered the composition of a firm’s workforce and
2
In this study, we contribute to the existing work in this field by investigating the effects
of workforce composition, labor turnover, and particularly the qualities of entering and exiting
workers on firm productivity growth. We use a matched employer-employee dataset provided
by Statistics Netherlands (CBS) which is based on register data, and consists of information
regarding the characteristics of firms and their employees in the Dutch manufacturing sector
between the years 2002 and 2005.
In the empirical analysis, we investigate the determinants of changes in firms’ labor
productivity. We specify a ‘restricted model’ which only incorporates information on workforce
characteristics and labor turnover in order to explore possible differences between the
complete dataset including all firms, and a subsample of firms which experienced employee
entries from and exits to other firms. Consequently, we specify the ‘full model’ - incorporating
also the qualities of entering and exiting workers – for the subsample of firms with employee
entries from and exits to other firms.
The qualities of entering employees are measured through a firm’s share of entries
from non-employment, the average firm tenure (with the old employer) of those who enter the
firm, the average distance between employees’ places of residence before and after
changing jobs, the share of entries from firms in the same sector (5-digit level), and the
average performance of entering employees’ previous employers. Likewise, the qualities of
exiting employees are measured through a firm’s share of exits into non-employment, the
average firm tenure of those who exit the firm, the average distance between employees’
places of residence before and after changing jobs, the share of exits to firms in the same
sector (5-digit level), and the average performance of exiting employees’ new employers.
The results illustrate that changes in firm productivity are indeed not only determined
by the composition of the firm’s current workforce and the labor turnover taking place, but
also by the characteristics of the workers who enter and exit the firm. More specifically, we
establish that firms benefit from the inflow of employees who had previously been employed
with other firms in the same industry, and with highly productive firms, whereas the inflow of
growth. Furthermore, the outflow of workers into non-employment, and to highly productive
firms positively affects their old employers’ productivity growth, while the exit of workers who
leave for firms in the same industry, and of those who simultaneously relocate (across long
distances) has a negative impact. Our findings demonstrate that the qualities of entering and
exiting workers, especially in terms of the characteristics (industrial sector, level of
productivity) of their previous respectively future employers, have a considerable impact on
the productivity growth of their current employers.
The study is organized as follows: Section 2 provides an overview regarding the
theoretical background of the research. In Section 3, we outline the features of the data used
in our study, and indicate the sources they originate from. Section 4 presents the model
employed in the empirical analysis, and defines the variables which are used. In Section 5,
we outline the results, discuss our findings, and indicate possible limitations of the research.
Section 6 concludes. In the Appendix, all tables are provided.
2 Theoretical framework
2.1 Workforce composition and firm productivity
Many studies have yet analyzed the relationship between the characteristics of a firm’s
workforce and its performance. Plant productivity has been found to be higher in firms
employing workers with higher educational attainment (Black & Lynch, 1996; Cörvers, 1996;
Eriksson & Lindgren, 2009; Galindo-Rueda & Haskel, 2005; Haltiwanger et al., 1999; Haskel
et al., 2003; Ilmakunnas et al., 2004; Jones, 2001), or with longer firm tenure (e.g. Bertschek
& Meyer, 2008; Blakemore & Hoffman, 1989; Börsch-Supan & Weiss, 2004; Ilmakunnas et
al., 2004). These findings are generally interpreted along the lines of human capital theory,
since employees’ firm- or job-specific human capital is assumed to increase with firm tenure,
and workers with higher levels of specific knowledge and skills are expected to be
4
highly educated employees are argued to possess higher amounts of general human capital,
enabling them to work more efficiently (Cörvers, 1996), and to adapt more easily to
technological change and the consequent use of new technologies (Cörvers, 1996;
Ilmakunnas et al., 2004), thereby also having a positive impact on their employers’
performance.
Regarding the effect of workers’ age on firm productivity, the findings are more
ambiguous. Eriksson and Lindgren (2009), Haltiwanger et al. (1999) and van Ours (2009)
found that firms employing higher fractions of older workers are less productive, while e.g.
Hellerstein et al. (1999) observed that productivity increases with age. Many studies (e.g.
Ilmakunnas et al., 2004; Grund & Westergaard-Nielsen, 2005) established an inverse
U-shaped relationship between the average age of a firm’s workforce and its productivity.
These findings suggest that earlier in their careers, workers accumulate valuable job- or
task-specific knowledge and skills, but become less industrious after having reached a certain
age.
The composition of a firm’s workforce may not only have an effect on the level, but
also on the growth of its productivity over time. As argued by Cörvers (1996), workers with
higher levels of education may be more capable of detecting profitable innovations. Thus,
firms with better educated workers have a higher chance to quickly and successfully
innovate, and will therefore experience higher productivity growth.
2.2 Labor turnover and firm productivity
Not only the composition of a firm’s workforce, but also its dynamics can be expected to have
an effect on a firm’s subsequent performance. Ilmakunnas et al. (2005), for example, found
that the employee inflow rate positively affects firm productivity growth. This is argued to be
consistent with human capital theory, as firms are assumed to hire workers who possess
specific valuable skills and attributes they gained with their previous employers. Boschma et
plants, and Bingley & Westergaard-Nielsen (2004) likewise established a negative
relationship between a firm’s fraction of newly hired employees and its profitability. These
findings are argued to reflect the costs associated with hiring new employees (e.g. training).
Regarding the effect of separations on firm performance, Ilmakunnas et al. (2005)
found that firm productivity growth is negatively affected by the employee outflow rate,
assuming that this effect reflects layoffs and quits of high-productivity workers. Bingley and
Westergaard-Nielsen (2004), on the other hand, identified a positive relationship between a
firm’s employee outflow rate and its profitability. They argued that separations are mostly
involuntary, as employers may predominantly lay off the least productive or the most
overpaid workers.
2.3 The qualities of entering and exiting employees and firm productivity
Both the characteristics of a firm’s current workforce, and the extent of employee turnover
taking place have been analyzed with respect to their effect on the level or growth of firms’
productivity. To this point, however, much less attention has been paid to the relationship
between the characteristics of those employees who enter or leave, and the consequent
changes in the performance of the firm which experiences these entries and exits.
Notable exceptions are Boschma et al. (2009), analyzing the effect of the relatedness
between an employee’s previous and current employer on consequent changes regarding
the productivity of the latter, and Somaya et al. (2008), investigating the impact of employee
in- and outflows to and from competitors and potential clients on firm performance.
Regarding the entry of new workers, Boschma et al. (2009) found that the inflow of
employees having skills which are related to the existing knowledge base of their new
employer positively affects productivity growth, while the inflow of workers having skills which
are similar to those already present in the company has a negative effect. It could thus be
demonstrated that the qualities of newly hired employees, especially seen in relation to the
6
respect to the outflow of employees, Somaya et al. (2008) discovered that losing employees
to competitors has a negative impact on a firm’s performance. This illustrates that the
qualities of exiting employees, particularly when seen in relation to the characteristics of their
new employer, have an impact on the performance of their old employer.
These findings suggest that when analyzing changes regarding the performance of a
firm, not only the characteristics of its current workforce and the extent of employee turnover
taking place have to be taken into account. Additionally, it is crucial to examine the qualities
of those employees entering or exiting the firm, especially when seen in relation to the
characteristics of their previous respectively future employers. In this study, we therefore
investigate the effects of workforce composition, labor turnover, and the qualities of entering
and exiting workers on firm productivity growth.
More specifically, we argue that the share of entries from non-employment, the
average firm tenure (with the old employer) of entering employees, the average distance
between entering employees’ places of residence before and after changing jobs, the share
of entries from firms in the same sector (5-digit level), and the average performance of
entering employees’ previous employers will have an effect on their new employers’
productivity growth. Likewise, the share of exits into non-employment, the average firm
tenure of exiting employees, the average distance between exiting employees’ places of
residence before and after changing jobs, the share of exits to firms in the same sector
(5-digit level), and the average performance of exiting employees’ new employers will have an
effect on their old employers’ productivity growth.
As argued by Bingley & Westergaard-Nielsen (2004), employers may predominantly
lay off their least productive employees. We thus expect that workers who have been
unemployed before entering a new firm may not be the most industrious employees, and
might therefore hamper the productivity growth of their new employer.
It is generally assumed that employees’ knowledge and skills increase with
experience, and productivity has consequently been found to be higher in firms which employ
Börsch-Supan & Weiss, 2004; Ilmakunnas et al., 2004). Besides firm-specific skills, workers
will also accumulate job-, task- or industry-specific knowledge over time, and can
consequently put these skills to use with other employers. We therefore hypothesize that
particularly workers who had been working with another employer for a long time possess
valuable expertise, and will be able to facilitate the productivity growth of their new
employers.
Especially ambitious (highly-educated, well-paid) individuals who aim to advance their
careers appear to be willing to simultaneously change employers and relocate (Kronenberg
& Carree, 2010), since ‘individuals with high human capital move to productive locations (…)
in order to take advantage of their skills’ (Chen & Rosenthal, 2008, p. 520). We thus assume
that employees who relocate will foster the productivity growth of their new employer, and
this effect will be particularly strong in the case of long-distance migration.
As previously argued, we believe that the qualities of employees entering a firm
should be seen in relation to the characteristics of their previous employers. It has been
demonstrated that firms benefit from gaining employees from competitors (Somaya et al.,
2008). At the same time, the outflow of workers to competitors has been found to be
detrimental to the performance of their old employers (Campbell et al., 2009). These findings
can be interpreted along the lines of human capital theory, since employees who have
previously been working with a competitor in the same industry are likely to possess useful
industry- or task-specific knowledge. We thus expect that the inflow of employees from direct
competitors in the same industry will positively affect the productivity growth of their new
employers.
Furthermore, it can be assumed that employees who had previously been employed
with a well-performing firm contributed to the performance of their old employers by putting
their knowledge and skills to use. We therefore hypothesize that employees who have
previously been working for well-performing firms will be able to also enhance the
8
Employees may voluntarily change employers in order to, for example, receive higher
wages, to benefit from superior career opportunities, or to reduce their daily commuting time
(e.g. Clark et al., 2003; Henneberger and Sousa-Poza, 2002; Linneman and Graves, 1983;
Schneider, 2007). On the other hand, employers may lay off those workers who are least
industrious (Bingley & Westergaard-Nielsen, 2004), and it might be comparatively difficult for
these individuals to find a new job after having become unemployed. We therefore expect
that firms will benefit from the exit of employees into unemployment.
Productivity has been found to increase with firm tenure (e.g. Bertschek & Meyer,
2008; Blakemore & Hoffman, 1989; Börsch-Supan & Weiss, 2004; Ilmakunnas et al., 2004),
as employees build up knowledge, skills and experience. Yet, as previously argued, workers
not only accumulate firm-specific skills, but also job-, task- or industry-specific knowledge
which they may also use with other employers. We thus hypothesize that particularly workers
who had been employed with a firm for a long time possess valuable expertise, and will
hamper the productivity growth of their old employer when leaving.
Specifically ambitious individuals may be willing to simultaneously change employers
and relocate (Kronenberg & Carree, 2010) in order to advance their careers. We therefore
hypothesize that the exit of employees who also relocate will hamper the productivity growth
of their old employers, and this effect will be particularly strong in the case of long-distance
migration.
It has been demonstrated that firms suffer from losing employees to competitors
(Somaya et al., 2008; Campbell et al., 2009), as these individuals are likely to possess useful
industry- or task-specific knowledge which they can also put to use with their new employers.
We therefore assume that the outflow of employees to direct competitors in the same
industry will negatively affect the productivity growth of their old employers.
Furthermore, it can be expected that employees who leave for a firm which
consequently performs well have also been able to contribute to the performance of their old
employers. We thus hypothesize that employees who exit in order to work for well-performing
3 Data
3.1 Data sources
The data employed in this study were provided by Statistics Netherlands (CBS), allowing us
to create an employer-employee matched dataset which consists of information regarding a
firm’s characteristics as well as the composition and the dynamics of its workforce.
Firm data (industrial sector, age, size, financial outcomes) are available on the level
of the business unit (BE) which is defined on the basis of its economic activity. The data
originate from the business register (ABR), the Survey on Employment and Wages (EWL),
the Survey Production Statistics (SBS and STS), and data provided by the Dutch Tax
Administration.
Information regarding employees stems from the Social Statistical Database (SSB),
and is compiled on the basis of register data from two main sources. Personal information
(e.g. date of birth, gender, address) within the SSB originates from the municipal registration
system (GBA), while data regarding employees’ jobs (e.g. employer, duration of
employment) is provided by the Dutch Tax Administration.
As the location of employees’ place of residence is known for each year at a specific
reference date (last Friday in September) on the level of the municipality, we use the
distance between the location of an employee’s place of residence in 2002 and 2003
respectively as a measure of the distance covered in case of a residential relocation.
3.2 Data description
In order to analyze the effects of workforce composition, labor turnover, and the qualities of
entering and exiting employees on changes in firm productivity, we selected firms (on the
level of the business unit) which were active with employees from at least January 2002 until
10
(turnover per year) was available for the years 2002 until 2005. We restricted our analysis to
fulltime employees (at least 0.8 FTE), and therefore excluded firms which only employed
parttime workers in any of the years between 2002 and 2005.
When discussing the results, we focus on the manufacturing sector (NACE3 15-37).
Many studies dealing with the relationship between employee characteristics and firm
outcomes concentrate on the manufacturing industry (see e.g. Cörvers, 1996; Hellerstein et
al., 1999; Ilmakunnas et al., 2004), so we can compare our results to the findings presented
in these studies4.
While information regarding employees’ duration of employment is available with
exact start and end dates, individuals’ personal characteristics (e.g. place of residence) are
determined once a year at a specific reference date (last Friday in September). Since only at
those points in time, reliable information regarding all variables of interest is available, we
decided to take ‘employee snapshots’ at the reference dates in the two consecutive years
2002 and 2003.
The dataset thus consists of information regarding a firm’s workforce composition in
2002, its entry and exit rates between the reference dates (last Friday in September) in 2002
and 2003, the qualities of those employees who entered or left the firm between those
reference dates, and changes in its labor productivity (natural logarithm of turnover per
employee) between the years 2003 and 2004 respectively 2003 and 2005.
Especially with respect to larger firms with more than one establishment, determining
changes in labor productivity (turnover per employee) can be difficult, since both the firm’s
employees and its turnover may be allocated to different establishments in consecutive
years. We therefore decided to only incorporate firms in the analysis which did not exhibit
disproportionate variation regarding the size of their workforce between 2002 and 2005. Our
selection thus only includes those companies for which the value of the average number of
3
Nomenclature statistique des activiés économiques dans la Communauté Européenne
4 Findings for other sectors (Construction; Retail and wholesale; Hotels and restaurants; Transport, storage and
employees in the years 2002, 2003, 2004 and 2005 respectively divided by the overall
average number of employees for those four years was higher than 0.5 and lower than 2.
Furthermore, in order to exclude e.g. holdings with a high yearly turnover and a
comparatively low number of employees from the analysis, we discarded all firms for which
turnover per employee was higher than 5,000,000 in any year between 2002 and 2005.
Likewise, firms for which turnover per employee was lower than 5,000 in any year between
2002 and 2005 were also excluded5.
With all these restrictions imposed, our dataset consists of 15,794 firms for which
information on workforce composition, labor turnover and changes in labor productivity is
available. Yet, since only 3,672 of these firms had entries from and exits to other firms,
information on the qualities of employees entering from and leaving for other firms were only
available for this subsample of firms.
4 Methodology
4.1 Model
We employ a least squares regression model, assuming that changes in a firm’s level of
productivity depend on the composition of its current workforce, the share of entries and
exits, and the qualities of workers entering and exiting the firm. The model is weighted by the
square root of the size of the firm (average number of employees) in 2002 in order to
diminish the otherwise comparatively large impact of small firms (see e.g. Boschma et al.,
2009) often having few entries and exits.
Let Q be total output and L be total labor force (FTE), then our measure of labor
productivity for firmi in yeart is
y = ln(Qit/Lit)
5
12
Now assume a partial adjustment process of the labor productivity towards the industry
average, as follows:
yit = (y*St – yi, t-1)
where S is the industry that firm i is in. The parameter reflects the speed of adjustment.
The model can be extended with (temporary) effects of changes in the workforce by including
them as explanatory variable(s)xit:
yit = y*St – yi, t-1+ xi,t-1
In our models we use industry dummies for y*St, assuming these to be constant in the
three-year period.
4.2 Variables
The dependent variable measures changes in the labor productivity of firms, proxied by the
natural logarithm of turnover per employee in 2005 respectively 2004 minus the natural
logarithm of turnover per employee in 2003 (TPE_2005_LOG_TPE_2003_ LOG respectively
TPE_2004_ LOG _TPE_2003_ LOG).
Table 1 presents the explanatory and control variables employed in the analysis.
AGE is the average age of a firm’s workforce in 2002, and FIRM_TENURE denotes the
average number of years a firm’s employees have been with their current employer. In order
to check for non-linear effects, we also incorporate AGE_SQUARED and FIRM_TENURE_
SQUARED in the analysis. ENTRY is the rate of employee entry between the reference
dates in 2002 and 2003, and EXIT is the respective rate of exit.
ENTRY_NO_JOB is the share of a firm’s new employees entering the firm from
non-employment in the previous year, ENTRY_AVG_AGE is the average age of those employees
entering a firm between the reference dates in 2002 and 2003, and
ENTRY_AVG_FIRM_TENURE denotes the average number of years a firm’s new
indicates the average distance between the places of residence in 2002 and 2003 among
those employees entering the firm between the reference dates in 2002 and 2003,
ENTRY_SAME_SBI is the share of a firm’s new employees coming from a firm in the same
sector (5-digit level), and ENTRY_AVG_TPE_OLDFIRM_LOG denotes the average labor
productivity – proxied by the natural logarithm of turnover per employee – of a firm’s new
employees’ previous employers in 2002.
EXIT_NO_JOB is the share of a firm’s exiting employees which were non-employed
in the following year, EXIT_AVG_AGE is the average age of those employees exiting a firm
between the reference dates in 2002 and 2003, and EXIT_AVG_FIRM_TENURE denotes
the average number of years a firm’s exiting employees had been employed with the firm.
EXIT_AVG_DISTANCE indicates the average distance between the places of residence in
2002 and 2003 among the employees exiting the firm between the reference dates in 2002
and 2003, EXIT_SAME_SBI is the share of a firm’s exiting employees leaving for a firm in
the same sector (5-digit level), and EXIT_AVG_TPE_NEWFIRM_LOG denotes the average
labor productivity – proxied by the natural logarithm of turnover per employee – of a firm’s
exiting employees’ new employers in 2003.
We control for the age of a firm, since older firms have been found to be less
productive than younger organizations (e.g. Addison and Belfield, 2004). FIRM_AGE
therefore indicates the age of the company in 2002. Furthermore, as demonstrated by
Haltiwanger et al. (1999), a firm’s previous level of productivity negatively impacts future
productivity growth. We therefore also control for the firm’s level of productivity in 2002,
which is denoted by the natural logarithm of turnover per employee in 2002
(TPE_2002_LOG). Furthermore, we include sector dummies (2-digit level) which distinguish
the 23 manufacturing industries (NACE 15-37).
The descriptive statistics for the explanatory and control variables used in the study
are displayed in Table 2 and 3. Table 2 presents the variables used in the restricted model,
14
On average, a firm’s workforce was 37.84 years old in 2002, and its employees had
been employed with their current employer for 5.58 years. Firms had an average entry rate of
14.1% between the reference dates in 2002 and 2003, and an exit rate of 14.9%. On
average, these firms were 19.27 years old in 2002, and their average labor productivity
(natural logarithm of turnover per employee) amounted to 11.61.
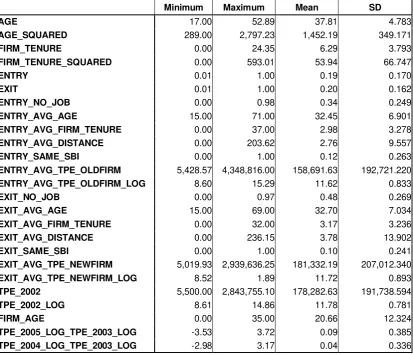
With respect to firms having entries from and exits to other firms, the average age of
such a firm’s workforce was 37.81 years, and its employees had been employed with their
current employer for 6.29 years. Firms had an average entry rate of 19.5% between the
reference dates in 2002 and 2003, and an exit rate of 20.4%. On average, these firms were
20.66 years old in 2002, and their average labor productivity (natural logarithm of turnover
per employee) amounted to 11.78.
For those firms with entries from and exits to other firms, a firm’s average share of
employees entering from non-employment was 34.3%6. On average, a firm had incoming
employees who were 32.45 years old, had been employed with their previous employer for
2.98 years, and had moved 2.76 kilometers during the year in which they changed jobs.
Some 11.6 % of a firm’s new employees came from a firm in the same industry (5-digit level).
On average, a firm had incoming employees who had previously been employed with
employers for which the log of turnover per employee in 2002 amounted to 11.62.
A firm’s average share of employees exiting into non-employment was 47.8%7. On
average, a firm had exiting employees who were 32.7 years old, had been employed with
their employer for 3.17 years, and moved 3.78 kilometers during the year in which they
changed jobs. Some 9.8% of a firm’s exiting employees switched to a firm in the same
industry (5-digit level). On average, a firm had exiting employees who changed to employers
for which the log of turnover per employee in 2003 amounted to 11.72.
6 This number may appear quite high at first glance. Yet, since we only took ‘employment snapshots’ at the two
reference dates in two consecutive years, in can easily be the case that a person who is employed for the most part of a year does not hold a job at this specific point in time. Furthermore, since we only included fulltime workers in our analysis, e.g. employees who changed from a parttime job to a fulltime job were regarded as non-employed in the former year.
7
5 Results and discussion
We find that changes in firm productivity are indeed determined by the composition of the
firm’s current workforce, the degree of labor turnover taking place, and the characteristics of
the employees who enter and exit the firm.
5.1 The impact of workforce composition and firm characteristics on productivity
growth
We find that the characteristics of a firm’s workforce not only affect the level of its labor
productivity, but also have an impact on its productivity growth over the next years. As
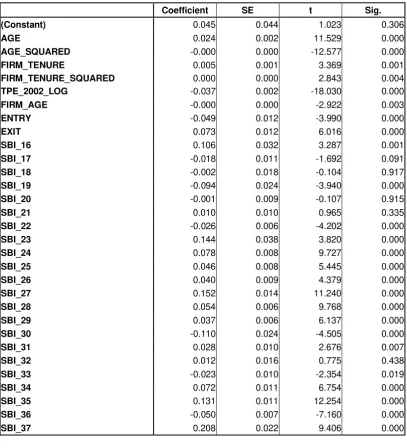
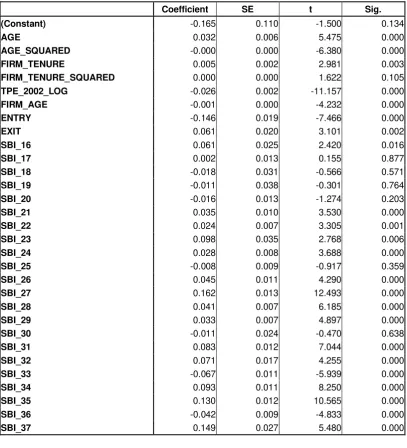
Tables 4-9 illustrate, AGE has a positive effect on consequent productivity growth, while the
effect of AGE_SQUARED is generally negative. This means that firms employing a prime
age workforce will experience future increases in productivity, whereas firms which employ
workers which are either younger, or older do not benefit from their choice of employees.
These findings suggest that prime age workers may indeed have the knowledge and
experience neccessary in order to increase their employers’ performance while still not
having reached an age at which future capacity increases both mentally and physically
-may become increasingly demanding. Firm merely employing younger workers, on the other
hand, possibly do not have access to any experienced workers which will be able to facilitate
future productivity growth, whereas firms with an older workforce might suffer from their
employees’ mental and physical fatigue and decreasing motivation.
We also find that firms employing workers with longer firm tenure generally
experience higher productivity growth (Tables 4-9), indicating that employees’ firm- or
job-specific human capital indeed increases with firm tenure, and workers with more experience
and higher levels of specific knowledge and skills will be capable of contributing to the future
16
productivity growth is not linear, but generally increases over time, suggesting that firms with
a stable workforce will benefit from their employees’ capabilities particularly in the long run.
As predicted by Haltiwanger et al. (1999), firms with higher present levels of
productivity will grow less in upcoming years (Tables 4-9). Furthermore, in relation to e.g.
Addison and Belfield (2004), we found that older firms are not only less productive than
younger organizations, but will also experience lesser amounts of future productivity growth
(Tables 4-9).
5.2 The impact of labor turnover on productivity growth
The rate of employee entry has a negative impact on productivity growth, indicating that the
general hiring of new employees indeed entails considerable costs (Boschma et al., 2009;
Bingley & Westergaard-Nielsen, 2004), and therefore negatively affects future firm
performance (Tables 4-9).
We also established that productivity growth is positively affected by the rate of
employee exit (Tables 4-9). These findings suggest that employers may indeed
predominantly lay off the least productive or the most overpaid workers (Bingley &
Westergaard-Nielsen, 2004) in order to increase their future productivity.
5.3 The impact of the qualities of entering and exiting employees on productivity
growth
We established that higher shares of employee inflows from non-employment have a
negative effect on a firms productivity growth in the following year (Table 9). These results
indicate that newly hired employees who have previously been non-employed may indeed
impede the productivity growth of their new employer at least in the short run, but this effect
seems to disappear with time (Table 8). There might be several explanations for this
previous employers due to substandard performance (see e.g. Bingley &
Westergaard-Nielsen, 2004), and might consequently also hamper the productivity growth of their new
employers (before possibly being laid off by those as well). On the other hand, previously
non-employed individuals (among which are also recent university graduates) might simply
need some time to adjust to working effectively in a (first) fulltime position, after which they
will be able to contribute adequately to their new employers’ performance.
Furthermore, we found that the average firm tenure (with their previous employer) of
entering employees negatively affects their new employers’ long-run productivity growth
(Table 8). These findings do not confirm our assumptions, but suggest that workers who had
been working with another employer for a long time do not possess exceptional amounts of
valuable expertise which they can transfer to and use with their new employers. Instead, it
seems to be the case that these employees have become incapable of adjusting to and
working efficiently in a new environment, and might therefore hamper the productivity growth
of their new employers.
Contrary to our expectations, we established that the average distance between
entering employees’ places of residence before and after changing jobs has a long-run
negative impact on the performance of their new employers (Table 8).
As hypothesized, we found that higher shares of inflows from firms in the same sector
(5-digit level) have a positive effect on productivity growth (Tables 8 and 9). Our findings are
in line with Somaya et al. (2008), who demonstrated that firms profit from acquiring
employees from competitors. It can thus be assumed that employees who have previously
been working with a firm in the same industry are likely to possess valuable industry- or
task-specific knowledge, and their inflow will therefore positively affect the productivity growth of
their new employers.
We also established that productivity growth is indeed positively affected by the
average performance of entering employees’ previous employers (Tables 8 and 9). This
18
performance of their old employers will also enhance the productivity of the firms they newly
enter.
As expected, the share of employees exiting into unemployment has a positive
impact on firms’ productivity growth (Tables 8 and 9). This suggests that these employees
might indeed have been laid off due to unsatisfactory performance, and consequently
experienced difficulties in finding a new employer, whereas their old employers benefited
from their exit.
We also found that the average firm tenure of exiting employees has a positive effect
on the productivity growth of their old employers (Tables 8 and 9). This does not confirm our
assumptions, but indicates that employees who had been working with the same employer
for a long time might have become less motivated and productive over time, so their
employers ultimately benefited from their exit.
Furthermore, we established that the average distance between exiting employees’
places of residence before and after changing jobs has a negative impact on the productivity
growth of their old employers (Tables 8 and 9). These findings suggest that highly productive
individuals who are able to substantially contribute to their employers’ performance aim to
advance their careers by selecting the job which enables them to make the most of their
skills, even if this entails relocating (e.g. Chen & Rosenthal, 2008; Kronenberg & Carree,
2010). Thus, firms which are not capable of retaining ambitious workers who are willing to
change jobs and relocate in order to advance their careers will consequently suffer from
losing these employees.
As hypothesized, we demonstrated that the share of employee outflows to firms in the
same industry (5-digit level) negatively affects productivity growth (Tables 8 and 9), indicating
that losing employees to competitors indeed has a negative impact on a firm’s performance
(Somaya et al., 2008; Campbell et al., 2009). Our findings suggest that these employees are
likely to possess useful industry- or task-specific knowledge which they can put to use in their
new positions, whereas their old employers have to deal with the loss of these workers’
We also found that the average performance of exiting employees’ new firms has a
positive impact on productivity growth (Tables 8 and 9). These findings may be surprising at
first sight, since we expected that the exit of valuable employees who are sought after by
other employers would mean that their capabilities leave with them, thus hampering the
functioning of their old employers. However, it may also be the case that the capable
employees of well-performing firms may advance their careers by changing employers, while
their old employers – having a good reputation - will easily be able to find other talented
workers to replace those (see e.g. Haltiwanger et al., 2007, and Mendes et al., 2007, who
found that productive workers and firms generally team up).
The model which also incorporates the qualities of entering and exiting workers
(Tables 8 and 9) exhibits higher R²-values than the model which only includes workforce
characteristics and labor turnover (Tables 4-7), indicating the relevance of the additional
predictors. Yet, it should be noted that even the full model (Tables 8 and 9) has only
moderate predictive power and would therefore have benefited from the inclusion of further
explanatory variables.
6 Limitations
This study is, however, not without limitations. First of all, regarding the information available
on employees, an analysis of the effects of labor turnover and employee characteristics on
changes in firm productivity would certainly have benefited from differentiating between
voluntary and involuntary interfirm mobility. Furthermore, it would have been worthwhile to
differentiate between occupations of workers. Unfortunately, the data available neither
provide information regarding the reasons underlying the job mobility of employees, nor
regarding their occupations.
Regarding firm-level information, our analysis would have gained from the inclusion of
variables covering e.g. firms’ R&D efforts, importing/exporting intensity, or the amount of FDI
20
productivity (e.g. Belderbos et al., 2004; Griliches, 1986; Keller & Yeaple, 2009; Fryges &
Wagner, 2010; Vogel & Wagner, 2010). Yet, with the available data, originating from register
information, including such variables was unfortunately not possible.
7 Conclusion
Although researchers increasingly examine the relationship between employee
characteristics and firm outcomes, studies dealing with the relationship between the
characteristics of those workers who enter or exit the firm, and consequent changes in firm
productivity are still remarkably scarce. This study therefore contributes to the existing body
of literature by investigating the effects of workforce composition, labor turnover, and
particularly the qualities of entering and exiting workers on firm productivity growth.
The results illustrate that changes in firm productivity are not only determined by the
composition of the firm’s current workforce and the degree of labor turnover taking place, but
also by the characteristics of the workers who enter and exit the firm. We find that firms
benefit from the inflow of employees who had previously been employed with other firms in
the same industry, and with highly productive firms, whereas the inflow of workers from
non-employment has a negative on their new employers’ productivity growth. Furthermore, the
outflow of workers into non-employment, and to highly productive firms positively affects their
old employers’ productivity growth, while the exit of workers who leave for firms in the same
industry, and of those who simultaneously relocate (across long distances) has a negative
impact. Our findings demonstrate that the qualities of entering and exiting workers, especially
seen in relation to the features of their previous respectively future employers, have a
considerable impact on their current employers’ subsequent productivity growth.
Following Boschma et al. (2009), we have been able to demonstrate that ‘the effects
of labor mobility on firm performance can only be accounted for after differentiating between
different types of labor inflows’ (Boschma et al., 2009, p. 186), as well as the respective
its workers, by the selection of valuable new employees, and the attrition of those who have
22
References
Addison, J.T., Belfield, C.R., 2007, Unions, Training and Firm Performance: Evidence from
the British Workplace Relations Survey,IZA Discussion Paper,1264, 1-41.
Belderbos, R., Carree, M., Lokshin, B., 2004, Cooperative R&D and firm performance,
Research Policy, 33 (10), 1477-1492.
Bertschek, I., Meyer, J., 2009, Do older workers lower IT-enabled productivity? Firm-level
evidence from Germany,Jahrbücher für Nationalökonomie und Statistik, 29 (2-3), 327-342.
Bingley, P., Westergaard-Nielsen, N., 2004, Personnel policy and profit, Journal of Business
Research, 57 (5), 557-563.
Black, S.E., Lynch, L.M., 1996, Human-Capital Investments and Productivity, AEA Papers
and Proceedings, 86 (2), 263-267.
Blakemore, A.E., Hoffman, D.L., 1989, Seniority Rules and Productivity: An Empirical Test,
Economica, 56, 359-371.
Boschma, R., Eriksson, R., Lindgren, U., 2009, How does labour mobility affect the
performance of plants? The importance of relatedness and geographical proximity,Journal of
Economic Geography, 9 (2), 169-190.
Börsch-Supan, A., Weiss, M., 2008, Productivity and the age composition of work teams:
Campbell, B., Ganco, M., Franco, A., Agarwal, R., 2009, Who leaves, where to, and why
worry? Employee mobility, employee entrepreneurship, and effects on source firm
performance,Center for Economic Studies, U.S. Census Bureau, Working Papers, 1-46.
Chen, Y., Rosenthal, S.S., 2008, Local amenities and life-cycle migration: Do people move
for jobs or fun?,Journal of Urban Economics, 64 (3), 519-537.
Clark, W.A.V., Huang, Y., Withers, S., 2003. Does commuting distance matter? Commuting
tolerance and residential change,Regional Science and Urban Economics, 33 (2), 199-221.
Cörvers, F., 1996, The impact of human capital on labour productivity in manufacturing
sectors of the European Union,ROA-RM.1996/2E, 1-22.
Eriksson, R., Lindgren, U., 2008, Localized mobility clusters: impacts of labour market
externalities on firm performance,Journal of Economic Geography, 9 (1), 33-53.
Ettlie, J.E., 1980, Manpower flows and the innovation process, Management Science, 26
(11), 1086-1095.
Fryges, H., Wagner, J., 2010, Exports and Productivity Growth: First Evidence from a
Continuous Treatment Approach,Review of World Economics, 144 (4), 695-722.
Galindo-Rueda, F., Haskel, J., 2005, Skills, workforce characteristics and firm-level
productivity in England, Report prepared for the Department of Trade and Industry,
Department for Education and Skills, Office for National Statistics, 1-44.
Griliches, Z., 1986, Productivity, R&D, and Basic Research at the Firm Level in the 1970’s,
24
Grund, C., Westergaard-Nielsen, N., 2008, Age Structure of the Workforce and Firm
Performance,International Journal of Manpower,29 (5-6), 410-422.
Haltiwanger, J.C., Lane, J.I., Spletzer, J.R., 1999, Productivity Differences Across
Employers: The Roles of Employer Size, Age, and Human Capital, AEA Papers and
Proceedings, 89 (2), 94-98.
Haltiwanger, J.C., Lane, J.I., Spletzer, J.R., 2007, Wages, productivity, and the dynamic
interaction of businesses and workers,Labour Economics, 14 (3), 575-602.
Haskel, J., Hawkes, D., Pereira, S., 2003, Skills and productivity in the UK using matched
establishment, worker and workforce data,CeRiBA Discussion Paper, 1-33.
Hellerstein, J.K., Neumark, D., Troske, K.R., 1999, Wages, Productivity, and Worker
Characteristics: Evidence from Plant-Level Production Functions and Wage Equations,
Journal of Labor Economics, 17 (3), 409-446.
Henneberger, F., Sousa-Poza, A., 2002. Beweggründe und Determinanten
zwischenbetrieblicher Mobilität: Die Schweiz in einer internationalen Perspektive, MittAB,
2/2002, 205-231.
Ilmakunnas, P., Maliranta, M., Vainiomäki, J., 2004, The Roles of Employer and Employee
Characteristics for Plant Productivity,Journal of Productivity Analysis, 21 (3), 249-276.
Ilmakunnas, P., Maliranta, M., Vainiomäki, J., 2005, Worker turnover and productivity growth,
Jones, P.,2001, Are educated workers really more productive?, Journal of Development
Economics, 64 (1), 57-79.
Keller, W., Yeaple, S.R., 2009, Multinational enterprises, international trade, and productivity
growth: firm level evidence from the United States,The Review of Economics and Statistics,
91 (4), 821-831.
Kronenberg, K., Carree, M., 2010, Job and residential mobility in the Netherlands: the
influence of human capital, household composition and distance (working paper).
Linneman, P., Graves, P.E., 1979. Household Migration: Theoretical and Empirical Results,
Journal of Urban Economics, 6 (3), 383-404.
Mendes, R., van den Berg, G.J., Lindeboom, M., 2007, An Empirical Assessment of
Assortative Matching in the Labor Market,IZA Discussion Paper,3053, 1-30.
Schneider, L., 2007. Zu alt für einen Wechsel? Zum Zusammenhang von Alter,
Lohndifferentialen und betrieblicher Mobilität, IWH-Diskussionspapiere, 1/2007, 2-25.
Somaya, D., Williamson, I.O., Lorinkova, N., 2008, Gone But Not Lost: The Different
Performance Impacts of Employee Mobility Between Cooperators Versus Competitors, The
Academy of Management Journal, 51 (5), 936-953.
van Ours, J.C., 2009, Will You Still Need Me – When I’m 64?, De Economist, 157 (4),
26
Vogel, A., Wagner, J., 2010, Higher Productivity in Importing German Manufacturing Firms:
Self-Selection, Learning from Importing, or Both?,Review of World Economics, 145 (4),
Appendix
Table 1: Definitions of variables used in the analysis
Variable Definition
TPE_2005_LOG_TPE_2003_LOG Changes in productivity (natural log of turnover per employee in 2005 minus natural log of turnover per employee in 2003)
TPE_2004_LOG_TPE_2003_LOG Changes in productivity (natural log of turnover per employee in 2004 minus natural log of turnover per employee in 2003)
AGE Average age of the firm’s workforce in 2002 AGE_SQUARED (Average age of the firm’s workforce in 2002)² FIRM_TENURE Average firm tenure of the firm’s workforce in 2002 FIRM_TENURE_SQUARED (Average firm tenure of the firm’s workforce in 2002)² ENTRY Rate of employee entry between 2002 and 2003 EXIT Rate of employee exit between 2002 and 2003 ENTRY_NO_JOB Share of entries from non-employment ENTRY_AGE Average age of entering employees
ENTRY_FIRM_TENURE Average firm tenure (with previous employer) of entering employees ENTRY_AVG_DISTANCE Average distance between entering employees’ places of residence
in 2002 and 2003
ENTRY_SAME_SBI Share of entries from same sector (5-digit level)
ENTRY_AVG_TPE_OLDFIRM_LOG Average performance (natural log of turnover per employee) of new employees’ old employers in 2002
EXIT_NO_JOB Share of exits into non-employment EXIT_AGE Average age of exiting employees EXIT _FIRM_TENURE Average firm tenure of exiting employees
EXIT _AVG_DISTANCE Average distance between exiting employees’ places of residence in 2002 and 2003
EXIT _SAME_SBI Share of exits to same sector (5-digit level)
EXIT _AVG_TPE_NEWFIRM_LOG Average performance (natural log of turnover per employee) of exiting employees’ new employers in 2003
FIRM_AGE Age of the firm in 2002
28
Table 2: Descriptives (all firms)
Minimum Maximum Mean SD
AGE 15.00 73.00 37.84 7.317
AGE_SQUARED 225.00 5,329.00 1.485.50 567.061
FIRM_TENURE 0.00 33.00 5.58 3.674
FIRM_TENURE_SQUARED 0.00 1,089.00 44.66 62.338
ENTRY 0.00 1.00 0.14 0.186
EXIT 0.00 1.00 0.15 0.185
TPE_2002 5,218.00 4,670,000.00 152,465.56 192,748.237
TPE_2002_LOG 8.56 15.36 11.61 0.756
FIRM_AGE 0.00 35.00 19.27 12.108
TPE_2005_LOG_TPE_2003_LOG -4.63 3.72 0.05 0.456
TPE_2004_LOG_TPE_2003_LOG -4.23 3.67 0.04 0.379
Number of observations: 15,794
Table 3: Descriptives (firms with entries from and exits to other firms)
Minimum Maximum Mean SD
AGE 17.00 52.89 37.81 4.783
AGE_SQUARED 289.00 2,797.23 1,452.19 349.171
FIRM_TENURE 0.00 24.35 6.29 3.793
FIRM_TENURE_SQUARED 0.00 593.01 53.94 66.747
ENTRY 0.01 1.00 0.19 0.170
EXIT 0.01 1.00 0.20 0.162
ENTRY_NO_JOB 0.00 0.98 0.34 0.249
ENTRY_AVG_AGE 15.00 71.00 32.45 6.901
ENTRY_AVG_FIRM_TENURE 0.00 37.00 2.98 3.278
ENTRY_AVG_DISTANCE 0.00 203.62 2.76 9.557
ENTRY_SAME_SBI 0.00 1.00 0.12 0.263
ENTRY_AVG_TPE_OLDFIRM 5,428.57 4,348,816.00 158,691.63 192,721.220
ENTRY_AVG_TPE_OLDFIRM_LOG 8.60 15.29 11.62 0.833
EXIT_NO_JOB 0.00 0.97 0.48 0.269
EXIT_AVG_AGE 15.00 69.00 32.70 7.034
EXIT_AVG_FIRM_TENURE 0.00 32.00 3.17 3.236
EXIT_AVG_DISTANCE 0.00 236.15 3.78 13.902
EXIT_SAME_SBI 0.00 1.00 0.10 0.241
EXIT_AVG_TPE_NEWFIRM 5,019.93 2,939,636.25 181,332.19 207,012.340
EXIT_AVG_TPE_NEWFIRM_LOG 8.52 1.89 11.72 0.893
TPE_2002 5,500.00 2,843,755.10 178,282.63 191,738.594
TPE_2002_LOG 8.61 14.86 11.78 0.781
FIRM_AGE 0.00 35.00 20.66 12.324
TPE_2005_LOG_TPE_2003_LOG -3.53 3.72 0.09 0.385
TPE_2004_LOG_TPE_2003_LOG -2.98 3.17 0.04 0.336
[image:30.595.73.487.361.716.2]Table 4: Weighted least squares regression for changes in firm productivity (TPE_2005_LOG minus TPE_2003_LOG), restricted model, all firms
Coefficient SE t Sig. (Constant) 0.045 0.044 1.023 0.306
AGE 0.024 0.002 11.529 0.000
AGE_SQUARED -0.000 0.000 -12.577 0.000
FIRM_TENURE 0.005 0.001 3.369 0.001
FIRM_TENURE_SQUARED 0.000 0.000 2.843 0.004
TPE_2002_LOG -0.037 0.002 -18.030 0.000
FIRM_AGE -0.000 0.000 -2.922 0.003
ENTRY -0.049 0.012 -3.990 0.000
EXIT 0.073 0.012 6.016 0.000
SBI_16 0.106 0.032 3.287 0.001
SBI_17 -0.018 0.011 -1.692 0.091
SBI_18 -0.002 0.018 -0.104 0.917
SBI_19 -0.094 0.024 -3.940 0.000
SBI_20 -0.001 0.009 -0.107 0.915
SBI_21 0.010 0.010 0.965 0.335
SBI_22 -0.026 0.006 -4.202 0.000
SBI_23 0.144 0.038 3.820 0.000
SBI_24 0.078 0.008 9.727 0.000
SBI_25 0.046 0.008 5.445 0.000
SBI_26 0.040 0.009 4.379 0.000
SBI_27 0.152 0.014 11.240 0.000
SBI_28 0.054 0.006 9.768 0.000
SBI_29 0.037 0.006 6.137 0.000
SBI_30 -0.110 0.024 -4.505 0.000
SBI_31 0.028 0.010 2.676 0.007
SBI_32 0.012 0.016 0.775 0.438
SBI_33 -0.023 0.010 -2.354 0.019
SBI_34 0.072 0.011 6.754 0.000
SBI_35 0.131 0.011 12.254 0.000
SBI_36 -0.050 0.007 -7.160 0.000
SBI_37 0.208 0.022 9.406 0.000
R²: 0.023
30
Table 5: Weighted least squares regression for changes in firm productivity (TPE_2004_LOG minus TPE_2003_LOG), restricted model, all firms
Coefficient SE t Sig. (Constant) 0.158 0.038 4.223 0.000
AGE 0.013 0.002 7.574 0.000
AGE_SQUARED -0.000 0.000 -8.463 0.000
FIRM_TENURE 0.000 0.001 0.235 0.814
FIRM_TENURE_SQUARED 0.000 0.000 5.014 0.000
TPE_2002_LOG -0.030 0.002 -17.352 0.000
FIRM_AGE -0.001 0.000 -4.921 0.000
ENTRY -0.062 0.010 -5.926 0.000
EXIT 0.076 0.010 7.472 0.000
SBI_16 0.060 0.027 2.213 0.027
SBI_17 0.014 0.009 1.573 0.116
SBI_18 -0.038 0.015 -2.486 0.013
SBI_19 0.025 0.020 1.216 0.224
SBI_20 0.013 0.008 1.663 0.096
SBI_21 0.005 0.009 0.560 0.575
SBI_22 -0.003 0.005 -0.495 0.621
SBI_23 0.054 0.032 1.685 0.092
SBI_24 0.034 0.007 5.059 0.000
SBI_25 0.007 0.007 1.043 0.297
SBI_26 0.016 0.008 2.085 0.037
SBI_27 0.118 0.011 10.312 0.000
SBI_28 0.033 0.005 7.074 0.000
SBI_29 0.013 0.005 2.597 0.009
SBI_30 -0.028 0.021 -1.351 0.177
SBI_31 0.047 0.009 5.308 0.000
SBI_32 0.023 0.014 1.730 0.084
SBI_33 -0.037 0.008 -4.509 0.000
SBI_34 0.053 0.009 5.851 0.000
SBI_35 0.065 0.009 7.215 0.000
SBI_36 -0.023 0.006 -3.917 0.000
SBI_37 0.197 0.019 10.570 0.000
R²: 0.015
Table 6: Weighted least squares regression for changes in firm productivity (TPE_2005_LOG minus TPE_2003_LOG), restricted model, firms with entries from and exits to other firms
Coefficient SE t Sig. (Constant) -0.284 0.126 -2.247 0.025
AGE 0.042 0.007 6.254 0.000
AGE_SQUARED -0.001 0.000 -6.505 0.000
FIRM_TENURE 0.003 0.002 1.557 0.120
FIRM_TENURE_SQUARED 0.000 0.000 2.066 0.039
TPE_2002_LOG -0.032 0.003 -11.834 0.000
FIRM_AGE -0.001 0.000 -2.989 0.003
ENTRY -0.178 0.022 -7.953 0.000
EXIT 0.070 0.023 3.101 0.002
SBI_16 0.082 0.029 2.828 0.005
SBI_17 -0.015 0.015 -0.982 0.326
SBI_18 -0.046 0.036 -1.276 0.202
SBI_19 -0.246 0.044 -5.620 0.000
SBI_20 -0.035 0.015 -2.345 0.019
SBI_21 0.003 0.011 0.252 0.801
SBI_22 -0.019 0.008 -2.274 0.023
SBI_23 0.200 0.041 4.922 0.000
SBI_24 0.062 0.009 7.124 0.000
SBI_25 0.021 0.010 2.111 0.035
SBI_26 0.038 0.012 3.101 0.002
SBI_27 0.191 0.015 12.784 0.000
SBI_28 0.043 0.008 5.662 0.000
SBI_29 0.045 0.008 5.896 0.000
SBI_30 -0.119 0.027 -4.403 0.000
SBI_31 0.069 0.014 5.075 0.000
SBI_32 0.047 0.019 2.441 0.015
SBI_33 -0.036 0.013 -2.776 0.006
SBI_34 0.084 0.013 6.489 0.000
SBI_35 0.216 0.014 15.237 0.000
SBI_36 -0.080 0.010 -7.924 0.000
SBI_37 0.042 0.031 1.347 0.178
R²: 0.037
32
Table 7: Weighted least squares regression for changes in firm productivity (TPE_2004_LOG minus TPE_2003_LOG), restricted model, firms with entries from and exits to other firms
Coefficient SE t Sig. (Constant) -0.165 0.110 -1.500 0.134
AGE 0.032 0.006 5.475 0.000
AGE_SQUARED -0.000 0.000 -6.380 0.000
FIRM_TENURE 0.005 0.002 2.981 0.003
FIRM_TENURE_SQUARED 0.000 0.000 1.622 0.105
TPE_2002_LOG -0.026 0.002 -11.157 0.000
FIRM_AGE -0.001 0.000 -4.232 0.000
ENTRY -0.146 0.019 -7.466 0.000
EXIT 0.061 0.020 3.101 0.002
SBI_16 0.061 0.025 2.420 0.016
SBI_17 0.002 0.013 0.155 0.877
SBI_18 -0.018 0.031 -0.566 0.571
SBI_19 -0.011 0.038 -0.301 0.764
SBI_20 -0.016 0.013 -1.274 0.203
SBI_21 0.035 0.010 3.530 0.000
SBI_22 0.024 0.007 3.305 0.001
SBI_23 0.098 0.035 2.768 0.006
SBI_24 0.028 0.008 3.688 0.000
SBI_25 -0.008 0.009 -0.917 0.359
SBI_26 0.045 0.011 4.290 0.000
SBI_27 0.162 0.013 12.493 0.000
SBI_28 0.041 0.007 6.185 0.000
SBI_29 0.033 0.007 4.897 0.000
SBI_30 -0.011 0.024 -0.470 0.638
SBI_31 0.083 0.012 7.044 0.000
SBI_32 0.071 0.017 4.255 0.000
SBI_33 -0.067 0.011 -5.939 0.000
SBI_34 0.093 0.011 8.250 0.000
SBI_35 0.130 0.012 10.565 0.000
SBI_36 -0.042 0.009 -4.833 0.000
SBI_37 0.149 0.027 5.480 0.000
R²: 0.030
Table 8: Weighted least squares regression for changes in firm productivity (TPE_2005_LOG minus TPE_2003_LOG), full model, firms with entries from and exits to other firms
Coefficient SE t Sig. (Constant) -0.662 0.130 -5.083 0.000
AGE 0.040 0.007 6.043 0.000
AGE_SQUARED -0.001 0.000 -6.425 0.000
FIRM_TENURE 0.001 0.002 0.545 0.586
FIRM_TENURE_SQUARED 0.000 0.000 2.139 0.032
TPE_2002_LOG -0.040 0.003 -13.634 0.000
FIRM_AGE -0.000 0.000 -2.671 0.008
ENTRY -0.174 0.023 -7.662 0.000
EXIT 0.071 0.023 3.130 0.002
SBI_16 0.085 0.029 2.911 0.004
SBI_17 -0.010 0.015 -0.686 0.493
SBI_18 -0.051 0.036 -1.430 0.153
SBI_19 -0.237 0.044 -5.427 0.000
SBI_20 -0.023 0.015 -1.541 0.123
SBI_21 0.003 0.011 0.284 0.776
SBI_22 -0.013 0.008 -1.573 0.116
SBI_23 0.220 0.041 5.429 0.000
SBI_24 0.059 0.009 6.729 0.000
SBI_25 0.033 0.010 3.247 0.001
SBI_26 0.041 0.012 3.348 0.001
SBI_27 0.191 0.015 12.793 0.000
SBI_28 0.054 0.008 7.008 0.000
SBI_29 0.054 0.008 6.830 0.000
SBI_30 -0.111 0.027 -4.086 0.000
SBI_31 0.074 0.014 5.423 0.000
SBI_32 0.053 0.019 2.734 0.006
SBI_33 -0.030 0.013 -2.318 0.020
SBI_34 0.088 0.013 6.756 0.000
SBI_35 0.224 0.014 15.834 0.000
SBI_36 -0.064 0.010 -6.368 0.000
SBI_37 0.054 0.031 1.727 0.084
ENTRY_NO_JOB -0.001 0.009 -0.144 0.886
ENTRY_AVG_AGE 0.002 0.000 5.600 0.000
ENTRY_AVG_FIRM_TENURE -0.003 0.001 -3.744 0.000
ENTRY_AVG_DISTANCE -0.000 0.000 -2.016 0.044
ENTRY_SAME_SBI 0.056 0.010 5.564 0.000
ENTRY_AVG_TPE_OLDFIRM_LOG 0.027 0.003 10.165 0.000
EXIT_NO_JOB 0.057 0.010 5.938 0.000
EXIT_AVG_AGE -0.001 0.000 -2.856 0.004
EXIT_AVG_FIRM_TENURE 0.003 0.001 4.257 0.000
EXIT_AVG_DISTANCE -0.001 0.000 -3.288 0.001
EXIT_SAME_SBI -0.046 0.010 -4.463 0.000
EXIT_AVG_TPE_NEWFIRM_LOG 0.011 0.003 4.378 0.000
R²: 0.046
34
Table 9: Weighted least squares regression for changes in firm productivity (TPE_2004_LOG minus TPE_2003_LOG), full model, firms with entries from and exits to other firms
Coefficient SE t Sig. (Constant) -0.413 0.113 -3.638 0.000
AGE 0.031 0.006 5.430 0.000
AGE_SQUARED -0.000 0.000 -6.433 0.000
FIRM_TENURE 0.004 0.002 2.137 0.033
FIRM_TENURE_SQUARED 0.000 0.000 1.233 0.218
TPE_2002_LOG -0.032 0.003 -12.508 0.000
FIRM_AGE -0.001 0.000 -3.468 0.001
ENTRY -0.152 0.020 -7.682 0.000
EXIT 0.066 0.020 3.311 0.001
SBI_16 0.062 0.025 2.438 0.015
SBI_17 0.002 0.013 0.185 0.853
SBI_18 -0.021 0.031 -0.691 0.490
SBI_19 0.009 0.038 0.243 0.808
SBI_20 -0.010 0.013 -0.746 0.455
SBI_21 0.034 0.010 3.438 0.001
SBI_22 0.026 0.007 3.513 0.000
SBI_23 0.111 0.035 3.156 0.002
SBI_24 0.021 0.008 2.789 0.005
SBI_25 -0.001 0.009 -0.080 0.936
SBI_26 0.044 0.011 4.119 0.000
SBI_27 0.162 0.013 12.477 0.000
SBI_28 0.045 0.007 6.622 0.000
SBI_29 0.034 0.007 4.993 0.000
SBI_30 -0.010 0.024 -0.416 0.677
SBI_31 0.084 0.012 7.036 0.000
SBI_32 0.077 0.017 4.574 0.000
SBI_33 -0.069 0.011 -6.003 0.000
SBI_34 0.093 0.011 8.194 0.000
SBI_35 0.135 0.012 10.982 0.000
SBI_36 -0.036 0.009 -4.115 0.000
SBI_37 0.144 0.027 5.316 0.000
ENTRY_NO_JOB -0.016 0.008 -1.972 0.049
ENTRY_AVG_AGE 0.003 0.000 8.199 0.000
ENTRY_AVG_FIRM_TENURE 0.001 0.001 0.909 0.363
ENTRY_AVG_DISTANCE -0.000 0.000 -0.034 0.973
ENTRY_SAME_SBI 0.024 0.009 2.790 0.005
ENTRY_AVG_TPE_OLDFIRM_LOG 0.020 0.002 8.482 0.000
EXIT_NO_JOB 0.024 0.008 2.906 0.004
EXIT_AVG_AGE -0.002 0.000 -4.777 0.000
EXIT_AVG_FIRM_TENURE 0.003 0.001 5.277 0.000
EXIT_AVG_DISTANCE -0.000 0.000 -1.481 0.139
EXIT_SAME_SBI -0.027 0.009 -3.003 0.003
EXIT_AVG_TPE_NEWFIRM_LOG 0.004 0.002 1.745 0.081
R²: 0.038