http://dx.doi.org/10.4236/cc.2016.43008
How to cite this paper: Cao, Y.J., Liu, J.L., Liu, T., Liu, D.J. and Wu, Y.F. (2016) Theoretical Study of Continuous B-Cell Epi-topes with Developed BP Neural Network. Computational Chemistry, 4, 83-90. http://dx.doi.org/10.4236/cc.2016.43008
Theoretical Study of Continuous B-Cell
Epitopes with Developed BP Neural Network
Yajie Cao
1, Jinglin Liu
1*, Tao Liu
2,3, Dejiang Liu
4*, Yunfei Wu
1 1College of Science, Jiamusi University, Jiamusi, China2College of Science, Hebei Polytechnic University, Tangshan, China 3Department of Computer Science, University of Georgia, Georgia, USA 4College of Science, Northeast Forestry University, Harbin, China
Received 31 May 2016; accepted 23 July 2016; published 26 July 2016
Copyright © 2016 by authors and Scientific Research Publishing Inc.
This work is licensed under the Creative Commons Attribution International License (CC BY).
http://creativecommons.org/licenses/by/4.0/
Abstract
In order to identify continuous B-cell epitopes effectively and to increase the success rate of expe-rimental identification, the modified Back Propagation artificial neural network (BP neural net-work) was used to predict the continuous B-cell epitopes, and finally the predictive model for the B-cells epitopes was established. Comparing with the other predictive models, the prediction per-formance of this model is more excellent (AUC = 0.723). For the purpose of verifying the perfor-mance of the model, the prediction to the SWISS PROT NUMBER: P08677 was carried on, and the satisfying results were obtained.
Keywords
Continuous B-Cell Epitopes, BP Neural Network, Theory Method, Predictive Model
1. Introduction
Epitope, also called antigenic determinant, refers to specific structure site of antigen molecular which is recog-nized by specific effect molecules or T, B lymphocyte cells in immune response. B cell epitope is a linear seg-ment or space conformation structure in antigen molecule, which can bind to B cell receptor (BCR) [1]. B cell epitopes are composed of continuous epitopes and discontinuous epitopes [2], and only less than 10% are conti-nuous [3].
Accurate prediction of B cell epitopes is not only helpful for research on basic immunology but also is useful for development of epitope vaccine and immunotherapy of autoimmune disease [4]-[6]. It is difficult to predict
discontinuous B cell epitopes for space three-dimensional structure and structure flexibility [7], despite the fact that the discontinuous B cell epitopes are far more than the continuous ones. For now, methods to predict dis-continuous B cell epitopes are mainly structure-based and combination of sequence and structure. Therefore current prediction focuses on the continuous epitopes. In recent years, methods including machine learning me-thod are applied to improve prediction performance. In current work, the modified BP neural network was used to predict the continuous B-cell epitopes, and finally the predictive model for the B-cells epitopes was estab-lished to prediction of the SWISS PROT NUMBER: P08677, and the establishment of modified BP neural net-work provided a new method for studying some protein system.
2. Methods and Results
2.1. Mathematical Theory of the Prediction Model
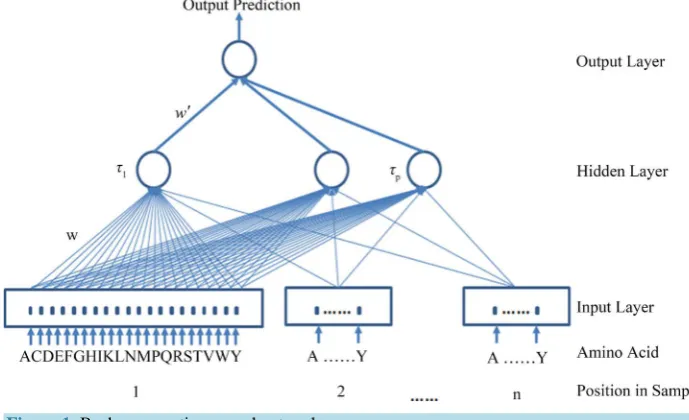
[image:2.595.136.481.502.712.2]BP neural network model, also known as “Back Propagation artificial neural network”, was used to predict B cell epitopes. The error between output response and expected output of learning signal is taken as instructor signal by the network to regulate the network connection strength. The learning process is completed through repeated regulation which achieves the minimum error. BP neural network is now the most widely used neural network, which uses the smooth activation function and has one or more hidden layers, with the neighboring layers fully connected by a weighting value. It is a feed forward neural network, which means that information under processing will move forward layer by layer. However, it learns the weight value based on the difference between the ideal output and the actual output, and then modifies the weighting value via back propagation.
Figure 1 shows the topology of BP network.
In Figure 1, w w, ′ are weight value and τp is the output of hidden layer. In this paper, the sample input vector is B cell epitope sequence which consists of amino acids. In amino acid sequence of a sample, each position possibly appears one of 20 different amino acids, so correspondingly 20 variables are introduced to denote 20 amino acids in some position of amino acid sequence [8]. For example, Ala is represented as “100000000000000 00000”, cys is represented as “01000000000000000000” and so on. This means each amino acid is equivalent to 20 neurons of the network input. The corresponding actual output is ζm, the error function is defined as:
(
)
2 2
1 1 1 1 1
1 1
,
2 2
J J M P N
j j j j
m mp pn n
j j m p n
E w w O ξ O g w g w ξ
= = = = =
′ = − = − ′
∑
∑∑
∑
∑
(1)
The determination of the weight matrix (learning process) should make the error function to achieve a mini-mum value. Usually during the learning process of BP network based on gradient descent principle, the informa-tion under processing will move forward layer by layer. While in the learning stage of network, the error back-
propagation algorithm is used to adjust the weight values layer by layer. Thus it is called Back Propagation al-gorithm [9].
2.2. The Establishment of Prediction Model
The defects of common BP neural network algorithm are described as followed:
1) The slow convergence speed. Generally using BP algorithm to solve a network with four or five components will need thousands, even tens of thousands of cycles to achieve convergence, which makes it difficult to deal with massive data.
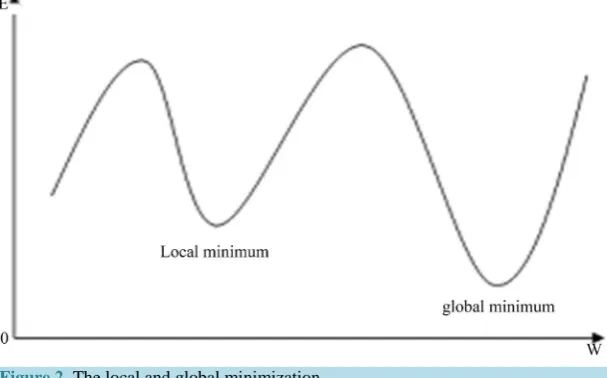
[image:3.595.162.466.527.716.2]2) The easiness to fall into local minimum. BP algorithm can not guarantee the convergence value of network weight as the global minimization of error hyperplane. It is likely to be a local minimization, as shown in
Figure 2.
3) The bad fault tolerance.
We can achieve the optimization in two respects:
a) Momentum method: Based on the back propagation method, proportional previous (t) weight change is added to every time (t + 1) weight change, which results in new weight change.
(
1)
( ) (
1)
E t( )
,(
1)
( ) (
1)
E t( )
w t w t b t b t
w b
γ γ η∂ γ γ η∂
∆ + = ∆ − − ∆ + = ∆ − −
∂ ∂ (2)
Increase of momentum makes the weight and bias value adjust towards to the mean direction of error surface bottom. When W and b access into the flat area at the bottom of error surface, the convergence speeds up, namely ∂E t
( )
∂ ∂w, E t( )
∂b will become very small. So, ∆w t(
+ = ∆1)
γ w t( )
,∆b t(
+ = ∆1)
γ b t( )
. This pre-vents ∆w t(
+ = ∆1)
0, b t(
+ =1)
0, which helps network jump out of local minima from error surface.γ represents momentum coefficient. Considering convergence speed and jitter problems, momentum coeffi-cient in this paper is 0.9.
b) Adaptive learning rate: For specific problem, an appropriate learning rate is usually set according to expe-rience or experiment. However even so, the learning rate which has good performance in early training often does not apply to the later training. Therefore, it is necessary to adjust learning rate. Variable learning rate back- propagation algorithm is described as followed: if the square error E (on the whole training set) increases after the weight is updated and is more than a percentage ζ (a typical value of 1% ~ 5%), then the weight update is canceled, learning rate is multiplied by a factor ρ (0< <
ρ
1), and momentum coefficient γ (if there is not) is set to 0. In this paperζ
=4%,ρ
=0.7. If the square error E decreases after the weight is updated, then the weight update is accepted, and learning rate is multiplied by a factor ρ (ρ
>1). If it is set to 0, then return to the previous value; if the growth of E is less than ζ, then the weight update is accepted, but learning rate re-mains same. If momentum coefficient was set to 0, then return to the previous value. Based on above three rules, they can be summarized as followed:(
)
( )
(
)
( )
( )
(
)
( )
( )
1.05 , when 1
1 0.7 , when 1 1.04
, else
t E t E t
t t E t E t
t η η η η + <
+ = + > ×
(
)
( )
(
)
( )
0, when 1 1.04
, when 1 1.04
E t E t
E t E t
η γ
+ > ×
=
+ ≤ ×
(3)
According to the rules, the range of initial learning rate η
( )
0 has great arbitrariness, but it is more prudent to use a smaller value.2.3. Setting of Model Parameters
1) Hidden layer number n = 1. By doing research on multi-hidden layers, we found that it was unnecessary to use multi-hidden layers which would make the network structure more complex and increase the computa-tion greatly.
2) The initial learning rate η = 0.01. Although the setting of initial learning rate has great arbitrariness, it is more prudent to use a smaller value.
3) Activation function parameter β = 0.01. β represents the curve smoothness of activation function. The curve is more smooth with a smaller β. It decides the convergence speed with the learning rate.
4) Weight change mode: online mode, using this mode is due to the large number of sample data. If the batch mode is used, the number of training times will be far greater with excessive jitter problems. Also online gradient method can be considered as a stochastic perturbation of gradient method, which helps to jump out of local minima.
5) Target error E = 0.5. The training will be stopped when E is less than 0.5. Research found that smaller error setting would increase the running time greatly and cause over fitting.
6) The threshold is set 5. A threshold is used to identify epitope and non-epitope. By studying all thresholds from 0 to 10 with an interval 0.1, we found that sensitivity was almost equal to specificity when threshold was set 5.
7) Momentum factor α = 0.9. This value is set by synthetically considering convergence speed and jitter prob-lems. When this value is less than 0.9, the convergence speed will be slow. When this value is greater than 0.9, the jitter problems will be excessive. It is related to the way how the network is prepared. When differ-ent coding is used, differdiffer-ent momdiffer-entum factor will be set based on the two factors.
2.4. Extraction and Preprocessing on Sample Data
Due to the shortage of sample data with only 700 positive samples and 700 negative samples in mostly database, the predictive result is not particularly good. In this paper, we mixed two data sets from Bcpreds [10] and ABCPred [11], and each data set consists of 700 positive samples and 700 negative samples. By eliminating duplicate epitope, finally we got 2400 sample data for training. At the same time, the window length was 10, 12, 14, 16, 18 and 20 respectively. The best sample length was selected after comparing the predictive results.
2.5. Evaluation Indexes of Predictive Performance of the Model
The performance of the model is evaluated by using the parameters: sensitivity (SE), specificity (SP), positive prediction value (PV), negative prediction value (NV), accuracy (AC) and Matthews coefficient of correlation (CC):
(
)(
)(
)(
)
TP TN
SE 100% SP 100%
TP FN TN FP
TP TN
PV 100% NV 100%
TP FP TN FN
TP TN
AC 100%
TP FP TN FN
TP TN FN FP CC
TN FN FN TP TP FP FP TN
= × = × + + = × = × + + + = × + + + × − × = + + + + (4)
number of predicted true negatives and FN is the number of predicted false negatives. A threshold (Th) is cho-sen to be compared with peptide’s predicted value. If predicted value is more than threshold, the peptide is con-sidered as B cell epitope; otherwise, it is not concon-sidered as B cell epitope.
The performance of the prediction method is measured by ROC curves. An ROC curve is generated by com-puting SE and SP corresponding to all thresholds and taking (1-SP) as the X axis, taking SE as the Y axis. The area under ROC [12] curve (AUC) is a measure of prediction algorithm performance and has nothing to do with the threshold. Generally AUC = 0.5 indicates random prediction, AUC = 1 shows that all test data are predicted correctly, AUC > 0.7 is considered as significant prediction.
3. Results and Discussion
Figure 3 shows how the learning rate varies with the training step. It can be seen from Figure 3 that learning rate always adjusts self-adaptively. After reaching a peak value, it is quickly reduced to a very small value, and then increases. In the learning process, the peak value of learning rate in the beginning is much small, and then gradually increases with a nonlinear trend. This also shows the following advantages of using adaptive learning rate comparing with traditional BP network: small learning rate in the beginning can avoid the network concus-sion and ensure access to an accurate attraction domain; then greater learning rate can decrease learning time greatly and quicken the convergence process of network, while traditional BP network is difficult to do both.
As is shown in Figure 4, SE and SP equal curve describes random prediction with lack of correlation. The upper curve corresponds to the positive correlation of epitope position and prediction [12]. It can be seen from
Figure 4 that our predictive results have good positive correlation. At the same time it also shows the perfor-mance of our model is significant, which can be used to predict epitopes.
By applying modified BP neural network method to predict samples with different length, we got predictive results as shown in Table 1. From the boldfaced lines in Table 1, the best length for B cell epitope is 18 amino acids. The B cell epitopes got from experiment mostly consist of 18 amino acids.
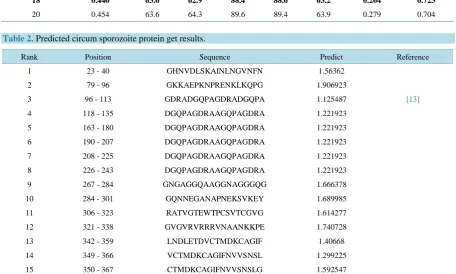
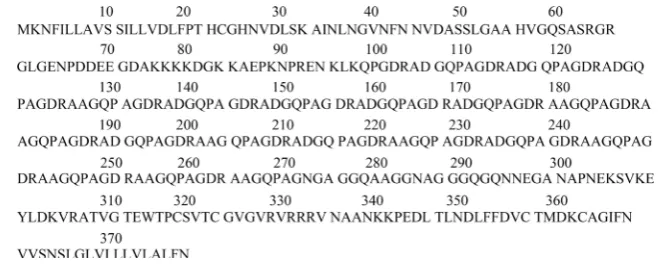
Circumsporozoite protein (SWISS PROT NUMBER: P08677) consists of 378 amino acids. Figure 5 shows the amino acid sequence of circumsporozoite protein. Circumsporozoite protein is surface antigen with immune- optimility on spore. On the infectious stage of malaria parasites, it is transmitted to the vertebrate by mosquito. The prediction model is applied to predict this antigen and only predict epitopes with a length of 18. Table 2
lists just a small part of the predicted results. The predictive value of a sequence, in the Table 2, indicates the possibility or degree elonging to positive or negative class. For example, if the predictive value is more larger than zero, the sequence gets more possibility belonging to positive class, otherwise more possibility of negative class. Our results include all experimental results given by the literature, which also shows the superiority of our model.
Figure 4. The curves of ROC.
Table 1. Improved neural network B cell epitope-based different length of data table.
Length PIC50 SE SP PV NV AC CC AUC
10 0.482 60.0 60.7 84.6 84.4 60.4 0.207 0.637
12 0.462 58.6 59.3 82.6 82.4 58.9 0.179 0.656
14 0.474 64.3 65.0 90.6 90.4 64.6 0.293 0.672
16 0.477 65.0 65.7 91.7 91.3 65.4 0.307 0.695
18 0.446 63.6 62.9 88.4 88.6 63.2 0.264 0.723
[image:6.595.84.541.443.717.2]20 0.454 63.6 64.3 89.6 89.4 63.9 0.279 0.704
Table 2. Predicted circum sporozoite protein get results.
Rank Position Sequence Predict Reference
1 23 - 40 GHNVDLSKAINLNGVNFN 1.56362
2 79 - 96 GKKAEPKNPRENKLKQPG 1.906923
3 96 - 113 GDRADGQPAGDRADGQPA 1.125487 [13]
4 118 - 135 DGQPAGDRAAGQPAGDRA 1.221923
5 163 - 180 DGQPAGDRAAGQPAGDRA 1.221923
6 190 - 207 DGQPAGDRAAGQPAGDRA 1.221923
7 208 - 225 DGQPAGDRAAGQPAGDRA 1.221923
8 226 - 243 DGQPAGDRAAGQPAGDRA 1.221923
9 267 - 284 GNGAGGQAAGGNAGGGQG 1.666378
10 284 - 301 GQNNEGANAPNEKSVKEY 1.689985
11 306 - 323 RATVGTEWTPCSVTCGVG 1.614277
12 321 - 338 GVGVRVRRRVNAANKKPE 1.740728
13 342 - 359 LNDLETDVCTMDKCAGIF 1.40668
14 349 - 366 VCTMDKCAGIFNVVSNSL 1.299225
Figure 5. The sequence of the circum sporozoite protein.
4. Conclusion
By modifying the oldneural network based on additional momentum method and adaptive learning rate, we es-timated the neural network prediction model for identifying continuous B cell epitopes correctly. The simulation shows that for the boldfaced lines, the best length for B cell epitope is 18 amino acids among predicted samples, and sensitivity (SE) and specificity (SP) equal curve describe a good positive correlation. Noted that using ar-tificial neural network to predict B cell epitopes is based on a large number of experimental data, and our results were in well agreement with experimental data. Therefore, modified artificial neural network method can pro-vided exact identification of B-cells epitopes and give effective prediction for protein system.
Acknowledgements
This work was supported by Research Project of Education Department of Heilongjiang Province (Grant No.: 12543077) and the science and technology research projects of Jiamusi university (L2011-022).
References
[1] Lyczak, G.P. and Wetzler, L. (2004) Immunology, Infection, and Immunity. ASM Press.
http://dx.doi.org/10.1128/9781555816148
[2] Chen, J., Liu, H., Yang, J. and Chou, K.-C. (2007) Prediction of Linear B-Cell Epitopes Using Amino Acid Pair Anti-genicity Scale. Amino Acide, 33, 423-428. http://dx.doi.org/10.1007/s00726-006-0485-9
[3] Pellequer, J., Westhof, E. and van Regenmortel, M. (1991) Prediction Location of Continuous Epitopes in Proteins from Their Primary Structures. Methods in Enzymology, 203, 176-201.
http://dx.doi.org/10.1016/0076-6879(91)03010-E
[4] Kasmi, E. and Muller, C.P. (2001) New Strategies for Closing the Gap of Measles Susceptibility in Infants: Towards Vaccines Compatible with Current Vaccination Schedules. Vaccine, 19, 2238-2244.
http://dx.doi.org/10.1016/S0264-410X(00)00452-7
[5] Sabhanini, L., Manocha, M., Sridevi, K., Shashikiran, D., Rayanade, R. and Rao, D.N. (2003) Developing Subunit Immunogens Using B and T Cell Epitopes and Their Constructs Derived from FI Antigen of Yersinia pestis Using Novel Delivery Vehicles. FEMS Immunology and Medical Microbiology, 1579, 1-15.
[6] Kieber-Emmons, T., Luo, P., Qiu, J., Chang, T.Y., Insung, O., Blaszczyk-Thurin, M. and Steplewski, Z. (1991) Vacci-nation with Carbohydrate Peptide Mimotopes Promotes Anti-Tumor Responses. Nature Biotechnology, 17, 660-665.
http://dx.doi.org/10.1038/10870
[7] Andersen, P.H., Nielsen, M. and Lund, O. (2006) Prediction of Residues in Discontinuous B-Cell Epitopes Using Pro-tein 3D Structures. Protein Science, 15, 2558-2567. http://dx.doi.org/10.1110/ps.062405906
[8] Lund, O., Nielsen, M. and Lundegaard, C. (2005) Immunological Bioinformatics. A Bradford Book. The MIT Press, Cambridge, London.
[9] Parker, D.B. (1985) Learning-Logic: Casting the Cortex of the Human Brain in Silicon. Technical Report Tr-47, Cen-ter for Computational Research in Economics and Management Science. MIT Cambridge, MA.
[10] Sudipto, S., Manoj, B. and Raghava, G.P.S. (2005) Bcipep: A Database of B-Cell Epitopes. BMC Genomics, 6, 79.
http://dx.doi.org/10.1186/1471-2164-6-79
387-394.
[12] Fawcett, T. (2006) An Introduction to ROC Analysis. Pattern Recognition Letters, 27, 861-874.
http://dx.doi.org/10.1016/j.patrec.2005.10.010
[13] Arcoss-Burgos, M., Valenzuela, C.Y., Herrera, P.J. and Pandey, J.P. (1997) Gm and Km Allotypes in a Chilean Urban Population Sample. Revista Médica de Chile, 125, 161-164.