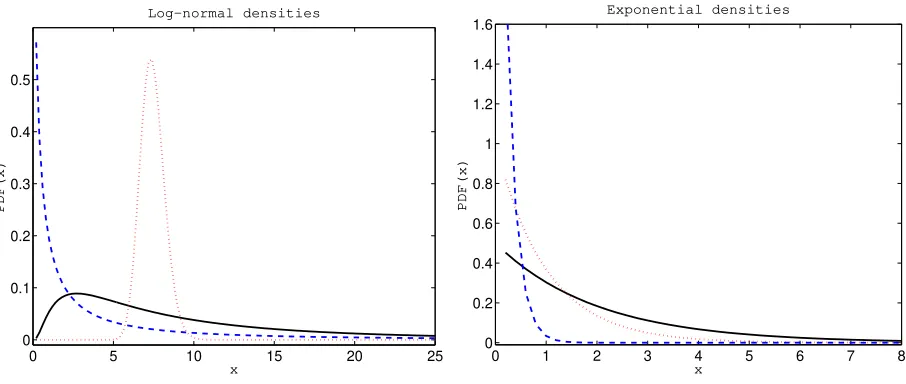
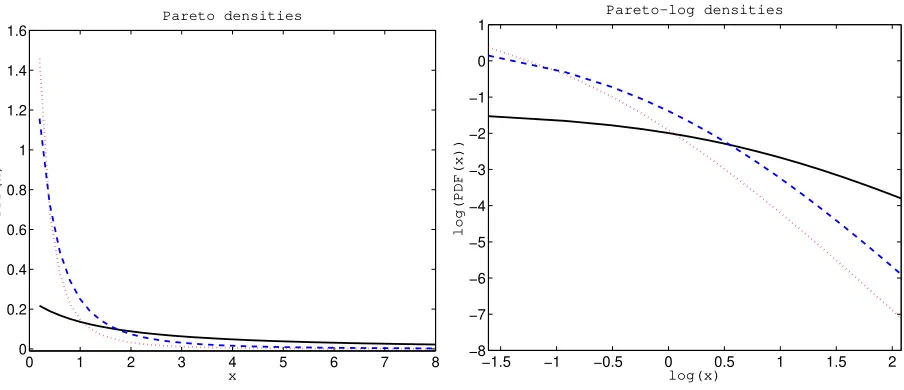
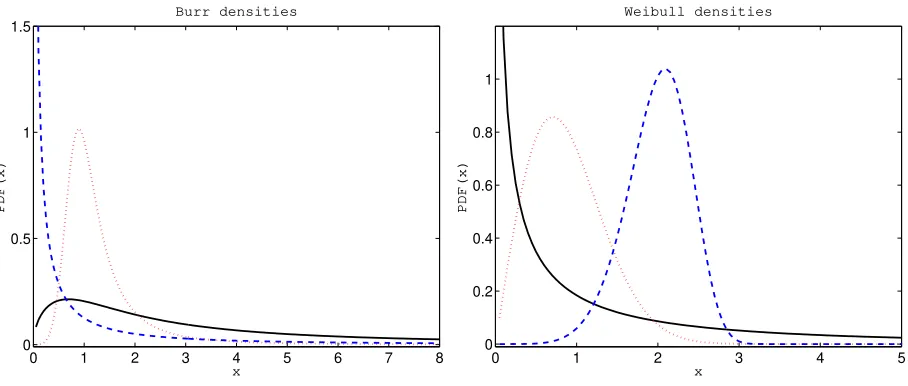
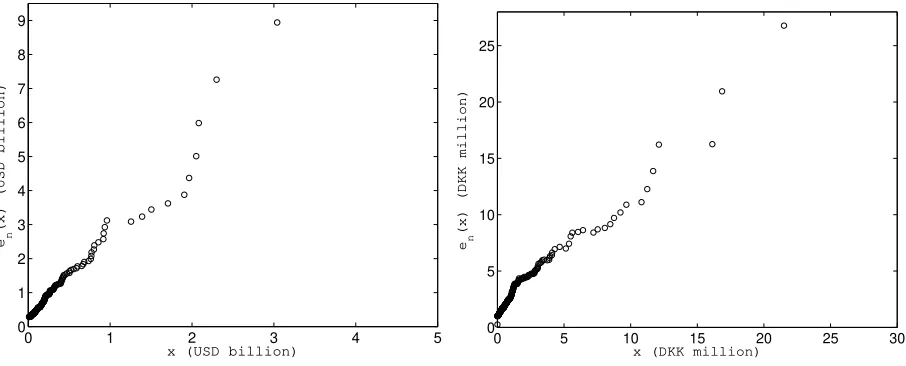
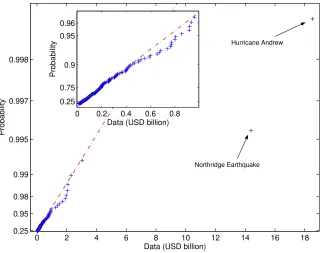
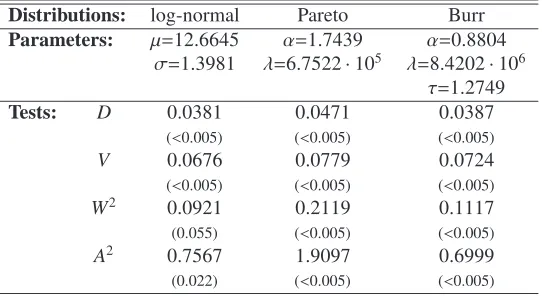
Loss Distributions
Full text
Figure


Related documents
Figure 6: Distributions of edges from three different categories, intra red, intra blue, and inter, in the given observation and learned within-time graphs for JCM ( δ = 0. 5 ). In
Similarly, for very low levels of creditor rights, the increase in managerial incentives by decentralizing the borrowing for subsidiary F is negligible as opposed to the reduction
Doctoral student Roxana Gonzalez (social psychology) engaged in scientific misconduct in research supported by National Institute of Mental Health (NIMH) and National Institutes
So, at first, we make references to the key points and the issues which are raised by teaching and learning specific vocabulary: learners usually select the
In this paper, we propose a novel adaptive online version of HDP-HMM suited for on-the-fly time segmentation and recog- nition of streaming data. The main contributions of this
The results of hedonic test showed that average value of panellist’s favourite level on the overall attribute of high antioxidant cake ranging from 4.44 to 5.26 (usual).. The
Generalized estimation equation analysis (adjusted for seizure frequency) revealed a signi fi cant group × time interaction ( p = .033) with an effect size of d ppc2 = .236,
It interrogates what value municipal services, framed in the language and form of welfare but within a commodification milieu and in the context of shifting
