Munich Personal RePEc Archive
An Empirical Analysis of Determinants
of Recent Federal Personal Income Tax
Evasion in the U.S.
Cebula, Richard
Jacksonville University
1 February 2010
Online at
https://mpra.ub.uni-muenchen.de/53205/
1
Richard J. Cebula
Walker/Wells Fargo Endowed Professor in Finance, Jacksonville University, Jacksonville, Florida—USA; E-mail: rcebula@ju.edu; tel.: +01 9126562997
An Empirical Analysis of Determinant of Recent Federal
Personal Income Tax Evasion in the U.S.
Abstract -- Unaccounted for currency in the U.S. has been argued to reflect the presence of widespread income tax evasion. In turn, income tax evasion is especially problematic in this era of large government budget deficits and growing national debts which have led to debt crises. This empirical study seeks to identify determinants of recent federal personal income tax evasion in the U.S. using the most recent tax evasion data available, data that run through 2008 and are derived from the General Currency Ratio Model and measured in the form of the ratio of unreported AGI (adjusted gross income) to reported AGI. The empirical estimates find that personal income tax evasion is an increasing function of the maximum marginal federal personal income tax rate, the interest rate yield on three year Treasury notes, per capita real income, and a dummy variable for the years in which the second war in Iraq was conducted, while being a decreasing function of the Tax Reform Act of 1986, the ratio of the tax free interest rate yield on high grade municipals to the taxable interest rate yield on ten year Treasury notes, the audit rate by IRS (Internal Revenue Service) personnel, and the average IRS penalty on detected unreported income. Thus, among other things, this study finds that more aggressive IRS policies are effective tools in the war against personal income tax evasion.
Keywords -- Income tax evasion; income tax rates; audit rates; tax evasion penalties
J.E.L. classification code -- G18, G28, H26
1
. --
Introduction
U.S. households and firms admit to holding only about 15% of the total known stock of U.S. currency outside the banking system. It is suspected that much of this disparity between the actual size of the stock of currency in the U.S. and the accounted for (admitted to) holdings of U.S. currency is attributable to its usage in transactions that are not reported to the IRS, the Internal Revenue Service [Feige, 2009], the IRS. In other words, unaccounted for currency in the U.S. is argued to reflect the presence of widespread income tax evasion. In this era of widespread large government budget deficits and growing national debts, such tax evasion is especially problematic for government policymakers seeking to avert debt crises.
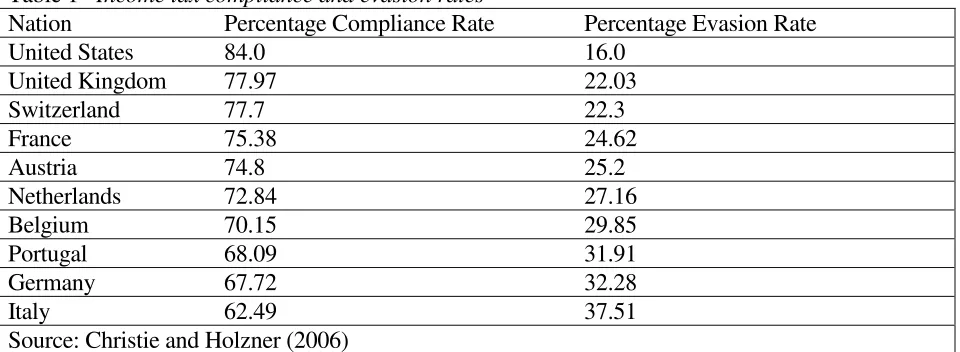
shown in Table 1, the percentage degree of income tax compliance among major Western economies ranges from an estimated low of 62.49% for Italy to an estimated high of 84% for the U.S. Of course, the estimated percentage degree of income tax evasion therefore ranges widely: 39.51% in Italy to 16% in the U.S. Thus, in this age of financially jeopardized national governments (such as Greece, most obviously, as well as Ireland, Spain, Portugal, and other nations but even including--at some level--the U.K. and U.S., the latter of which whose debt credit ratings have been lowered), income tax evasion may have risen as a greater national and international economic problem than it has at any time since the Great Depression. This is all the more the case in view of the fact that so many nations are raising income taxes or planning to do so. In this category is Greece (which has also committed to cracking down on tax evaders) as well as the U.S. and U.K.
Income tax evasion effectively consists of taxable income that is either unreported or underreported to the IRS; it also can consist of spurious or inflated tax deductions or exemptions. Studies of income tax evasion behavior essentially fall into three categories. First, there are the principally theoretical models of tax evasion behavior, such as Allingham -- Sandmo [1972], Falkinger [1988], Klepper -- Nagin -- Spurr [1991], Das-Gupta [1994], Pestieau – Possen -- Slutsky [1994], and Caballe -- Panades [1997]. Second, there are a number of studies that either (a) use questionnaires or (b) undertake experiments, such as Spicer -- Lundstedt [1976], Spicer -- Thomas [1982], Baldry [1987], Alm – Jackson -- McGee [1992], Thurman [1991], and Alm – McClelland -- Schulze [1999]. These studies are of course empirical in nature, deriving the data largely [if not entirely] from the experiments. Certain of these studies indicate an aversion to the prospect of being audited while others reveal a lack of such risk-averse behavior; still others imply that taxpayers may be averse to tax evasion on moral grounds. Additionally, the incentive to try to evade taxation by underreporting income provided by higher marginal income tax rates is also revealed in a number of these studies. Third, there are those studies that largely or in some cases exclusively adopt what
is referred to as "official data,” i.e., data obtained from the IRS (Internal Revenue Service) or its counterpart outside of the U.S. and/or some other “official,” i.e., government source. Among the types of information thusly obtained and analyzed are data on income tax evasion, income tax rates, and audit rates. Such studies endeavor typically either to estimate the aggregate degree of tax evasion or to identify the determinants thereof [Tanzi, 1983; Clotfelter, 1983; Carson, 1984; Long -- Gwartney, 1987; Pyle, 1989; Feinstein, 1991; Erard ---- Feinstein, 1994; Feige, 1989, 1994, 1996; Cebula, 2001, 2004; Ali – Cecil -- Knoblett, 2001; Ledbetter, 2004; Alm -- Yunus, 2009; Cebula -- Coombs, 2009].
In this literature, it is widely believed that the degree of federal personal income tax evasion in the economy as a whole is positively affected by higher income tax rates [Tanzi, 1982; Clotfelter, 1983; Feige, 1994]. Interestingly, Yaniv [1994] characterizes Clotfelter [1983] as “the most
relevant study” with respect to the impact of income tax rates on tax evasion, whereas Cox [1984] questions his findings. In any event, this perspective is simple: the higher the income tax rate, the greater the benefit (in terms of a reduced tax liability) from not reporting taxable income, ceteris paribus. It is also widely accepted that the greater the risk associated with underreporting or not reporting taxable income, the less the degree to which economic agents will choose either to not report or to underreport their taxable income [Friedland, 1982; Spicer – Thomas, 1985; De Juan, 1989; Errard – Feinstein, 1994].
3
1970 through the year 2008. In general, earlier studies of aggregate federal personal income tax evasion determinants in the U.S. do not go beyond the year 1997. Thus, by investigating tax evasion through 2008, the study period is more current than the existing published literature. Moreover, unlike previous studies of tax evasion in the U.S., this study also introduces a measure of the opportunity cost of tax compliance. The model is presented in Section 2. Naturally, a variety of potential income-tax-evasion influencing factors are included in the model. Section 3 provides the initial formal empirical analysis, whereas Section 4 provides an extension of the basic model and additional empirical estimates. A summary along with overview observations are found in the conclusion (Section 5).
2
.
The Model
In this study, the relative probability that the representative economic agent will not report his/her taxable income to the IRS is treated as an increasing function of the expected gross benefits to the agent of not reporting income, eb, and as a decreasing function of the expected gross costs to the agent of not reporting income, ec. Thus, the ratio of the probability of not reporting income to the IRS, pnr, to the probability of reporting income to the IRS, (1-pnr), is described for the representative economic agent by:
pnr/(1-pnr] = f(eb, ec), feb > 0, fec < 0 [1]
Expressing probabilities in relative terms such as shown in equation [1] possesses the virtue that it thereby reflects the form of the tax evasion data, i.e., data where [as described below in Section 3] the aggregate degree of federal personal income tax evasion is expressed in such relative terms.
As already observed, the gross expected benefits from not reporting income to the IRS are hypothesized to be an increasing function of the federal personal income tax rate [Tanzi, 1982; Clotfelter, 1983; Feige, 1994]. To reflect the federal personal income tax rate, this study adopts the maximum marginal federal personal income tax rate (MAXT). This measure of the income tax rate is adopted because it can be argued that it not only is an actual income tax rate but also to some degree reflects the extent to which income tax rates are progressive. Accordingly, it is hypothesized,
ceteris paribus, that:
eb = j(MAXT), jMAXT> 0 [2]
The Tax Reform Act of 1986 (TRA) may have been perceived by at least some portion of the general public as an honest, good faith effort to reform, i.e., to simplify and increase the equity of the Internal Revenue Code. As Musgrave observed [1987, p. 59], “The Tax Reform Act of 1986
itemized deduction.” Musgrave [1987, p. 59] further observes that prior to the TRA, a slow erosion of the income tax base had been occurring. Musgrave [1987, p. 57] was particularly dismayed by the widening of tax loopholes and the emergence of high income tax shelters that had “…gained
momentum in recent years and undermined the public’s faith in the income tax. “
Musgrave [1987, p. 59] also expressed concern that the “…compounding of the investment tax credit and accelerated depreciation diluted and distorted the base of the corporate income tax.” Musgrave [1987, p. 59] asserted that the TRA“…reversed these trends, a major accomplishment
that all reformers will welcome.” As Barth [1991, pp. 45, 124] observes, among other things, under the TRA the 10 percent investment tax credit for the purchase of equipment was repealed, and the life of the investment was increased for depreciation purposes. Based on Musgrave’s [1987] arguments, as well as findings for an earlier study period in Cebula – Coombs -- Yang [2009], then, it is expected in the present study that taxpayers might well have favorably regarded the TRA and been less resentful of the Internal Revenue Code than before, at least initially. Thus, it is hypothesized here that at the time the TRA was being enacted and becoming effective, 1986-1987, and also received the greatest publicity, reduced taxpayer resentment of the federal income tax system/Internal Revenue Code would/could, at least temporarily, have resulted in a reduced degree of aggregate personal income tax evasion, ceteris paribus. The reason this reaction to the TRA
might be only temporary is also revealed in the study by Cebula –Coombs -- Yang [2009], who argue that it would likely take at least some time for taxpayers to adequately understand and make adjustments to the newly revised Internal Revenue Code. Consequently, it is hypothesized here that, for the period when the TRA was initially implemented, 1986, through the year the TRA became “de facto fully effective,” 1987 [Barth, 1991; Barth -- Brumbaugh, 1992], the eb was reduced. Accordingly, [2] above is replaced by [3]:
eb= j(MAXT, TRA), jMAXT > 0, jTRA <0 [3]
Next, following Cebula [2004], it can be argued that the greater the ratio of tax free
interest rate yields on high grade municipals relative to taxable interest rate yields such as that on federally taxable ten-year U.S. Treasury notes, TFTEN, the greater the benefits of tax avoidance,
which is legal, and hence the less the expected benefits of tax evasion, which of course is illegal. Thus, [3] is replaced by [4] as follows:
eb= j(MAXT, TRA, TFTEN), jMAXT > 0, jTRA <0, jTFTEN < 0 [4]
Next, the higher the interest rate yield on bonds in the marketplace, the greater the
opportunity cost of tax compliance. Alternatively stated, the higher the interest rate yield on say, 3-year Treasury notes (THREE), the greater the benefits that could be derived from investing funds not reported to the IRS Hence, eb is hypothesized to be an increasing function of THREE, so that:
eb= j(MAXT, TRA, TFTEN, THREE), jMAXT > 0, jTRA <0, jTFTEN < 0, jTHREE > 0 [5]
5
Following Feige [1994] and others, it can be argued that the greater the public’s
dissatisfaction with government (DIS), the greater the secondary gain from not reporting or from under-reporting taxable income, ceteris paribus. The variable DIS is the so-called public
dissatisfaction with government index, based on survey questions from the University of Michigan Institute for Social Research [2009]. This variable measures: (a) the degree to which the public distrusts public officials (other than the U.S. President) to fulfill their job obligations; (b) the degree to which the public regards government officials as dishonest; and (c) the degree to which the public believes that government officials waste tax dollars. The value of the index ranges from -1.5 to + 1.5, with a higher index value signifying a greater degree of dissatisfaction with government. With the expected benefits (“secondary gain”) from tax evasion being an increasing function of DIS, equation [5] now is transformed into:
eb= j(MAXT, TRA, TFTEN, THREE, DIS), jMAXT > 0, jTRA <0, jTFTEN < 0, jTHREE > 0, jDIS> 0 [6]
Furthermore, a number of studies of income tax evasion have either concluded or at least implied that empirical studies of aggregate income tax evasion should include one or more control variables to reflect the potential impact of unpopular public policies on income tax evasion [Musgrave, 1987; Feinstein, 1991; Feige, 1994; Cebula, 2004; Saltz, 2001]. Stated somewhat differently, the expected benefits of personal income tax evasion can sometimes be found to reflect
the public’s response to certain government policies that are negatively perceived. For example, when the U.S. is engaged in a war [military conflict], especially an unpopular war, some portion of the public may express its disapproval in part by increasing the degree of its personal income tax evasion [Cook -- Issa, 2007]. In point of fact, earlier studies [Feige, 1994; Cebula, 2001; Saltz, 2001] have found that the U.S. public increased its aggregate degree of personal income tax evasion in response to the involvement in the Vietnam War, which was a very unpopular and controversial war. Similarly, the U.S. War in Iraq (“Operation Iraqi Freedom,” also known as the “Second Gulf War”), which began in March of 2003 has been found to be an unpopular war [Cook -- Issa, 2007].
Accordingly, it is hypothesized that the expected benefits of personal income tax evasion would be higher during the period beginning with 2003. To reflect this war, a binary (dummy) variable,
GULFWAR2, is introduced, assuming a value of 1 for the years of U.S. involvement in the Iraq War. It is expected that this “control variable” will reflect an increased expected benefit, albeit a secondary gain, from personal income tax evasion and hence increased tax evasion for the years of the Iraq War that fall within our study period, ceteris paribus. By contrast, over the period of this study, an earlier de facto war in Iraq, occurring in 1991, one which was brief, multi-national, and relatively very low in terms of U.S. casualties and pecuniary costs. This war was found not to be unpopular among most of the U.S. populace [Cook -- Issa, 2007] and hence is ignored here. In other words, it is hypothesized here that little to no tax evasion reaction to this earlier war with Iraq should be expected. To reflect the effects of the second Gulf War, then, equation [6] becomes:
eb= j(MAXT, TRA, TFTEN, THREE, DIS, GULFWAR2), jMAXT > 0, jTRA <0, jTFTEN < 0, jTHREE > 0,
jDIS> 0, jGULFWAR2 > 0 [7]
Feinstein, 1994; Caballe -- Panades, 1997]. In this study, two variables reflect these risks/costs. First, to the representative economic agent, the expected risks/costs from not reporting or from underreporting taxable income to the IRS are hypothesized to be increased by an increase in
AUDIT, the percentage of filed federal personal income tax returns that is formally audited by IRS examiners/personnel, ceteris paribus. Indeed, the experience of an IRS tax audit could imply non-pecuniary ("psychic") costs as well as non-pecuniary costs (including outlays for legal or other representation, along with the value of one's own time) above and beyond any potential added taxes, penalties, and interest assessed by the IRS. Second, IRS penalty assessments on detected unreported income are also adopted as a measure of the risks/costs associated with tax evasion. In particular, the greater the average penalty assessed by the IRS per audited tax return (PEN), the greater the expected costs of tax evasion. Thus, we have:
ec = h(AUDIT, PEN), hAUDIT > 0, hPEN > 0 [8]
Substituting from [7] and [8] into [1] yields:
pnr/(1-pnr) = f(MAXT, TRA,TFTEN,THREE, DIS, GULFWAR2,AUDIT, PEN),
fMAXT > 0, fjTRA <0, fjDIS > 0, fjTFTEN <0, fTHREE >0, fGULFWAR2 > 0, fAUDIT < 0, fPEN< 0 [9]
Let AGI represent the actual total value of the aggregate federal adjusted gross income in the economy, i.e., AGI=UAGI+RAGI, where UAGI is the dollar size of the unreported aggregate federal adjusted gross income in the economy, and RAGI is the dollar size of the reported aggregate federal adjusted gross income in the economy. It reasonably follows overall that:
UAGI = (pnr)*AGI [10]
and
RAGI = (1-pnr)*AGI [11]
It then follows that:
UAGI/RAGI = (pnr)*AGI/(1-pnr)*AGI = (pnr)/(1-pnr) [12]
Substitution from [9] and [12] into [1] yields:
UAGI/RAGI = f(MAXT, TRA,TFTEN,THREE, DIS, GULFWAR2, AUDIT, PEN),
fMAXT > 0, fjTRA <0, fjDIS > 0, fjTFTEN <0, fTHREE >0, fjGULFWAR2 > 0, fAUDIT < 0, fPEN< 0 [13]
3
. -- Initial Empirical Results
7
(UAGI/RAGI)t= f(MAXTt-1,TRAt, TFTENt-1,THREEt-1,, DISt-1, GULFWAR2t,
AUDITt-1, PENt-1, AR(1)) [14]
where:
(UAGI/RAGI)t = the ratio of the aggregate unreported federal adjusted gross income in year t to the aggregate reported federal adjusted gross income in year t, expressed as a percent;
MAXTt-1= the maximum marginal federal personal income tax rate in year t-1, expressed as a percent;
TRAt= a binary (dummy) variable for the years 1986 and 1987: TRAt=1 for the years 1986, 1987 and TRAt =0 otherwise;
TFTENt-1 = the ratio of the average interest rate yield on high grade tax free municipal bonds in year
t-1 to the average interest rate yield on 10-year Treasury notes in year t-1, expressed as a decimal;
THREEt-1 = the average annual interest rate yield on 3-year Treasury notes in year t-1, expressed as a percentage;
DISt-1 = the mean value of the public dissatisfaction with government index, year t-1, with values lying between -1.5 and + 1.5;
GULFWAR2t = a binary (dummy) variable for the years beginning with 2003: GULFWAR2t= 1 for
2003,…,2008, the last year of our tax evasion data, and GULFWAR2t = 0 otherwise;
AUDITt-1= the percentage of filed federal personal income tax returns in year t-1 that was subjected to a formal IRS audit involving IRS examiners;
PENt-1= the average penalty assessed by the IRS per audited tax return in year t-1, expressed as a percent of the AGI; and
AR(1) = autoregressive term.
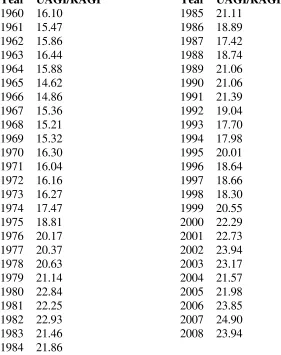
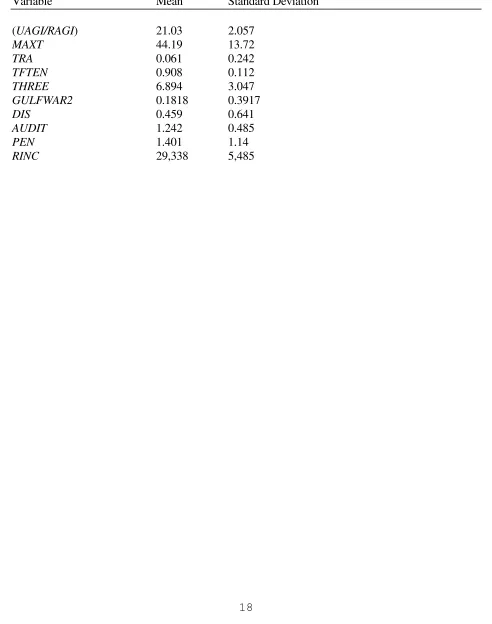
The data are annual. The study period runs from 1970 through 2008, reflecting availability of the penalty data used in the analysis.1 The tax evasion data are provided in Table 2. For the interested reader, descriptive statistics for the study period for each of the variables are found in Table 3.
1 The data for MAXT and PEN were obtained from the Internal Revenue Service [2010, Table 6].
Unfortunately, dependable data for the PEN variable are available only from 1970 and the years thereafter; hence, the study period begins with 1970. The AUDIT data were obtained from the Government Accounting Office [1996, Table I.1] and the U.S. Census Bureau [1994, Table 519; 1998, Table 550; 1999, Table 556; 2001, Table 546; 2010, Table 469]. The TRA variable is a binary (dummy) variable; the Tax Reform Act of 1986 was actually signed into law by President Reagan in 1986. The GULFWAR2 variable is also a binary variable. The data for the variables TFTEN and
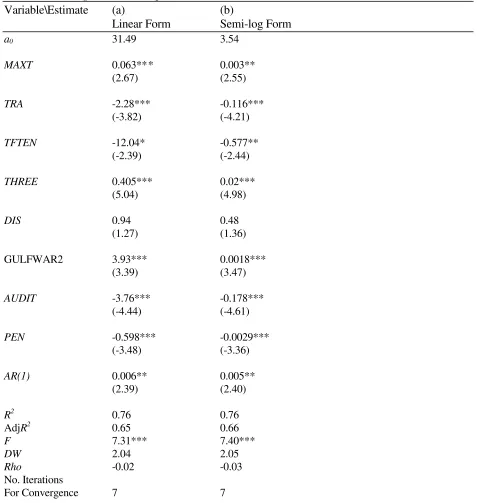
The autoregressive least squares estimation of equation [14] in linear form is provided in column (a) of Table 4.2 In this estimate, all eight of the estimated coefficients exhibit the expected signs. Furthermore, six of these estimated coefficients are statistically significant at the 1% level and one is statistically significant at the 5% level. The coefficient of determination is 0.76, so that the model explains approximately three-fourths of the variation in the independent variable. Based on the DW and Rho statistics, there is no concern regarding autocorrelation. Finally, the F-statistic is statistically significant at the 1% level, attesting to the overall strength of the model.
According to the results provided in Table 4, column (a), the coefficient on the maximum marginal federal personal income tax variable (MAXT) is positive and statistically significant at the 1% level. Thus, as expected, the higher the maximum marginal federal personal income tax rate, the greater the expected benefits of tax evasion and hence the greater the extent of that income tax evasion. This finding is consistent with most previous studies of income tax evasion using official data [Ali Cecil Knoblett, 2001; Cebula, 2001, 2004; Clotfelter, 1983; Feige, 1994; Klepper --Nagin -- Spurr, 1991; Tanzi, 1982].
Consistent with the arguments in Musgrave [1987] and findings in Cebula – Coombs -- Yang [2009], the results for TRA variable are compelling. In particular, the estimated coefficient is negative and statistically significant at the 1% level. Thus, there is evidence that the Tax Reform Act of 1986 is shown to have reduced federal personal income tax evasion in the U.S., albeit only briefly. Given the specification of TRA as applying to the short-term period of just 1986 and 1987, these results would seem to confirm the prior findings by Cebula -- Coombs -- Yang [2009], who argue that it would take at least some time for taxpayers to understand the revisions in the Internal Revenue Code and to adjust to those revisions.
The estimated coefficient on the tax free/taxable interest rate variable, TFTEN, is negative, as expected, and statistically significant at the 3% level, providing evidence that the greater the rewards for legal tax avoidance (as measured here), the less the degree of illegal tax evasion [Cebula, 2004].
The estimated coefficient on the variable THREE is positive and statistically significant at the 1% level. Thus, it appears that the greater the opportunity cost of personal income tax compliance, as measured here by a higher taxable interest rate (in this case, the annual federally taxable interest rate yield on 3-year Treasury notes), the greater the degree of income tax evasion. Such a finding is effectively unique in studies of aggregate income tax evasion in the U.S.3
The estimated coefficient on the DIS variable is positive but fails to be statistically significant at the 10% level, so that this variable does not appear to influence personal income tax evasion in the U.S. This result in this estimate runs contrary to our expectations [Feige, 1994; Cebula, 2001]. The estimated coefficient on the GULFWAR2 dummy variable is positive and statistically significant at the 1% level, a result entirely consistent with the hypothesis [Cook -- Issa, 2007] that an unpopular policy such as the second war in Iraq would tend to increase taxpayers’ resentment of federal government policy and create a secondary gain that would raise the proclivity to underreport taxable income to the IRS [Musgrave, 1987; Feinstein, 1991; Feige, 1994; Cebula, 2001; Saltz, 2001].
2 Autoregressive estimates are undertaken in this study in order to address autocorrelation. In
addition, the Newey-West [1987] correction for heteroskedasticity is adopted in all of the estimates.
9
On the cost/risk side of tax evasion, the estimated coefficient on the AUDIT variable is negative and statistically significant at beyond the 1% level. Thus, it appears that the audit rate (AUDIT) variable, in and of itself, may be viewed as an effective deterrent to federal personal income taxation. In addition, the estimated coefficient on the penalty variable (PEN) is also negative and statistically significant at the 1% level, so that higher IRS penalties do appear to deter personal income tax evasion. These findings are consistent with previous studies such as Clotfelter [1983], Ali -- Cecil – Knoblett [2001], Saltz [2001], and Cebula [2004], who suggest that such IRS policies are important tax-evasion disincentives.
As a simple first test of the robustness of the estimation in column (a) of Table 4, the same model is estimated but in semi-log form. These results are provided in column (b) of the Table. Once again, all eight of the estimated coefficients exhibit the expected signs, with five statistically significant at the 1% level and two statistically significant at the 2.5% level. Qualitatively, the pattern of results closely parallels that in column (a).
The estimated coefficient on MAXTAX is positive and statistically significant at the 2% level. In this case, a one percentage point increase in the maximum marginal personal income tax rate would elicit a 3% increase in the aggregate degree of federal personal income tax evasion. The coefficient on the Tax Reform Act of 1986 is negative and statistically significant at the 1% level. Based on Halvorsen -- Palmquist [1980], the interpretation of this coefficient is that the Tax Reform Act of 1986 elicited a temporary reduction in personal tax evasion of roughly 12-13%. The estimated coefficient on the TFTEN variable is negative and statistically significant at the 2.5% level. In this case a 1% increase in the ratio of the tax free interest rate yield on high grade municipals to the federally taxable interest rate on ten year Treasury notes would elicit a 5.77%
reduction in tax evasion. The estimated coefficient on the variable THREE is positive and statistically significant at the 1% level. In this case, a rise in the interest rate yield on three year Treasury notes of 100 basis points would elicit a 2% increase in the degree of income tax evasion. Once again the DIS variable exhibits a statistically insignificant coefficient. However, the second war in Iraq, Operation Iraqi Freedom (GULFWAR2), appears to have elicited a 1.9%-2% temporary increase in income tax evasion [Halvorsen -- Palmquist, 1980]. Finally, there are the two IRS policies. The estimated coefficients on both AUDIT and PENALTY are negative and statistically significant at the 1% level. A rise in the audit rate of 1% (nearly doubling the use of this policy tool) would appear to reduce personal income tax evasion by roughly 18%, whereas a 1% increase in the IRS penalty assessment rate would reduce personal income tax evasion by 3%. Thus, it appears that more aggressive IRS enforcement policies can be effective tools in mitigating the degree of federal personal income taxation.
4.
--
An Extension of the Model
Prior to the passage of the Tax Reform Act of 1986, to the extent that inflation increased
peoples’ taxable incomes, often-times the phenomenon of “bracket creep” was experienced, i.e., many people would be subjected to higher marginal tax rates simply because of the impact of
expected benefits of such behavior were greater. Naturally, this bracket creep phenomenon leads to
“fiscal drag” as an economy is expanding, i.e., as the real GDP level is growing.
After the passage of the Tax Reform Act of 1986, the basic income tax structure was
indexed for inflation. Thus, if one’s nominal taxable income rose by the same approximate degree
as the inflation rate, i.e., one’sreal taxable income theoretically remained unchanged, one’s highest marginal tax bracket generally remained the same. However, if one’s real taxable income rose, i.e.,
one’s nominal taxable income rose by more than the inflation rate, one’s taxable income could still move into a higher marginal tax bracket. The latter fact would quite obviously raise the specter of a higher tax bracket and increase the expected benefits of income tax evasion.
Thus, despite the indexing for inflation built into the Internal Revenue Code by provisions the Tax Reform Act of 1986, the higher the average real per capita taxable income (RINC) in the economy, the greater the expected benefits of tax evasion, ceteris paribus. Adding this additional factor into the basic model yields the following augmented specification:
(UAGI/RAGI)t= f(MAXTt-1,TRAt, TFTENt-1,THREEt-1,, DISt-1, GULFWAR2t,
AUDITt-1, PENt-1, RINCt , AR(1), AR(2)) [15]
Observe that the dependent variable (UAGI/RAGI)t is contemporaneous with RINCt .This is because the taxpayer typically does not know until year t whether his/her real income growth has put them in a higher marginal tax bracket. This specification of course introduces the possibility of simultaneity bias. Accordingly, the expanded model in [15] is to be estimated by two-stage least squares. The instrument chosen was the two-year lag of the percentage unemployment rate of the civilian labor force, Ut-2 [Council of Economic Advisors, 2010, Table B-42]. The variable Ut-2 was chosen because it was found to be highly correlated with RINCt while being uncorrelated with the error term in the system. AR(1) and AR(2) are autoregressive terms.
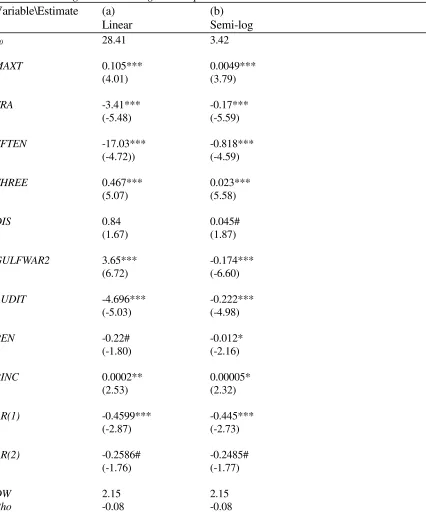
The autoregressive two-stage least squares estimate of equation [15] in linear form is found in column (a) of Table 5, whereas the autoregressive two-stage least squares estimate of equation [15] in semi-log form is found in column (b) of Table 5. In column (a) of Table 5, all nine of the estimated coefficients exhibit the expected signs. In addition, six are statistically significant at the 1% level, one is statistically significant at the 2.5% level, and one is statistically significant at beyond the 10% level. In column (b) of Table 5, once again all of the estimated coefficients exhibit the hypothesized signs. In this estimate, six are statistically significant at the 1% level, two are statistically significant at the 5% level, and one is statistically significant at the 10% level.
The results summarized in Table 5 essentially parallel those in Table 4, aside from the additional findings for the RINC variable. In particular, the aggregate degree of federal personal income tax evasion in the U.S. is an increasing function of MAXT, THREE, and GULFWAR. In addition, the aggregate degree of federal personal income taxation in the U.S. is a decreasing function of TRA, TFTEN, AUDIT, and PEN. Finally, the autoregressive two-stage least squares estimates provided in Table 5 indicate that the aggregate degree of federal personal income taxation in the U.S. is an increasing function of RINC. The latter result suggests that bracket creep caused by a rising real income continues to create an incentive to engage in income tax evasion.4
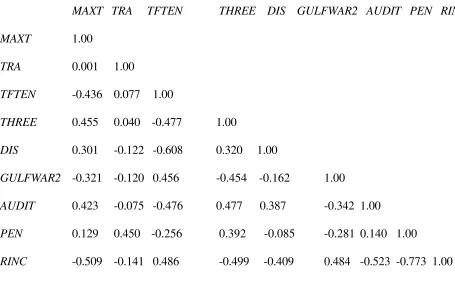
4 The correlation matrix is provided in the Appendix. In the case of the variables PEN and
11
5. --
Summary and Overview
The empirical estimates in this study indicate consistently that the aggregate degree of federal personal income taxation in the U.S. is an increasing function of the maximum marginal federal personal income tax rate and the interest rate yield on three year U.S. Treasury notes, where the latter serves as a proxy for the opportunity cost of income tax compliance.5 In addition, there is evidence that that unpopular U.S. military actions such as the second war in Iraq (Operation Iraqi Freedom) lead to increased income tax evasion.6 Furthermore, as hypothesized above, there is compelling evidence that the higher the per capita real income in the U.S, the greater the degree of aggregate federal income evasion.
Furthermore, the estimates provided in this study indicate consistently that the aggregate degree of federal personal income evasion in the U.S. is a decreasing function of the ratio of the tax free interest rate yield on high grade municipals to the federally taxable interest rate yield on ten year Treasury notes, the audit rate by IRS personnel, and the IRS penalty assessment rate on detected unreported income. In addition, the Tax Reform Act of 1986 elicited a temporary reduction in personal income tax evasion.
Arguably, from a policy perspective, two results that stand out are those regarding the variables AUDIT and PEN. In particular, the empirical evidence provided in this study strongly implies that higher audit rates by IRS personnel per se and higher/harsher IRS penalty assessments on detected unreported income would be effective means by which to discourage federal income evasion and thereby raise federal tax revenues, reduce federal budget deficits, and slow the growth of the national debt. Moreover, by reducing budget deficits, such IRS policies might help to lower market interest rates [Al-Saji, 1992, 1993; Barth – Iden -- Russek, 1984,1985; Cebula, 1997; Cebula -- Cuellar, 2010, Findlay, 1990; Gissey, 1999; Hoelscher, 1996; Johnson, 1992; Tanzi, 1985; Zahid, 1988]. Potentially, these findings may be useful to policymakers outside the U.S.
The problem in part with pursuing such policies in the U.S., at least in an aggressive fashion, is Public Law 104-168, known as the “Taxpayer Bill of Rights 2,” which was signed into law by former President Clinton on July 30, 1996. In effect, this law contains numerous provisions intended to protect U.S. taxpayers and taxpayer rights in complying with the Internal Revenue Code and in dealing with the IRS. In effect, a policy of significantly more aggressive IRS policies would likely run counter to the spirit (and perhaps even the letter) of this law and prove to be politically unfeasible. That said, a modest increase in the IRS audit rate and/or IRS penalty assessments might prove worthwhile in providing some net federal revenue increases.
5 Very similar results can be obtained using U.S. Treasury bill yields.
6 This finding is similar to earlier studies [Feige, 1994; Saltz, 2001; Cebula, 2001] have found
Appendix
For the interested reader, the Appendix to this study provides the correlation matrix for the explanatory variables. These can be found in Table 6. For the most part, the only variable of any concern is RINC. Nevertheless, the results reported in Table 5 remain nearly as robust as those in Table 4.
REFERENCES
Ali, M.M. -- Cecil, H.W. -- Knoblett J.A., 2001, “The Effects of Tax Rates and Enforcement Policies on Taxpayer Compliance: A Study of Self-Employed Taxpayers”,
Atlantic Economic Journal, 29, pp. 186-202.
Al-Saji, A., 1992, “The Impact of Government Budget Deficits on Ex Post Real Long-term
Interest Rates in the U.K.,” Economia Internazionale, 45, pp. 158-163.
Al-Saji, A., 1993, “Government Budget Deficits, Nominal and Ex Ante Real Long Term Interest
Rates in the U.K,” Atlantic Economic Journal, 21, pp. 71-77.
Allingham, M.G. -- Sandmo, A., 1972, “Income Tax Evasion”,Journal of Public Economics, 1, pp. 323-338.
Alm, J. -- Yunus, M., 2009, “Spatiality and Persistence in U.S. Individual Income Tax Compliance”, National Tax Journal, 62, pp. 101-124.
Alm, J. -- Jackson, B. -- McKee, M., 1992, “Institutional Uncertainty and Taxpayer Compliance”,
American Economic Review, 82, pp. 1018-1026.
Baldry, J.C., 1987, “Income Tax Evasion and the Tax Schedule: Some Experimental Results”,
Public Finance/Finances Publiques, 42, pp. 357-383.
Barth, J.R., 1991, The Great Savings and Loan Debacle, Washington, D.C.: American Enterprise Institute.
Barth, J.R. -- Brumbaugh, R.D., 1992, The Reform of Federal Deposit Insurance, New York: Harper Business.
Barth, J.R. -- Iden, G. -- Russek, F., 1984, “Do Federal Budget Deficits Really Matter”?
Contemporary Policy Issues, 3, pp. 79-95.
Barth, J.R. -- Iden, G. -- Russek, F., 1985, “Federal Borrowing and Short Term Interest Rates: Comment”, Southern Economic Journal, 52, pp. 554-559.
Caballe, J. -- Panades, J., 1997, “Tax Evasion and Economic Growth”, Public Finance/Finances Publiques, 52, pp. 318-340.
Carson, C., 1984, “The Underground Economy: An Introduction”,Survey of Current Business, 64, pp. 24-35.
Cebula, R.J., 1997, “An Empirical Note on the Impact of the Federal Budget Deficit on Ex Ante
Real Long-term Interest Rates”, Southern Economic Journal, 63, pp. 1094-1099. Cebula, R J., 2001, “Impact of Income-Detection Technology and Other Factors on Aggregate
Income Tax Evasion: The Case of the United States”, Banca Nazionale del Lavoro Quarterly Review, 54, pp. 401-415.
13
Cebula, R.J. -- Coombs, C., 2009, “Do Government –Spending-Induced Federal Budget Deficits
‘Crowd Out’ Tax Compliance in the U.S.”? Tax Notes, 56, pp. 1007-1012.
Cebula, R.J. -- Coombs, C. -- Yang, B.Z., 2009, “The Tax Reform Act of 1986: An Assessment in
Terms of Tax Compliance Behavior in the U.S.”, International Economics, 51, pp. 247-259.
Cebula, R.J. -- Cuellar, P., 2010, “Recent Evidence on the Impact of Government Budget Deficits on the Ex Ante Real Interest Rate Yield on Moody’s Baa-rated Corporate Bonds”, Journal of Economics and Finance, 34, pp. 301-307.
Cebula, R.J. -- Feige, E.L., 2012, “America’s Unreported Economy: Measuring the Size and Growth of Income Tax Evasion in the U.S.”, Crime, Law, and Social Justice, 57, pp. 265-285.
Christie, E. – Holzner, M., 2006, “What Explains Tax Evasion? An Empirical Assessment Based on European Data”, Vienna Institute for International Economic Studies Working Paper No. 40.
Clotfelter, C.T., 1983, “Tax Evasion and Tax Rates: An Analysis of Individual Returns”,Review of Economics and Statistics, 65, pp. 363-373.
Cook, J.P. -- Issa, T.A., 2007, “Economics, Wars and Scandals: Their Impact on the U.S. Public Approval Rating of Its President”, IUP Journal of Applied Economics, 1, pp. 31-39.
Council of Economic Advisors, 2010, Economic Report of the President, 2010, Washington, D.C.: U.S. Government Printing Office.
Cox, D., 1984, “Raising Revenue in the Underground Economy”, National Tax Journal, 37, pp. 283-288.
Das-Gupta, A., 1994, “A Theory of Hard-to-Get Groups”, Public Finance/Finances Publiques, 49, pp. 28-39.
De Juan, A., 1989, Fiscal Attitudes and Behavior: A Study of 16-35 Year Old Swedish Citizens, Stockholm, Sweden: Stockholm School of Economics.
Erard, B. -- Feinstein, J.S., 1994], “The Role of Moral Sentiments and Audit Perceptions in Tax
Compliance”,Public Finance/Finances Publiques, 49, pp. 70-89.
Falkinger, J., 1988, “Tax Evasion and Equity: A Theoretical Analysis”, Public Finance/Finances Publiques, 43, pp. 388-395.
Feige, E.L., 1996, “Overseas Holdings of U.S. Currency and the Underground Economy”,
in Pozo, S., editor, Exploring the Underground Economy, Kalamazoo, MI: W.E. Upjohn Institute for Employment Research, pp. 215-235.
Feige, E.L., 1997, “Revised Estimates of the Size of the U.S. Underground Economy:
Implications of U.S. Currency Held Abroad”, in Lippert, O. -- Walker, M., editors, The Underground Economy: Global Evidence of Its Size and Impact, Vancouver, Canada: Fraser Institute, pp. 146-165.
Feige, E. L., 1989, The Underground Economies: Tax Evasion and Information Distortion, Cambridge: Cambridge University Press.
Feige, E.L., 1994, “The Underground Economy and the Currency Enigma”,Public Finance/Finances Publiques, 49, pp. 119-136.
Findlay, D.W., 1990, “Budget Deficits, Expected Inflation, and Short-term Real Interest Rates”,
Friedland, N., 1982, “A Note on Tax Evasion as a Function of the Quality of Information about The Credibility of Threatened Fines: Some Preliminary Research”, Journal of Applied Psychology, 12, pp. 54-59.
Gissey, W., 1999, “Net Treasury Borrowing and Interest Rate Changes”, Journal of Economics and Finance, 23, pp. 211-219.
Government Accounting Office, 1996, Individual Audit Rates, Washington, D.C.: U.S. Government Printing Office.
Halvorsen, R. -- Palmquist, R., 1980, “The Interpretation of Dummy Variables in Semi -logrithmic Regressions”, American Economic Review, 70, pp. 474-475.
Hoelscher, G., 1986, “New Evidence on Deficits and Interest Rates”, Journal of Money, Credit and Banking, 18, pp. 1-17.
Internal Revenue Service, 2010, Aggregate Unreported Income Statistics, Washington, D.C.: U.S. Government Printing Office.
Johnson, C.F., 1992, “An Empirical Note on Interest Rate Equations”, Quarterly Review of Economics and Finance, 32, pp. 141-147
Klepper, S. -- Nagin, D. -- Spurr, S., 1991, “Tax Rates, Tax Compliance, and the Reporting of Long Term Capital Gains”, Public Finance/Finances Publiques, 46, pp. 236-251. Ledbetter, M., 2004, “A Comparison of BEA Estimates of Personal Income and IRS Estimates
of Adjusted Gross Income”,Survey of Current Business, 84, pp. 8-22.
Musgrave, R.A., 1987, “Short of Euphoria”, Journal of Economic Perspectives, 1, pp. 59-71. Newey, W.K. – West, K.D., 1987 “A Simple Positive Semi-definite, Heteroskedasticity and
Autocorrelation Consistent Covariance Matrix”, Econometrica, 55, pp. 703-708. Ott, A.F. -- Vegari, S.B., 2003, “Tax Reform: Chasing the Elusive Dream”, Atlantic Economic
Journal, 31, pp. 266-282.
Pestieau, P. -- Possen, U. -- Slutsky, S., 1994, "Optimal Differential Taxes and Penalties", Public Finance/Finances Publiques, 49, pp. 15-27.
Saltz, I., 2001, “An Empirical Note on Tax Auditing and the Size of the Underground Economy in the U.S, 1962-1980”, International Review of Economics and Business, 48, pp. 119-124.
Sanger, G.C. -- Sirmans, C.F. -- Turnbull, G.K., 1990, “The Effects of Tax Reform on Real Estate: Some Empirical Results”, Land Economics, 66, pp. 409-424.
Spicer, M.W. -- Lundsted, S.B., 1976, “Understanding Tax Evasion”, Public Finance/Finances Publiques, 31, pp. 295-305.
Spicer, M.W. -- Thomas, J.E., 1982, “Audit Probabilities and the Tax-Evasion Decision: An Experimental Approach”, Journal of Economic Psychology, 2, pp. 241-245.
Tanzi, V., 1985, “Fiscal Deficits and Interest Rates in the United States”, IMF Staff Papers, 33, pp. 551-576.
Tanzi, V., 1983, “The Underground Economy in the United States: Annual Estimates, 1930-1980”, IMF Staff Papers, 30, pp. 283-305.
Tanzi, V., 1982, The Underground Economy in the United States and Abroad, Lexington, MA: Lexington Books.
15
University of Michigan Institute for Social Research, 2009, Index of Public Dissatisfaction with Government, Ann Arbor, MI: University of Michigan Press.
U.S. Census Bureau, 1994, Statistical Abstract of the United States, 1994, Washington, D.C.,: U.S Government Printing Office.
U.S. Census Bureau, 1998, Statistical Abstract of the United States, 1998, Washington, D.C.,: U.S Government Printing Office.
U.S. Census Bureau, 1999, Statistical Abstract of the United States, 1999, Washington, D.C.,: U.S Government Printing Office.
U.S. Census Bureau, 2001, Statistical Abstract of the United States, 2001, Washington, D.C.,: U.S Government Printing Office.
U.S. Census Bureau, 2010, Statistical Abstract of the United States, 2010, Washington, D.C.,: U.S Government Printing Office.
Yaniv, G., 1994, “Tax Evasion and the Income Tax Rate: A Theoretical Examination”, Public Finance/Finances Publiques, 49, pp. 107-112.
Table 1–Income tax compliance and evasion rates
Nation Percentage Compliance Rate Percentage Evasion Rate
United States 84.0 16.0
United Kingdom 77.97 22.03
Switzerland 77.7 22.3
France 75.38 24.62
Austria 74.8 25.2
Netherlands 72.84 27.16
Belgium 70.15 29.85
Portugal 68.09 31.91
Germany 67.72 32.28
Italy 62.49 37.51
17
Table 2 - Data for dependent variable, UAGI/RAGI, by year, 1960-2008
Year UAGI/RAGI Year UAGI/RAGI
1960 16.10 1985 21.11
1961 15.47 1986 18.89
1962 15.86 1987 17.42
1963 16.44 1988 18.74
1964 15.88 1989 21.06
1965 14.62 1990 21.06
1966 14.86 1991 21.39
1967 15.36 1992 19.04
1968 15.21 1993 17.70
1969 15.32 1994 17.98
1970 16.30 1995 20.01
1971 16.04 1996 18.64
1972 16.16 1997 18.66
1973 16.27 1998 18.30
1974 17.47 1999 20.55
1975 18.81 2000 22.29
1976 20.17 2001 22.73
1977 20.37 2002 23.94
1978 20.63 2003 23.17
1979 21.14 2004 21.57
1980 22.84 2005 21.98
1981 22.25 2006 23.85
1982 22.93 2007 24.90
1983 21.46 2008 23.94
1984 21.86
Table 3 - Descriptive statistics
Variable Mean Standard Deviation
(UAGI/RAGI) 21.03 2.057
MAXT 44.19 13.72
TRA 0.061 0.242
TFTEN 0.908 0.112
THREE 6.894 3.047
GULFWAR2 0.1818 0.3917
DIS 0.459 0.641
AUDIT 1.242 0.485
PEN 1.401 1.14
19 Table 4 –Autoregressive least squares estimates
Variable\Estimate (a) (b)
Linear Form Semi-log Form
a0 31.49 3.54
MAXT 0.063** * 0.003**
(2.67) (2.55)
TRA -2.28*** -0.116***
(-3.82) (-4.21)
TFTEN -12.04* -0.577**
(-2.39) (-2.44)
THREE 0.405*** 0.02***
(5.04) (4.98)
DIS 0.94 0.48
(1.27) (1.36)
GULFWAR2 3.93*** 0.0018***
(3.39) (3.47)
AUDIT -3.76*** -0.178***
(-4.44) (-4.61)
PEN -0.598*** -0.0029***
(-3.48) (-3.36)
AR(1) 0.006** 0.005**
(2.39) (2.40)
R2 0.76 0.76
AdjR2 0.65 0.66
F 7.31*** 7.40***
DW 2.04 2.05
Rho -0.02 -0.03
No. Iterations
For Convergence 7 7
Table 5 –Autoregressive two stage least squares estimates
Variable\Estimate (a) (b) Linear Semi-log
a0 28.41 3.42
MAXT 0.105*** 0.0049***
(4.01) (3.79)
TRA -3.41*** -0.17***
(-5.48) (-5.59)
TFTEN -17.03*** -0.818***
(-4.72)) (-4.59)
THREE 0.467*** 0.023***
(5.07) (5.58)
DIS 0.84 0.045#
(1.67) (1.87)
GULFWAR2 3.65*** -0.174***
(6.72) (-6.60)
AUDIT -4.696*** -0.222***
(-5.03) (-4.98)
PEN -0.22# -0.012*
(-1.80) (-2.16)
RINC 0.0002** 0.00005*
(2.53) (2.32)
AR(1) -0.4599*** -0.445***
(-2.87) (-2.73)
AR(2) -0.2586# -0.2485#
(-1.76) (-1.77)
DW 2.15 2.15
Rho -0.08 -0.08
21 Table 6- Correlation matrix
MAXT TRA TFTEN THREE DIS GULFWAR2 AUDIT PEN RINC
MAXT 1.00
TRA 0.001 1.00
TFTEN -0.436 0.077 1.00
THREE 0.455 0.040 -0.477 1.00
DIS 0.301 -0.122 -0.608 0.320 1.00
GULFWAR2 -0.321 -0.120 0.456 -0.454 -0.162 1.00
AUDIT 0.423 -0.075 -0.476 0.477 0.387 -0.342 1.00
PEN 0.129 0.450 -0.256 0.392 -0.085 -0.281 0.140 1.00