Isoniazid, Ethambutol, and Streptomycin Resistance Markers in
Mycobacterium tuberculosis
Yvonne Linger,aAlexander Kukhtin,aJulia Golova,aAlexander Perov,aAmine Lambarqui,aLexi Bryant,aGeorge B. Rudy,a Kim Dionne,bStefanie L. Fisher,bNicole Parrish,bDarrell P. Chandlera
Akonni Biosystems, Inc., Frederick, Maryland, USAa; The Johns Hopkins School of Medicine, Baltimore, Maryland, USAb
We developed a simplified microarray test for detecting and identifying mutations inrpoB,katG,inhA,embB, andrpsLand com-pared the analytical performance of the test to that of phenotypic drug susceptibility testing (DST). The analytical sensitivity was estimated to be at least 110 genome copies per amplification reaction. The microarray test correctly detected 95.2% of mutations for which there was a sequence-specific probe on the microarray and 100% of 96 wild-type sequences. In a blinded analysis of 153 clinical isolates, microarray sensitivity for first-line drugs relative to phenotypic DST (true resistance) was 100% for rifam-pin (RIF) (14/14), 90.0% for isoniazid (INH) (36/40), 70% for ethambutol (EMB) (7/10), and 89.1% (57/64) combined. Microar-ray specificity (true susceptibility) for first-line agents was 95.0% for RIF (132/139), 98.2% for INH (111/113), and 98.6% for EMB (141/143). Overall microarray specificity for RIF, INH, and EMB combined was 97.2% (384/395). The overall positive and negative predictive values for RIF, INH, and EMB combined were 84.9% and 98.3%, respectively. For the second-line drug strep-tomycin (STR), overall concordance between the agar proportion method and microarray analysis was 89.5% (137/153). Sensi-tivity was 34.8% (8/23) because of limited microarray coverage for STR-conferring mutations, and specificity was 99.2% (129/ 130). All false-susceptible discrepant results were a consequence of DNA mutations that are not represented by a specific microarray probe. There were zero invalid results from 220 total tests. The simplified microarray system is suitable for detecting resistance-conferring mutations in clinicalM. tuberculosisisolates and can now be used for prospective trials or integrated into an all-in-one, closed-amplicon consumable.
M
ycobacterium tuberculosisinfects one-third of the world’spopulation, with approximately nine million new cases and two million deaths attributable to the disease each year (1). Early case detection and rapid treatment are considered the most effec-tive control strategies to reduceM. tuberculosistransmission (2), especially in cases involving multidrug-resistant (MDR) or exten-sively drug-resistant (XDR)M. tuberculosis. Culture-based meth-ods remain the gold standard for diagnosing drug-resistantM.
tuberculosisbut can take several weeks or months to complete.
Thus, nucleic acid-based drug susceptibility tests are becoming increasingly attractive as diagnostic tools in order to initiate indi-vidualized, patient-appropriate treatment in a timely manner.
Technologies such as Cepheid’s GeneXpert and Hain line probe assays reduce the time to diagnosis for many tuberculosis (TB) patients, provide a rapid read-out indicating resistance to rifampin or selected mutations conferring resistance to other first-or second-line drugs, and illustrate the potential to deploy molec-ular tests closer to the point of need (3). However, the number of known genes and mutations conferring resistance to first- and second-line drugs greatly exceeds the multiplexing capacity of these platforms, which may limit their clinical efficacy in the treat-ment and control of multidrug-resistant or extensively drug-re-sistant TB. Planar and suspension microarrays are well suited to address the multiple-gene, multiple-mutation challenge of diag-nosing drug-resistant TB (4–12), but clinical adoption of microar-ray technology is hampered by poor reproducibility (13–15), complex workflows, and/or extensive user subjectivity and in-volvement in image and data analysis (16). In order to translate microarrays into efficacious TB diagnostics at the point of need, it is therefore necessary to simplify user interaction with the
tech-nology while retaining the ability to detect multiple genes and multiple mutations in a timely manner. The objectives of this study were to develop a gel element microarray test for MDR TB at a level of coverage surpassing what is currently available with WHO-endorsed molecular platforms, estimate the analytical specificity of the test onM. tuberculosisisolates of known genotype and phenotype, and compare the performance of the test to that of conventional drug susceptibility testing as a precursor to integrat-ing the method into an entirely closed-amplicon consumable (17, 18) and sample-to-answer system.
MATERIALS AND METHODS
Isolates and positive controls.The set ofM. tuberculosisisolates and
nucleic acids utilized for this study represents a global and historical dis-tribution of drug-susceptible, drug-resistant, and MDR strains. Materials from the Centers for Disease Control and Prevention (CDC, Atlanta, GA) and the TDR Tuberculosis Strain Bank (19) were provided as heat-killed crude lysates. Available isolates covered only 22 of 39 resistance-confer-ring mutations that were present on the gel element array. Purified DNA fromM. tuberculosisH37Ra was acquired from the American Type Cul-ture Collection (ATCC, Manassas, VA) and quantified on a Nanodrop
Received23 January 2014 Returned for modification28 February 2014 Accepted4 April 2014
Published ahead of print9 April 2014
Editor:G. A. Land
Address correspondence to Darrell P. Chandler, dchandler@akonni.com.
Copyright © 2014, American Society for Microbiology. All Rights Reserved.
doi:10.1128/JCM.00238-14
on May 16, 2020 by guest
http://jcm.asm.org/
3000 fluorometer before use. CDC and TDR materials were used to verify the analytical specificity of microarray probes before verification of array performance on blinded samples from the Johns Hopkins Hospital (JHH) clinical isolate archive. M13mp18 single-stranded DNA was purchased from New England BioLabs (Ipswich, MA) and diluted to 250 pg ml⫺1in
10 mM Tris, 1 mM Na2EDTA (pH 7.5). Crude lysates and purified nucleic
acids were stored at⫺20°C until use.
The JHH M. tuberculosis isolate archive consists of susceptible, monoresistant, MDR, and XDRM. tuberculosisstrains from the mid-Atlantic, south, and southwest regions of the United States as well as from Mexico, South America, Cameroon, and Kazakhstan. Isolates used for this study were collected between 1995 and 2011. JHH isolates were cultivated under biosafety level 3 (BSL-3) conditions on Lowenstein-Jensen (L-J) agar slants and maintained at 37°C in 5% CO2. Crude lysates were
pre-pared from each strain by harvesting a small amount of cells from L-J slants, resuspending the cells in Middlebrook 7H9 broth, and adjusting the turbidity to a 0.5 McFarland standard (ca. 1.5⫻108CFU ml⫺1).
Subsequently, 1 ml of each standardized suspension was centrifuged for 5 min at 13,000⫻g, and the supernatant was removed. Cell pellets were resuspended in 200l of molecular-grade water, heat killed at 95°C for 30 min, sonicated for 15 min, and centrifuged for 5 min at 13,000⫻g. A 100-l aliquot of each supernatant was then removed and stored at
⫺20°C until use, representing approximately 7.5⫻107CFU equivalents
of bacteria and 3.3 ng DNAl⫺1, assuming a genome size of 4⫻106bp
and one bacterium per CFU. PCR setup with crude lysates was performed under BSL-2 conditions, and all other manipulations were performed under BSL-1 controls with universal PCR precautions.
Phenotypic drug susceptibility testing.Each JHH isolate was tested
for phenotypic resistance to rifampin (RIF), isoniazid (INH), ethambutol (EMB), and streptomycin (STR) using the MGIT-960 system as per the manufacturer’s recommendations (Becton, Dickinson, Sparks, MD), and 1% agar proportion as per the Clinical and Laboratory Standards Institute (CLSI) M24-A2 standards (20). The MGIT-960 and agar proportion methods both have established breakpoints for drug susceptibility and resistance determinations. For a selected subset of strains (n⫽78), the TREK Sensititre MYCOTB assay (TREK Diagnostic Systems, Cleveland, OH) was used to establish a MIC for each drug.
Primers, probes, and synthetic DNA standards.Amplification
prim-ers and microarray probes were designed againstM. tuberculosisgenes and target codons shown inTable 1. Genes and codons represent high-confi-dence mutations known to confer resistance to RIF, INH, EMB, or STR. Nine PCR primer pairs were designed to work together in a multiplex, asymmetric master mix, where one of the primers in each pair was syn-thesized with a Cy3 label and the resulting single-stranded, labeled ampli-con was captured by one or more immobilized microarray probes. Only one amplification reaction is required per test. PCR primers were synthe-sized by standard phosphoramidite chemistry at Akonni or Eurofins
MWG Operon (Huntsville, AL), purified by high-performance liquid chromatography (HPLC), and quantified by UV absorption before use. The resulting Cy3-labeled, asymmetric amplicons ranged from 92 to 139 nucleotides (nt) in length.
Microarray probes were synthesized by Akonni with a custom 3=linker and purified to⬎90% purity by HPLC before use. Probe purity was mea-sured by electrospray ionization-mass spectrometry. Each microarray contained a universal hybridization probe for each functional gene and primer pair to verify that theM. tuberculosisgene targets were amplified from each sample. At least one matched pair of microarray probes (wild type [WT] and single-nucleotide mutant [MU]) was included for each mutation of interest. Control probes included a Cy3 beacon for manufac-turing quality control and positional reference, a synthetic hybridization control probe with no known homology to any naturally occurring se-quence, and a probe for the M13 internal amplification and inhibition control. A 92-base, Cy3-labeled hybridization control target was synthe-sized by TriLink Biotechnologies (San Diego, CA), HPLC purified to
⬎90% purity, and diluted to 100 pg ml⫺1in 10 mM Tris, 1 mM Na 2EDTA
(pH 7.5).
Microarray manufacture.Gel element arrays were manufactured on
custom-coated glass substrates by a single-step copolymerization proce-dure using a 4% 2-hydroxyethyl methylacrylamide copolymer, essentially as described in reference21. Cy3 beacons were immobilized at 1M, and all other probes were immobilized at 50M. Up to three microarrays were printed on each glass substrate, but only one microarray is required per test. All microarrays were visually inspected for gel element presence and uniform morphology before use. Microarrays were stored at room tem-perature in a dust-free container until use (⬍1 month). Immediately be-fore use, a 50-l gasket was applied around each microarray.
Multiplex, asymmetric amplification.Amplification reactions were
assembled in 0.2-ml thin-walled PCR tubes and cycled on Quanta Biotech QB-96 thermal cyclers (Surrey, United Kingdom). The nine pairs of for-ward and reverse primers were combined in 1:10 ratios and prepared as a concentrated master mix to achieve a final primer concentration of 0.04 to 0.4M each per reaction. Each 50-l reaction mixture contained 3l of template (crude lysate or purified DNA), 25l Qiagen multiplex PCR kit all-in-one amplification buffer and enzyme (Valencia, CA), 18l asym-metric PCR primer mix, 5% dimethyl sulfoxide (Sigma-Aldrich, St. Louis, MO), and 0.6gl⫺1nonacetylated bovine serum albumin
(Sigma-Al-drich). One microliter of M13 internal positive control (250 fg total) was included in all reaction mixtures, unless otherwise noted. The balance of each reaction was made up with sterile, ultrapure water as required. No-template controls containing the M13 internal positive control were cessed in parallel for each set of experiments. The thermal cycling pro-gram consisted of an initial denaturation at 95°C for 15 min, followed by 40 cycles of 94°C for 30 s, 60°C for 60 s, and 72°C for 30 s, and a final extension at 72°C for 3 min. The actual run time for thermal cycling was
⬃2 h. Amplified material was either used immediately for microarray hybridization or stored at⫺20°C until use.
Hybridization and detection.After amplification, 20l of unpurified
amplicon was combined with 30l of a concentrated hybridization mas-ter mix to achieve a final reaction mixture consisting of 1 M guanidine thiocyanate, 50 mM HEPES (pH 7.5), 5 mM Na2EDTA (pH 8.0), 3.3g l⫺1nonacetylated bovine serum albumin (BSA), and 4 fmoll⫺1
Cy3-labeled internal hybridization control. Forty-nine microliters of the re-sulting mixture was applied directly to the center of each microarray, and microarrays were covered with a Parafilm coverslip and hybridized for 3 h at 55°C on an MJ Research PTC-225 slide tower. After hybridization, coverslips and gaskets were removed, and up to 24 microarrays were washed simultaneously in 350 ml 1⫻SSPE (150 mM NaCl, 10 mM NaH2PO4· H2O, 10 mM Na2EDTA), 0.01% Triton X-100 (pH 7.4) for 10
min with gentle agitation. Arrays were then dipped twice in ultrapure water and dried with compressed air.
Imaging and data analysis.Dried microarrays were imaged on an
Akonni field-portable microarray analyzer, a very simple imager
consist-TABLE 1Microarray coverage
Drug Gene
Amplicon
size (nt) Targeted codon(s)
Total no. of mutations
RIF rpoB 139 507, 510, 511, 512, 513, 515, 516, 522, 524, 526, 531 and 533
30
INH katG 127 315 2
inhA 106 8, 15, and 17 4
EMB embB 113 306 1
STR rpsL 94 and 120 43 and 88 2
NAa IS6110 99 M. tuberculosiscomplex NA
NA IS1245 123 M. aviumcomplex NA NA M13 92 Internal amplification
and hybridization control
NA
aNA, not applicable.
on May 16, 2020 by guest
http://jcm.asm.org/
[image:2.585.40.289.77.225.2]ing of a high-intensity green-light-emitting diode (LED), custom optics, and noncooled charge-coupled device (CCD) camera. Image acquisition ranged from 0.05 to 0.1 s per array, and pixel data were acquired from raw .tif images using Spotfinder (J. Craig Venter Institute) software and a fixed-circle algorithm (mask size⫽25 pixel diameter) with all back-ground pixels included in the analysis (top backback-ground cutoff value in Spotfinder set to zero). Local background was subtracted from the signal of each gel element. Integrated (background-corrected) signal intensity data were exported as tab-delimited text and imported into custom Excel spreadsheets for data analysis. Signal-to-noise ratios (SNRs) were calcu-lated using the background-corrected signal from gel elements and nor-malizing against 3 times the standard deviation of the average local back-ground.
A test was declared valid only if the average Cy3 beacon, internal hy-bridization control, and M13 amplification/inhibition control probes all generated SNRs ofⱖ3. Otherwise, the test was deemed invalid and test results were not reported. The IS6110 and IS1245 probes are internal positive controls, a proxy for detecting members of theM. tuberculosisand
Mycobacterium aviumcomplexes, respectively, and are used to condition the report for RIF, INH, EMB, and STR resistance-conferring mutations. Positive detection of both the IS6110and IS1245probes was considered to indicate a mixed sample. For all valid tests, if the IS1245probe forM. aviumcomplex (MAC) is detected, then no genotyping results are re-ported for theM. tuberculosisresistance-conferring mutations. Otherwise, discrimination ratios (D) were calculated for valid tests as (SNRWT⫺
SNRMU)/(SNRWT⫹SNRMU). As currently implemented, a zero-copy
IS6110isolate will still generate discrimination ratios forM. tuberculosis
resistance-conferring mutations, because the PCR primers forrpoB,inhA,
katG,embB, andrpsLare specific forM. tuberculosis. For this study, any value ofDofⱖ0 was interpreted as a wild-type sequence at the targeted nucleotide position, and any value ofDof⬍0 was interpreted as a muta-tion at the targeted nucleotide posimuta-tion. Results from this study were in-tended, in part, to understand and refine values forDthat should corre-spond to an inconclusive test result before automating the image and data analysis algorithms for a clinical user and prospectively testing the mi-croarray with decontaminated sediments or raw sputum samples.
If either IS1245or IS6110was detected at an SNR ofⱖ20, then the output from the internal control probes was reported as “not applicable.” Deferring the interpretation of internal controls in the event of an “M. tuberculosis” or “MAC detected” result is based on the fact that the M13 internal positive control is included at a concentration very near its limit of detection. In cases where there is a very high concentration ofM. tu-berculosisDNA in the asymmetric PCR, there may be preferential ampli-fication of theM. tuberculosisgenes such that asymmetric M13 amplifica-tion is limited, and the M13 SNR is⬍3 (i.e., not detected).
RESULTS
Analytical sensitivity.Analytical sensitivity for correct genotyp-ing was estimated by prepargenotyp-ing a dilution series of quantified H37Ra DNA between 1 ng and 10 fg per test and performing the test in triplicate. Reproducible detection and correct genotyping was obtained between 500 fg and 1 pg DNA per test, or between 110 and 225 genome copies. At 500 fg, discrimination ratios (D) for therpoBmutation 531W were between⫺0.07, and⫺0.12, and one of three replicates for therpoBmutation 531C2 resulted in aD
value of⫺0.03. In the absence of an indeterminate threshold for
D, these values resulted in a false positive for RIF resistance. With a thresholdDvalue ofⱕ⫺0.2 for declaring resistance (see Discus-sion), the estimated limit of detection for the test is between 500 fg and 100 fg, or 110 and 25 genome copies. The upper range for correct genotyping has not yet been determined, although the anticipated quantity of genomic DNA per test from positive-con-trol and JHH clinical isolates (below) was estimated to be⬎5 ng per test, and we have anecdotal evidence that 100 ngM.
tubercu-losisDNA per test still leads to correctM. tuberculosisgenotyping
and behavior of the internal positive controls (data not shown). Opportunities for improving the lower limit of detection (LOD) are described below.
Analytical specificity. The M13 internal amplification and hybridization control was detected in all tests, and all no-template controls were consistently negative. The analytical specificity of the microarray test was evaluated with CDC and TDR isolates of known genotype, with results summarized inTable 2. The 32 CDC and TDR isolates harbored 68 mutations inrpoB, inhA, katG,
[image:3.585.301.541.98.504.2]embB, and rpsLgenes, six of which were not represented by a specific microarray probe. Of the 62 resistance-conferring muta-tions for which there was a sequence-specific probe on the mi-croarray, the microarray correctly detected 95.2% of them (59/ 62), with false-negative genotyping results associated with the
TABLE 2Microarray test specificity for 32 MDR-M. tuberculosisisolates of known genotype, representing 22 of the 39 specific mutations covered by the microarray probes
Gene
Isolate mutationa
No. of isolates:
With corresponding mutation
Detected by genotype
Detected by phenotype
rpoB WT 4 4 4
L511P 1 1 1
L511R 1 1 1
Q513L 1 0 1
M515I 1 1 1
D516E 2 0 0
D516V 2 2 2
D516Y 1 1 1
S522L 1 1 1
H526L 2 2 2
H526N 3 3 3
H526P 1 1 1
H526R 3 3 3
H526S* 1 0 1
H526Y 1 1 1
L533P 3 3 3
S531F* 1 0 1
S531L 5 5 5
S531W 2 2 2
inhA WT 27 27 27
15T 4 4 4
8G* 1 0 1
katG WT 18 18 18
S315N 4 4 4
S315T 9 9 9
S315I* 1 0 0
embB WT 25 25 25
M306I 5 5 5
M306L* 1 0 0
M306V* 1 0 0
rpsL WT 22 22 22
K43R 7 7 7
K88R 3 3 3
a
*, identified mutation in the CDC or TDR isolate that is not represented by a mutation-specific probe on the microarray (n⫽6 near neighbor mutations). WT, wild type.
on May 16, 2020 by guest
http://jcm.asm.org/
rpoBmutations Q513L and D516E. At least one near-neighbor probe was sensitive to three of the six known mutations that were not represented by a specific probe on the microarray, which is similar to the behavior of “sloppy molecular beacon” probes (22). There were also 96 wild-type sequences interrogated by the mi-croarray test, 100% of which were correctly identified as wild type. Relative to phenotypic drug susceptibility tests, there was only one false-susceptible phenotypic result corresponding with therpoB
mutation D516E. These data demonstrate that the test can accu-rately detect resistance-conferring mutations when a mutation-specific probe is present on the microarray and provided the im-petus for testing the system on blinded clinical isolates.
Blinded clinical isolates.Of the 153 blinded clinical isolates from the JHH archive, phenotypic resistance to the first-line drugs RIF, INH, and EMB was detected by agar proportion in 40, 14, and 10 strains, respectively. Resistance was confirmed on these strains using the MGIT-960 system. Additional testing was performed on selected strains to determine MICs for the individual antibiotics, resulting in 459 data points that served as the phenotypic drug susceptibility test (DST) comparator for microarray system per-formance.
Overall concordance between agar proportion and the mi-croarray test for the first-line drugs was 95.4% (146/153) for RIF, 96.1% (147/153) for INH, 96.7% (148/153) for EMB, and 96.1% (441/459) for the three drugs combined. There was no obvious difference in concordance when isolates were segregated by geo-graphical origin or year of collection.
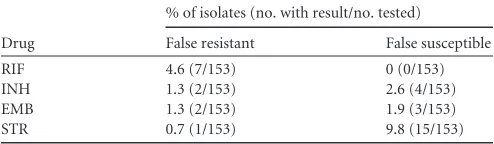
The percentage of false-resistant or false-susceptible results for all drugs is shown inTable 3, and discrepant analysis relative to DNA sequencing is shown inTable 4. Microarray sensitivity (true resistance) for the first line drugs was 100% for RIF (14/14), 90.0% for INH (36/40) and 70% for EMB (7/10). Overall microarray sensitivity for RIF, INH, and EMB combined was 89.1% (57/64). Microarray specificity (true susceptibility) was 95.0% for RIF (132/139), 98.2% for INH (111/113), and 98.6% for EMB (141/ 143). Overall microarray specificity for RIF, INH, and EMB com-bined was 97.2% (384/395). The overall positive and negative pre-dictive values for RIF, INH, and EMB combined were 84.9% and 98.3%, respectively. MICs for isolates that had a false-susceptible microarray result for INH or EMB were well above established breakpoints for each drug and ranged from 0.5g ml⫺1to 4.0g ml⫺1for INH and⬎5.0g ml⫺1to 16.0g ml⫺1for EMB (Table 4); there were no false-susceptible microarray results for RIF.
A total of 153 phenotypic data points were collected for STR, which is now considered a second-line drug. Phenotypic STR re-sistance was detected in 23 of the 153 strains. Overall concordance between agar proportion and the microarray was 89.5% (137/ 153). Sensitivity was 34.8% (8/23) and specificity was 99.2% (129/ 130). Nine of the 10 isolates correctly identified as STR resistant by
the microarray test had STR MICs ofⱖ32g ml⫺1, and one strain had an MIC of 4g ml⫺1. There was only one false-resistant STR result (0.65%) but 15 (9.8%) false-susceptible results. All other STR resistant isolates (n⫽15) for which false-susceptible errors occurred had MICs ranging from 4g ml⫺1to 8g ml⫺1.
There were 33 discrepant phenotypic results between the mi-croarray and the standard phenotypic tests, but there were only two discrepant results based on DNA sequence (Table 4). Two RIF false-resistant calls (isolates S15 and CM161) involved a fairly weak microarray discrimination ratio (D) that may be best cate-gorized as indeterminate; identifying an indeterminate range for
Dwas an explicit objective of this study. All false-sensitive discrep-ant results were a consequence of DNA mutations that are not represented by a specific microarray probe. These data demon-strate that, from a DNA sequencing and hybridization perspec-tive, the microarray is very specific and provides the correct multidrug resistance genotype 98.7% of the time when the re-sistance-conferring mutation is present in both the genome and the microarray (i.e., in 151/153 isolates).
There were 220 total tests (including negative controls) per-formed during the course of this study, with zero invalid tests. Six amplified samples were rehybridized to confirm the initial test result due to observed physical damage on one or more gel ele-ments on an array, and one amplified sample was rehybridized due to a fluorescent artifact. The overall microarray hybridization repeat rate was therefore 3.2% (7/220). Gel element damage nor-mally occurs as the user is removing the Parafilm coverslip before washing microarrays in a bulk solution. It is fully anticipated that physical gel element damage will be reduced or eliminated once the method is converted into an entirely closed consumable format.
DISCUSSION
Analytical sensitivity.In the absence of any threshold values for
D, the lower limit of detection for the microarray test described here is at least 110 gene copies per amplification reaction, which is very near the limits of molecular sampling error in conventional exponential PCR (23). Provided that a user can purify genomic DNA from primary specimens at⬎10% efficiency, there is no reason that the method or test as described cannot be applied to smear-positive sputum or decontaminated sediments that are ex-pected to contain at least 103to 104CFU ml⫺1.
Based on this study, we identified several fairly simple ways in which the lower LOD of the test can be improved or stabilized. We have anecdotal evidence, for example, that increasing the hybrid-ization temperature from 55°C to 57°C can resolve the false-pos-itiverpoBsignals at 100 to 500 fg input DNA. It is also possible to increase the number of amplification cycles, at the expense of in-creasing the total analysis time. Neither of these approaches was specifically addressed during the course of this study, because a 110-genome-copy limit of detection was deemed sufficiently sen-sitive to evaluate microarray specificity.
[image:4.585.40.287.88.160.2]Analytical specificity.The analytical specificity of the microar-ray test is defined by the specificity of probe hybridization to cog-nate DNA sequences (Tables 2and4) rather than microarray re-sponse relative to phenotypic drug susceptibility results (Table 3). In this context, the analytical specificity of the microarray test was excellent for both the control and blinded clinical isolates. The most weakly performing probes were those for therpoBmutations Q513L and D516E, for which hybridization signal intensity was
TABLE 3Rates of false-resistant and false-susceptible results for 153 blinded isolates
Drug
% of isolates (no. with result/no. tested)
False resistant False susceptible
RIF 4.6 (7/153) 0 (0/153)
INH 1.3 (2/153) 2.6 (4/153)
EMB 1.3 (2/153) 1.9 (3/153)
STR 0.7 (1/153) 9.8 (15/153)
on May 16, 2020 by guest
http://jcm.asm.org/
lower than that of neighboring or related probes regardless of probe design (sequence length and single-nucleotide polymor-phism [SNP] position within the probe) or gel element polymer composition (data not shown). TherpoBsingle-stranded ampli-con is predicted to have significant stem-loop seampli-condary structure in the 513-to-516 region using Mfold (24), and it is well known that secondary and tertiary structures can negatively influence hy-bridization sensitivity and specificity (25,26). Fortunately, both Q513L and D516E are relatively rare mutations conferring resis-tance to RIF, and the consequence of weak hybridization is man-ifest primarily in analytical sensitivity, not specificity.
It is usually assumed that hybridization specificity needs to be
[image:5.585.41.542.80.561.2]perfect in order for microarrays to have diagnostic value. On the other hand, “sloppy molecular beacons” that are responsive to multiple mutations within a 20-mer reporting probe (22) form the basis of the GeneXpert MTB/RIF assay and enable reasonably sensitive detection (but not identification) of mutations regard-less of where the mutation occurs within the reporting probe. Most of the microarray probes were very specific for their corre-sponding mutation and insensitive to near-neighbor mutations (Table 2), but some probes were not 100% specific. The clinical importance of perfect versus sloppy hybridization specificity ulti-mately depends on the information needed to provide patient-specific antibiotic therapy. For example, if the clinical decision to
TABLE 4Microarray discrepant analysis relative to DNA sequencinga
Phenotypic analysis DNA sequence analysis
Drug Strain MIC
(g/ml) Phenotype Array result
Phenotypic
interpretation Gene Array D
Sequence
Sequence interpretation Amino
acid mutation
Nucleotide mutation
RIF 34 ⬍2 S R FR rpoB L511P ⫺0.77 L511P CTG⬎CCG TR
35 1 S R FR S522L ⫺0.61 S522L TCG⬎TTG TR
66 ⬍2 S R FR H526Y ⫺0.82 H526Y CAC⬎TAC TR
C9 ⬍0.12 S R FR H526N ⫺0.71 H526N CAC⬎AAC TR
C10 ⬍0.03 S R FR H526N ⫺0.37 H526N CAC⬎AAC TR
S15 0.25 S R FR S531C ⫺0.17 WT TCG FR
CM161 0.12 S R FR D516Y ⫺0.13 WT GAC FR
INH 18 ⬍0.1 S R FR inhA 15T1 ⫺0.05 NA 15T1 TR
katG None NA WT AGC
C10 ⬍0.03 S R FR inhA None NA WT 8T, 15C, 17G TR
katG S315T ⫺0.60 S315T AGC⬎ACC
41 0.5 R S FS inhA None NA WT 8T, 15C, 17G TS
katG None NA WT AGC
42 ⬎0.4 R S FS inhA None NA WT 8T, 15C, 17G TS
katG None NA WT AGC
44 ⬎0.4 R S FS inhA None NA WT 8T, 15C, 17G TS
katG None NA WT AGC
58 4 R S FS inhA None NA WT 8T, 15C, 17G TS
katG None NA S315R AGC⬎AGA
EMB 66 ⬍5 S R FR embB M306I ⫺0.95 M306I ATG⬎ATA TR
53 4 S R FR M306I ⫺0.95 M306I ATG⬎ATA TR
59 ⬎5 R S FS None NA M306V ATG⬎GTG TS
67 16 R S FS None NA WT ATG TS
C11 8 R S FS None NA WT ATG TS
STR 34 ⬍2 S R FR rpsL K43R ⫺0.59 K43R, K88 AAG⬎AGG, AAG TR
33 8 R S FS None NA WT, WT AAG, AAG TS
36 8 R S FS None NA WT, WT AAG, AAG TS
37 8 R S FS None NA WT, WT AAG, AAG TS
40 ⬎2 R S FS None NA WT, WT AAG, AAG TS
45 ⬎2 R S FS None NA WT, WT AAG, AAG TS
48 4 R S FS None NA WT, WT AAG, AAG TS
60 4 R S FS None NA WT, WT AAG, AAG TS
67 8 R S FS None NA WT, WT AAG, AAG TS
C7 4 R S FS None NA WT, WT AAG, AAG TS
P15 8 R S FS None NA WT, WT AAG, AAG TS
S1 4 R S FS None NA WT, WT AAG, AAG TS
S4 8 R S FS None NA WT, WT AAG, AAG TS
S14 32 R S FS None NA WT, WT AAG, AAG TS
CM140 4 R S FS None NA WT, WT AAG, AAG TS
a
D, discrimination ratio; S, susceptible; R, resistant; FS, false susceptible; FR, false resistant; TS, true susceptible; TR, true resistance; WT, wild type.
on May 16, 2020 by guest
http://jcm.asm.org/
treat with RIF is based on the presence of any mutation in therpoB
gene, then sloppy hybridization and reporting probes are ade-quate for diagnostic purposes. On the other hand, if the clinical outcome of RIF treatment ultimately depends on epistatic inter-actions or compensatory mutations within therpoBgene (27–30), then it may be important to identify precisely which mutations are present before making a decision to treat or not treat with RIF.
This situation was evident in the analysis of the RIF phenotypic discrepant isolates inTable 4. Isolate C9, for example, was sensi-tive to RIF (MIC⬍0.12) but the microarray reported discrimina-tion ratios (D) of⫺0.71, ⫺0.60, and⫺0.40 for the mutations H526N, H526Y, and H526R, respectively. That multiple 526 probes reported a mutation at codon 526 demonstrates that these probes are somewhat sloppy, as mentioned above. The discrep-ancy between phenotypic and DNA sequence results points to a compensatory mutation or epistatic interactions leading to RIF susceptibility. Given the way in which hybridization signals are calculated and compared, we are able to specifically identify the corresponding 526 mutation, because the actual mutation corre-sponds to the probe with the lowest discriminant ratio (H526N,
D⫽ ⫺0.71). Similar results and conclusions were obtained for isolates 66 and C10 (Table 4). If future clinical research finds that the clinical manifestation of mutation H526N or H526Y is prone to epistatic effects, or that RIF resistance due to H526N or H526Y mutations can be overcome by compensatory mutations else-where inrpoBor theM. tuberculosisgenome, then it is important to specifically identify therpoBgenotype at multiple codon posi-tions before proscribing RIF. These data show how a microarray-based diagnostic and discriminant ratio for each detectable muta-tion can offer clear clinical advantages over nonspecific molecular beacons or line probe assays that rely on subjective interpretation of reporter signal intensities.
One of the technical objectives of this study was to identify preliminary ranges forDthat should result in an indeterminate test output. For example, RIF false-resistance determinations for isolates S15 and CM161 are derived fromDvalues of⫺0.17 and
⫺0.13, respectively, both of which are weak discrimination ratios. Weak discriminant ratios mean that the hybridization signals on the wild-type and corresponding mutant probes are nearly iden-tical and could result from a degraded sample, target nucleic acids near the limit of detection for the test (see above), or a potential mixture of two or more genotypes. Based on the results of this study, we anticipate thatDvalues between⫺0.2 and 0.0 should be considered indeterminate results for declaring a mutation pres-ent, subject to retesting or follow-up analyses. Verifying these ranges for an indeterminate test output will require prospective trials on a much larger set of isolates and primary clinical samples. Clinical potential and drug susceptibility correlates.Most clinical algorithms intended to diagnose drug-resistantM.
tuber-culosisstill include a culture confirmation step, and the resulting
culture must still be tested for susceptibility to other first- or sec-ond-line drugs using conventional phenotypic DST. Since the an-alytical performance of the microarray-based system developed here is consistent with other WHO-endorsed diagnostic tests, it may therefore add value at that point in a clinical diagnostic algo-rithm at which a primary culture tests positive forM. tuberculosis
but which is weeks to months before culture-based, phenotypic DST results are obtained. We also suggest that there is clinical value in specifically identifying drug resistance mutations relative
to conventional measures of DST breakpoints, regardless of the prevalence of the genotypes or mutations in selected populations. For example, false-positive RIF resistance has also been docu-mented for the MTBDRplus and Xpert MTB/RIF assays (31,32), meaning that mutations associated with resistance were detected inrpoB, yet the strains were phenotypically susceptible using sev-eral standardized susceptibility testing methods and DST break-points. In a follow-up study (33), false-positive Xpert MTB/RIF resistance was associated with low-level phenotypic resistance that was below the established critical concentration for RIF (1.0g ml⫺1) but often within one doubling dilution of the critical con-centration.
Since the incidence of genotypic false-positive RIF resistance depends on the prevalence of RIF resistance in a given population (34,35), the unresolved clinical questions are how to accurately correlate genotype with drug susceptibility phenotypes while ful-filling the medical community’s requirements for and desired at-tributes of a rapid molecular TB test (3,36,37). The answer to these questions is especially important when the prevalence of drug resistance in a population is low (⬍5%), when RIF resistance alone is used as a surrogate marker for MDRM. tuberculosis, or when the availability of second-line drugs is limited.
Toward point of use.The purpose of this study was to establish the analytical performance characteristics of a simplified microar-ray method for detecting drug-resistantM. tuberculosisbefore in-tegrating the approach into a closed-amplicon consumable and automated sample-to-answer system that can be deployed beyond reference laboratories. It is nevertheless inevitable that compari-sons will be made between the results of this study and clinical expectations for and opinions about a molecular diagnostic that is intended to initiate treatment with antibiotics in the field.
Knowledge of the full spectrum of mutations that cause drug resistance inM. tuberculosisis relatively complete only for RIF. OngoingM. tuberculosisDNA sequencing projects will identify many more genes and mutations that correlate with drug resis-tance, and other studies will eventually identify the resistance mechanisms caused by these mutations. Even before these explor-atory studies are complete, however, we know that silent muta-tions (38) and some “disputed” mutations are indeed rather com-mon and clinically relevant (39). Thus, it is already clear that detect-to-treat TB diagnostic tests will necessarily require higher levels of multiplexing than are presently available by real-time PCR and will require a capability to specifically identify the mu-tations that are present. It is for this reason that microarrays are still an attractive platform for developing resource-appropriate diagnostics.
In this study, the initial technical aspects of simplifying mi-croarray workflow for translation into an automated, point-of-use system are reflected in (i) a single-tube multiplex PCR that simultaneously incorporates a fluorescent label and generates pre-dominantly short, single-stranded DNA targets for hybridization, (ii) a direct transfer of amplified material to the hybridization reaction mixture without any postamplification cleanup or target fragmentation, and (iii) relatively short hybridization and wash times. The sample-to-answer test was readily performed in a PCR-compatible laboratory environment with no cross contamination, enabled routine processing of 24 samples per 8-hour shift by one operator, and resulted in an analytical sensitivity of at least 110 genomes, which is more than sufficient for the analysis of smear-positive clinical specimens. The procedural simplifications
on May 16, 2020 by guest
http://jcm.asm.org/
scribed here are very conducive to translating the test into an entirely closed-amplicon, all-in-one consumable (40), which is the logical next step in microarray technology development and is conceptually similar to the translation of PCR into real-time PCR, which contributed to the acceptance of PCR as a diagnostic tool in clinical laboratory environments.
A point-of-care intended use, however, does have technical implications that were not addressed as part of this study. For example, we did not address the technical challenges of nucleic acid extraction and purification from raw sputum, performing a sample-to-answer test under BSL-1 conditions, reducing the total analysis time to⬍3 h, providing prepackaged reagents and con-sumables that have a 24-month shelf life at 30°C and in the ab-sence of cold storage, converting the instrumentation into an all-in-one device that can operate from a battery, or manufacturing commercially available, nonsubsidized tests for less than $10 (U.S.) each (3,36,37).
In this context, it is reasonable to ask whether any one technol-ogy or platform can possess all of these desired attributes, given the biological and molecular complexity of drug-resistantM.
tu-berculosisand its diagnostic or technological implications.
Rela-tive to translational potential of the gel element microarray method reported here, we note that the 8-hour total analysis time is a reflection of our desire for internal consistency in comparing the results of this study with preliminary data and quality control methods, rather than an absolute minimum time requirement for performing the test. For example, it may be entirely possible to reduce the 3-h hybridization time to 10 to 15 min without a loss in analytical sensitivity, since the test amplifies target nucleic acids and the hybridization step is already conducted under nonequi-librium hybridization conditions. Likewise,M. tuberculosis cul-tures and smear-positive sputum samples have enoughM.
tuber-culosisDNA per amplification reaction that the total number of
amplification cycles could be significantly reduced without affect-ing genotypaffect-ing specificity. We have retained 40 amplification cy-cles (⬃2 h) as a prelude to detecting drug-resistantM. tuberculosis
in smear-negative, culture-positive specimens, for which there is a tremendous unmet clinical need. Methods and systems for auto-mated nucleic acid extraction from primary specimens (sputum and sediment) are under development and will be reported else-where. In the interim, results from this study indicate that the gel element microarray and simplified method are analytically robust and ready for integration into an all-in-one, closed-amplicon mi-croarray format (17), which is a technology requirement and pre-cursor for a point-of-use, fully integrated, drug-resistant-M.
tuberculosisdiagnostic system and platform.
ACKNOWLEDGMENTS
This work was supported by the Centers for Disease Control and Preven-tion under contract number 200-2006-19011 and the NaPreven-tional Institutes of Health (NIH) under grant RC3 AI089106.
Nucleic acids from the TDR Tuberculosis Strain Bank were provided by the United Nations Children’s Fund/United Nations Development Programme/World Bank/World Health Organization Special Pro-gramme for Research and Training in Tropical Diseases (TDR), Geneva, Switzerland. We are indebted to Thomas Shinnick from the Centers for Disease Control and Prevention for providingM. tuberculosiscrude ly-sates, assay guidance, and a critical review of the manuscript.
REFERENCES
1.WHO.2008. Global tuberculosis control 2008: surveillance, planning, financing. Publication no. WHO/HTM/TB/2008.393. World Health Organization, Geneva, Switzerland.
2.Lemaire J-F, Casenghi M.2010. New diagnostics for tuberculosis: fulfill-ing patient needs first. J. Int. AIDS Soc.13:40.http://dx.doi.org/10.1186 /1758-2652-13-40.
3. WHO. 2012. Tuberculosis diagnostic technology landscape. World Health Organization, Geneva, Switzerland.
4.Bergval I, Sengstake S, Brankova N, Levterova V, Abadia E, Tadumaze N, Bablishvili N, Akhalaia M, Tuin K, Schuitema AR, Panaiotov S, Bachiyska E, Kantardjiev T, de Zwaan R, Schürch A, van Soolingen D, van ’t Hoog A, Cobelens F, Aspindzelashvili R, Sola C, Klaster P, Anthony R.2012. Combined species identification, genotyping, and drug resistance detection of Mycobacterium tuberculosis cultures by MLPA on a bead-based array. PLoS One 7:e43240. http://dx.doi.org/10.1371 /journal.pone.0043240.
5.Gomgnimbou MK, Abadia E, Zhang J, Refrégier G, Panaiotov S, Bachi-yska E, Sola C.2012. Spoligoriftyping, a dual-priming-oligonucleotide-based direct-hybridization assay for tuberculosis control with a multiana-lyte microbead-based hybridization system. J. Clin. Microbiol.50:3172– 3179.http://dx.doi.org/10.1128/JCM.00976-12.
6.Gomgnimbou MK, Hernández-Neuta I, Panaiotov S, Bachiyska E, Palomino JC, Martin A, del Portillo P, Refregier G, Sola C. 2013. Tuberculosis-spoligo-rifampin-isoniazid typing: an all-in-one assay tech-nique for surveillance and control of multidrug-resistant tuberculosis on Luminex devices. J. Clin. Microbiol.51:3527–3534.http://dx.doi.org/10 .1128/JCM.01523-13.
7.Shi XC, Liu XQ, Xie XL, Xu YC, Zhao ZX.2012. Gene chip array for differentiation of mycobacterial species and detection of drug resistance. Chin. Med. J. (Engl.)125:3292–3297.http://www.cmj.org/ch/reader/view _abstract.aspx?volume⫽125&issue⫽18&start_page⫽3292.
8.Tang X, Morrix SL, Langone JJ, Bockstahler LE.2005. Microarray and allele specific PCR detection of point mutations inMycobacterium tuber-culosisgenes associated with drug resistance. J. Microbiol. Methods63:
318 –330.http://dx.doi.org/10.1016/j.mimet.2005.04.026.
9.Troesch A, Nguyen H, Miyada CG, Desvarenne S, Gingeras TR, Kaplan PM, Cros P, Mabilat C.1999.Mycobacteriumspecies identification and rifampin resistance testing with high-density DNA probe arrays. J. Clin. Microbiol.37:49 –55.
10. Volokhov DV, Chizhikov VE, Denkin S, Zhang Y. 2009. Molecular detection of drug-resistantMycobacterium tuberculosiswith a scanning-frame oligonucleotide microarray. Methods Mol. Biol.465:395– 417.http: //dx.doi.org/10.1007/978-1-59745-207-6_26.
11. Waddell S, Laing K, Senner C, Butcher P.2008. Microarray analysis of defined
Mycobacterium tuberculosispopulations using RNA amplification strate-gies. BMC Genomics9:94.http://dx.doi.org/10.1186/1471-2164-9-94. 12. Yao C, Zhu T, Li Y, Zhang L, Zhang B, Huang J, Fu W. 2010.
Detection ofrpoB,katGandinhAgene mutations inMycobacterium tuberculosisclinical isolates from Chongqing as determined by microarray. Clin. Microbiol. Infect.16:1639 –1643.http://dx.doi.org/10.1111/j.1469 -0691.2010.03267.x.
13. Draghici S, Khatri P, Eklund AC, Szallasi Z. 2006. Reliability and reproducibility issues in DNA microarray measurements. Trends Genet.
22:101–109.http://dx.doi.org/10.1016/j.tig.2005.12.005.
14. Shi L, Tong W, Goodsaid FM, Frueh FW, Fang H, Han T, Fuscoe JC, Casciano DA.2004. QA/QC: challenges and pitfalls facing the microarray community and regulatory agencies. Exp. Rev. Mol. Diagn.4:761–777.
http://dx.doi.org/10.1586/14737159.4.6.761.
15. Yauk CL, Berndt ML.2007. Review of the literature examining the cor-relation among DNA microarray technologies. Environ. Mol. Mutagen.
48:380 –394.http://dx.doi.org/10.1002/em.20290.
16. Jordan BR.2010. Is there a niche for DNA microarrays in molecular diagnostics? Expert Rev. Mol. Diagn.10:875– 882.http://dx.doi.org/10 .1586/erm.10.74.
17. Chandler DP, Bryant L, Griesemer SB, Gu R, Knickerbocker C, Kukhtin A, Parker J, Zimmerman C, St George K, Cooney CG.2012. Integrated amplification microarrays for infectious disease diagnostics. Microarrays
1:107–124.http://dx.doi.org/10.3390/microarrays1030107.
18. Cooney CG, Sipes D, Thakore N, Holmberg R, Belgrader P.2012. A plastic, disposable microfluidic flow cell for coupled on-chip PCR and
on May 16, 2020 by guest
http://jcm.asm.org/
microarray detection of infectious agents. Biomed. Microdevices14:45– 53.http://dx.doi.org/10.1007/s10544-011-9584-9.
19. Vincent V, Rigouts L, Nduwamahoro E, Holmes B, Cunningham J, Guillerm M, Nathanson CM, Moussy F, De Jong B, Portaels F, Ramsay A.2012. The TDR Tuberculosis Strain Bank: a resource for basic science, tool development and diagnostic services. Int. J. Tuberc. Lung Dis.16:24 – 31.http://dx.doi.org/10.5588/ijtld.11.0223.
20. Woods GL, Brown-Elliott BA, Conville PS, Desmond EP, Hall GS, Lin G, Pfyffer GE, Ridderhof JC, Siddiqi SH, Wallace RJ, Jr, Warren NG, Witebsky FG.2011. Susceptibility testing of mycobacteria, nocardiae, and other aerobic actinomycetes. Approved standard M24A2, 2nd ed, vol 31, no. 5. Clinical and Laboratory Standards Institute (CLSI), Wayne, PA. 21. Golova JB, Chernov BK, Perov AN, Reynolds J, Linger YL, Kukhtin A,
Chandler DP.2012. Non-volatile copolymer compositions for fabricating gel element microarrays. Anal. Biochem.421:526 –533.http://dx.doi.org /10.1016/j.ab.2011.09.028.
22. El-Hajj HH, Marras SAE, Tyagi S, Shashkina E, Kamboj M, Kiehn TE, Glickman MS, Kramer FR, Alland D.2009. Use of sloppy molecular beacon probes for identification of mycobacterial species. J. Clin. Micro-biol.47:1190 –1198.http://dx.doi.org/10.1128/JCM.02043-08.
23. Irwin PL, Nguyen LH, Chen CY.2010. The relationship between purely stochastic sampling error and the number of technical replicates used to estimate concentration at an extreme dilution. Anal. Bioanal. Chem.398:
895–903.http://dx.doi.org/10.1007/s00216-010-3967-2.
24. Zuker M.2003. Mfold web server for nucleic acid folding and hybridiza-tion predichybridiza-tion. Nucleic Acids Res.31:3406 –3415.http://dx.doi.org/10 .1093/nar/gkg595.
25. Lane S, Evermann J, Loge F, Call DR.2004. Amplicon secondary struc-ture prevents target hybridization to oligonucleotide microarrays. Bio-sens. Bioelectron.20:728 –735.http://dx.doi.org/10.1016/j.bios.2004.04 .014.
26. Wei T, Pearson MN, Armstrong K, Blohm D, Liu J.2012. Analysis of crucial factors resulting in microarray hybridization failure. Mol. Biosyst.
8:1325–1338.http://dx.doi.org/10.1039/c2mb05300d.
27. Comas I, Borrell S, Roetzer A, Rose G, Malla B, Kato-Maeda M, Galagan J, Niemann S, Gagneux S.2011. Whole-genome sequencing of rifampicin-resistantMycobacterium tuberculosisstrains identifies com-pensatory mutations in RNA polymerase genes. Nat. Genet.44:106 –110.
http://dx.doi.org/10.1038/ng.1038.
28. de Vos M, Müller B, Borrell S, Black P, van Helden P, Warren R, Gagneux S, Victor T.2013. Putative compensatory mutations in the rpoC gene of rifampicin-resistant Mycobacterium tuberculosis are associated with ongoing transmission. Antimicrob. Agents Chemother.57:827– 832.
http://dx.doi.org/10.1128/AAC.01541-12.
29. Müller B, Borrell S, Rose G, Gagneux S. 2013. The heterogeneous evolution of multidrug-resistantMycobacterium tuberculosis. Trends Genet.29:160 –169.http://dx.doi.org/10.1016/j.tig.2012.11.005. 30. Sun G, Luo T, Yang C, Dong X, Li J, Zhu Y, Zheng H, Tian W, Wang
S, Barry CE, III, Mei J, Gao Q.2012. Dynamic population changes in
Mycobacterium tuberculosisduring acquisition and fixation of drug resis-tance in patients. J. Infect. Dis.206:1724 –1733.http://dx.doi.org/10.1093 /infdis/jis601.
31. Van Rie A, Mellet K, John MA, Scott L, Page-Shipp L, Dansey H, Victor T, Warren R.2012. False-positive rifampicin resistance on Xpert® MTB/ RIF: case report and clinical implications. Int. J. Tuberc. Lung Dis.16:
206 –208.http://dx.doi.org/10.5588/ijtld.11.0395.
32. Williamson DA, Basu I, Bower J, Freeman JT, Henderson G, Roberts SA.
2012. An evaluation of the Xpert MTB/RIF assay and detection of false-positive rifampicin resistance inMycobacterium tuberculosis. Diagn. Micro-biol. Infect. Dis. 74:207–209. http://dx.doi.org/10.1016/j.diagmicrobio .2012.06.013.
33. Williamson DA, Roberts SA, Bower JE, Vaughan R, Newton S, Lowe O, Lewis CA, Freeman JT.2012. Clinical failures associated with rpoB mu-tations in phenotypically occult multidrug-resistantMycobacterium tuber-culosis. Int. J. Tuberc. Lung Dis.16:216 –220.http://dx.doi.org/10.5588 /ijtld.11.0178.
34. Arentz M, Sorensen B, Horne DJ, Walson JL.2013. Systematic review of the performance of rapid rifampicin resistance testing for drug-resistant tuberculosis. PLoS One8:e76533.http://dx.doi.org/10.1371/journal.pone .0076533.
35. Steingart KR, Sohn H, Schiller I, Kloda LA, Boehme CC, Pai M, Dendukuri N.2013. Xpert® MTB/RIF assay for pulmonary tuberculosis and rifampicin resistance in adults. Cochrane Database Syst. Rev.
1:CD009593.http://dx.doi.org/10.1002/14651858.CD009593.pub2. 36. Batz HG, Cooke GS, Reid SD.2011. Towards lab-free tuberculosis diagnosis.
Treatment Action Group, Stop TB Partnership, Imperial College London, and Médecins Sans Frontières.http://www.treatmentactiongroup.org/sites/g/files/g4 50272/f/tbpocdiafull.pdf.
37. Van Rie A, Page-Shipp L, Scott L, Sanne I, Stevens W.2011. Xpert® MTB/RIF for point-of-care diagnosis of TB in high-HIV burden, re-source-limited countries: hype or hope? Exp. Rev. Mol. Diagn.10:937.
http://dx.doi.org/10.1586/erm.10.67.
38. Alonso M, Palacios JJ, Herranz M, Penedo A, MenéndezA, Bouza E, Garcia de Viedma D. 2011. Isolation of Mycobacterium tuberculosis
strains with a silent mutation inrpoBleading to potential misassignment of resistance category. J. Clin. Microbiol.49:2688 –2690.http://dx.doi.org /10.1128/JCM.00659-11.
39. Van Deun A, Aung KJM, Bola V, Lebeke R, Hossain MA, de Rijk WB, Rigouts L, Gumusboga A, Torrea G, de Jong BC.2013. Rifampin drug resistance tests for tuberculosis: challenging the gold standard. J. Clin. Microbiol.51:2633–2640.http://dx.doi.org/10.1128/JCM.00553-13. 40. Linger YL, Kukhtin A, Golova J, Perov A, Qu P, Knickerbocker C,
Cooney CG, Chandler DP.2014. Demonstrating a multi-drug resistant
Mycobacterium tuberculosisamplification microarray. J. Vis. Exp.86:
e51256.http://dx.doi.org/10.3791/51256.