Unintrusive, Engaging, Simple Semantic
Mapping over Time
A thesis submitted to the
University of Dublin, Trinity College
for the degree of Doctor of Philosophy
Colm Conroy
Knowledge and Data Engineering Group (KDEG), Department of Computer Science,
Trinity College, Dublin
Supervisor: Dr. Declan O’Sullivan Co-Supervisor: Dr. David Lewis Assistant Supervisor: Dr. Rob Brennan
i
Declaration
I declare that this thesis has not been submitted as an exercise for a degree at this or any other university and it is entirely my own work.
I agree to deposit this thesis in the University’s open access institutional repository or allow the library to do so on my behalf, subject to Irish Copyright Legislation and Trinity College Library conditions of use and acknowledgement.
ii
Acknowledgements
Firstly, I would like to thank my supervisor Dr. Declan O’Sullivan for agreeing to supervise my research, for his guidance, support and insightful contributions to this research. I would also like to express my gratitude to Dr. Rob Brennan and Dr. Dave Lewis for their support and helpful contribution through the years. Additionally I would like to express my gratefulness to my colleagues in KDEG who have always been generous with their time. Furthermore I would like to acknowledge all the volunteers who have given their time to participate in the experiments of this thesis.
iii
Abstract
iv
Table of Contents
Declaration ... i
Acknowledgements ...ii
Abstract ... iii
Table of Contents ... iv
List of Figures ... xiv
List of Tables... xviii
1 Introduction ... 1
1.1 Motivation ... 1
1.2 Research Question ... 4
1.3 Objectives and Goals ... 5
1.4 Contribution ... 6
1.5 Technical Overview ... 7
1.5.1 Technical Approach ... 8
1.5.2 Evaluation Overview ... 8
1.5.3 Analysis Approach ... 9
1.5.4 Thesis Overview ... 10
2 State of the Art – Ontology Mapping ... 12
2.1 Overview of Ontology Mapping Problem ... 12
2.1.1 Motivating Example ... 13
2.1.2 Difficulty in Mapping ... 14
2.2 Ontology Matching Tools ... 16
2.3 Mapping Process ... 18
v
2.3.2 The COMA System ... 21
2.3.3 PROMPT... 22
2.3.4 CoGZ... 23
2.3.5 Summary ... 24
2.4 Ontology Mapping Tool User Interfaces ... 27
2.4.1 Chimaera ... 28
2.4.2 COMA++ ... 29
2.4.3 PROMPT... 30
2.4.4 AlViz ... 31
2.4.5 OLA (OWL Lite Alignment) ... 32
2.4.6 SMART ... 33
2.4.7 Schema Mapper ... 34
2.4.8 Roundtrip Ontology Authoring ... 35
2.4.9 Summary ... 36
2.5 Ontology Mapping Tools with User Support ... 37
2.5.1 Webscripter ... 38
2.5.2 Visualisation of Mappings ... 38
2.5.3 Incremental Schema Matching ... 39
2.5.4 CoGZ... 40
2.5.5 Community-Driven Ontology Mapping ... 42
2.5.6 Web Explanation for Semantic Heterogeneity Discovery ... 43
2.5.7 Formal Model for Ontology Mapping Creation ... 44
vi
2.5.9 Ontogame... 44
2.5.10 Dialogue-Based Interactive Semantic Meditation ... 45
2.5.11 Summary ... 45
2.6 User Interactions in Ontology Mapping Tools... 45
2.6.1 Button Press ... 46
2.6.2 Construct Lines ... 46
2.6.3 Enter Formulas ... 47
2.6.4 Data Grid ... 47
2.6.5 Structure Sentences ... 48
2.6.6 Tagging ... 48
2.7 User Evaluation of Mapping Tools ... 48
2.7.1 PROMPT User Study ... 48
2.7.2 PROMPT and Chimaera User Study ... 49
2.7.3 Visualisation Mapping User Study ... 49
2.7.4 Schema Mapper User Study... 50
2.7.5 CoGZ and PROMPT User Study ... 50
2.7.6 Summary ... 51
2.8 Requirements for Ordinary User ... 53
2.9 Summary ... 54
3 Mapping Tool User Experiment ... 55
3.1 Experiment design ... 55
3.2 Goals ... 58
3.3 The NL Prototype Mapping Tool... 58
vii
3.4.1 Participants ... 61
3.4.2 Materials ... 62
3.4.3 Procedure ... 62
3.4.4 Data Collection ... 63
3.4.5 Analysis method ... 64
3.5 Results ... 64
3.5.1 Efficiency ... 66
3.5.2 Effectiveness ... 67
3.5.3 User satisfaction ... 70
3.5.4 Observations ... 71
3.6 Analysis with respect to Goals ... 72
3.7 Overall Findings with respect to RO2 ... 74
3.7.1 <atural Language superior way of representing ontological information to ordinary users ... 74
3.7.2 A Question & Answer approach aids in mapping navigation ... 74
3.7.3 Confusion with certain ontological terms and candidate correspondences asked .. 75
3.7.4 Different question templates led to different answers ... 75
3.7.5 Users unaware of any added aid for mapping correspondences ... 76
3.8 Updated Requirements for Ordinary Users ... 76
3.9 Limitations of Experiment ... 79
3.10 Summary ... 80
4 Incremental Mapping Process ... 81
4.1 Traditional user mapping process ... 81
viii
4.3 Incremental Mapping Process ... 84
4.3.1 Schedule Mapping Task ... 86
4.3.2 Present Mapping Task ... 87
4.3.3 User Mapping Task Interaction ... 88
4.3.4 Evaluate Response ... 88
4.3.5 Mapping Logic ... 88
4.3.6 Update Ontology Model ... 89
4.3.7 User Preference/Feedback/Input ... 89
4.4 Process Comparison ... 89
4.5 Task Walkthrough ... 91
4.6 Summary ... 92
5 Tag-Based Mapping Tool ... 93
5.1 Design & Implementation ... 93
5.1.1 Requirements for Tag-Based Tool ... 93
5.1.2 Tag-Based Mapping Tool Design ... 94
5.1.3 Implementation Overview ... 96
5.1.4 Firefox Browser Extension Implementation ... 96
5.1.5 Mapping Server ... 101
5.1.6 Cognitive Support ... 106
5.1.7 Implementation Walkthrough ... 109
5.2 SportsFlows... 110
5.2.1 Scenario ... 111
5.2.2 Information Service Ontology... 112
ix
5.2.4 Mapping Incentives ... 114
5.3 Summary ... 116
6 Tag-Based Mapping Tool Experiment ... 118
6.1 Requirements for Evaluation ... 118
6.2 Study design ... 119
6.3 Hypotheses ... 121
6.4 Method ... 122
6.4.1 Participants ... 122
6.4.2 Materials ... 122
6.4.3 Procedure ... 123
6.4.4 Data Collection ... 124
6.4.5 Analysis Method ... 124
6.5 Evaluation ... 125
6.5.1 Efficiency ... 126
6.5.2 Effectiveness (Quality of Mapping) ... 127
6.5.3 Unintrusive ... 130
6.5.4 Engaging ... 134
6.5.5 Simple ... 137
6.6 Analysis with respect to Hypotheses ... 139
6.6.1 Mapping Performance of <on-Technical Users ... 140
6.6.2 Mapping Process Intrusiveness ... 141
6.6.3 Mapping Process Simplicity ... 141
6.6.4 Mapping Process Engagement ... 142
x
6.7.1 Tag-based mapping tool was unintrusive but disrupted ordinary users when they
were busy ... 143
6.7.2 Lack of engagement ... 143
6.7.3 Tagging interaction was simple to achieve for ordinary users ... 144
6.8 Updated Requirements for Ordinary Users ... 144
6.9 Limitations ... 146
6.10 Summary ... 146
7 Modification of Tag-Based Mapping Tool ... 148
7.1 The Updated Tag-Based Mapping Tool ... 148
7.1.1 Requirements for Tag-Based Mapping Tool ... 148
7.1.2 Updated Tag-Based Mapping Tool Design ... 150
7.1.3 Updated Implementation Overview ... 150
7.1.4 Firefox Browser Extension Implementation ... 151
7.1.5 Mapping Server ... 156
7.2 Updated SportsFlows ... 160
7.2.1 Updating Requirements for SportsFlows ... 160
7.2.2 Updated SportsFlows Design ... 161
7.2.3 Personal Ontology Generation Implementation ... 162
7.2.4 Personalisation of Sporting <ews ... 166
7.3 Summary ... 169
8 Updated Tag-Based Mapping Tool Evaluation ... 170
8.1 Requirements for Evaluation ... 170
8.2 Study design ... 171
xi
8.4 Method ... 174
8.4.1 Participants ... 174
8.4.2 Materials ... 175
8.4.3 Procedure ... 176
8.4.4 Data Collection ... 177
8.4.5 Analysis Approach ... 177
8.5 Evaluation ... 178
8.5.1 Efficiency ... 180
8.5.2 Effectiveness ... 181
8.5.3 Unintrusive ... 186
8.5.4 Engaging ... 190
8.5.5 Simple ... 193
8.6 Overall Conclusions ... 195
8.6.1 Mapping Performance of <on-Technical Users ... 196
8.6.2 Mapping Process Intrusiveness ... 196
8.6.3 Mapping Process Engagement ... 197
8.6.4 Mapping Process Simplicity ... 197
8.7 Limitations ... 198
8.8 Summary ... 199
9 Evaluation Summary ... 200
9.1 Efficiency ... 201
9.2 Effectiveness ... 203
9.3 Accessibility & Convenience ... 204
xii
9.3.2 Engaging ... 205
9.4 Simple ... 206
9.5 User Satisfaction ... 207
9.6 Summary ... 207
10 Conclusions ... 209
10.1 Research Objectives ... 209
10.1.1 Ordinary users mapping involvement ... 209
10.1.2 Mapping requirements for ordinary users ... 210
10.1.3 Incremental mapping process ... 211
10.1.4 Tag-based mapping tool ... 211
10.1.5 Evaluation ... 211
10.2 Contributions ... 213
10.2.1 Major Contribution: Mapping Approach for Ordinary Users ... 213
10.2.2 Minor Contribution: Incremental mapping process ... 214
10.2.3 Minor Contribution: Evaluation Approach for Mapping Tools ... 215
10.3 Future Work ... 216
10.3.1 Mapping evolution ... 216
10.3.2 Tag processing ... 217
10.3.3 User-Specific Mapping Tasks ... 218
10.3.4 Personalisation of Mapping Process ... 218
10.3.5 Use-Case for Mapping ... 219
10.4 Final Remarks ... 220
References ... 222
xiii
A.1 Experiment One ... 234
A.2 Experiment Two ... 235
A.3 Experiment Three ... 236
Appendix B ... 241
B.1 User Profile ... 241
B.2 Clarity of Questions ... 242
B.3 Clarity of Display of Information in Support of Questions ... 243
B.4 Comparison Questions Between Tools (NL prototype mapping tool & COMA++) .... 244
Appendix C ... 245
Appendix D ... 248
D.1 Pre-Questionnaire ... 248
D.2 Weekly Questionnaire ... 249
D.3 Final Questionnaire ... 250
D.4 The Initial Questions asked during the Interviews ... 252
Appendix E ... 253
Appendix F ... 254
F.1 Experience Section ... 254
F.2 Sports Interest Section (SUS Questionnaire) ... 254
F.3 Interest Refinement Task Section ... 256
F.4 SportsFlows Section ... 259
xiv
List of Figures
Figure 2-1: Example of partial portion of a mapping between Aberdeen University ontology and Manchester University ontology. Entities from both source and target ontology involved in the mapping are bounded by ellipses and correspondences are represented by the solid curved
arcs. ... 13
Figure 2-2: Classification of Ontology Mismatches [Klein 2001] ... 15
Figure 2-3: List of schema based matching approaches [Shvaiko 2004] ... 17
Figure 2-4: Overview of MAFRA framework [Maedche 2002] ... 20
Figure 2-5: The graphical user interface of MAFRA [Maedche 2002]... 21
Figure 2-6: Overview of COMA++ Architecture [Aumuller 2005] ... 22
Figure 2-7: PROMPT Algorithm overview [Noy 2003] ... 23
Figure 2-8: CoGZ mapping process [Falconer 2009] ... 24
Figure 2-9: Screenshot of Chimaera interface for merging two classes ... 29
Figure 2-10: Screenshot of COMA++ interface ... 30
Figure 2-11: Screenshot of list of candidate correspondences suggestions by PROMPT plug-in ... 31
Figure 2-12: Screenshot of AlViz plug-in while mapping two ontologies ... 32
Figure 2-13: Screenshot of OLA visualisation of OWL ontology ... 33
Figure 2-14: Screenshot of SMART interface ... 34
Figure 2-15: A Screenshot of Schema Mapper interface ... 35
Figure 2-16: Screenshot of Ontology represented in Natural Language by Roundtrip Ontology Authoring ... 36
Figure 2-17: A sample report of WebScripter [Yan 2003] ... 38
Figure 2-18: Screenshot of modified BizTalk interface [Robertson 2005] ... 39
xv
Figure 2-20: Theoretical framework for cognitive support in ontology mapping [Falconer
2009] ... 41
Figure 2-21: Screenshot of CoGZ interface [Falconer 2009] ... 42
Figure 2-22: Collaborative mapping process presented in [Zhdanova 2006] ... 43
Figure 2-23: Example of proof of a candidate correspondence [Shvaiko 2005] ... 44
Figure 2-24: Requirements for Mapping Approach and Tool for Ordinary Users ... 53
Figure 3-1: The NL prototype mapping tool user mapping interface ... 59
Figure 3-2: The NL prototype mapping tool overall interface ... 60
Figure 3-3: Mean Time for Mapping Tasks for User Groups ... 66
Figure 3-4: Time taken for mapping correspondences with Coma++ ... 67
Figure 3-5: Mean mapping precision for each user group ... 68
Figure 3-6: Mean mapping precision with COMA++ mapping tool ... 68
Figure 3-7: Mean Mapping recall for each user group ... 69
Figure 3-8: Mean mapping recall with COMA++ mapping tool ... 70
Figure 3-9: Updated Mapping Requirements for Ordinary Users ... 77
Figure 4-1: Specific Requirements for the Incremental Mapping Process ... 83
Figure 4-2: The Incremental Mapping Process ... 85
Figure 5-1: Specific Requirements for the Tag-Based Mapping Tool ... 94
Figure 5-2: UML architectural diagram of the Tag-Based Mapping Tool ... 95
Figure 5-3: Screenshot of the Firefox Browser Extension ... 98
Figure 5-4: Mapping Session Message Alert. ... 99
xvi
Figure 5-6: The taxonomy of categories. Mapping categories are the top level and bolded, the corresponding list of concept relation categories are the sub level and are in italic. The third
level represents the default relations used in the mapping tool. ... 103
Figure 5-7: The mapping category lifecycle of a correspondence ... 106
Figure 5-8: UML sequence diagram of Mapping Cycle ... 109
Figure 5-9: Architecture of SportsFlows ... 111
Figure 5-10: The ‘Concept interest’ Interface ... 114
Figure 5-11: Latest sport news story prompt is displayed in the bottom right hand corner of the browser. ... 115
Figure 5-12: Sport news story sidebar ... 116
Figure 6-1: Specific Requirements for the Evaluation of Tag-Based Mapping Tool ... 119
Figure 6-2: Mean mapping task time for User Groups ... 127
Figure 6-3: Mapping precision of correspondences mapped with suggested relations for User Groups ... 128
Figure 6-4: Mapping Session Prompts Results for User Groups ... 132
Figure 6-5: Percentage of the correspondences mapped for the User Groups ... 133
Figure 6-6: Breakdown of mapping sessions entered for User Groups ... 136
Figure 6-7: Updated Mapping Requirements for Ordinary Users ... 145
Figure 7-1: Specific Requirements for updating the Tag-Based Mapping Tool ... 149
Figure 7-2: High Level Architecture Overview of Tag-Based Mapping Tool ... 150
Figure 7-3: Screenshot of the Mapping Interface of the Tag-Based Mapping Tool ... 152
Figure 7-4: Pseudo-code for Selection of Candidate Correspondence ... 154
Figure 7-5: Tag-Based Mapping Tool Mapping Task Prompt ... 155
Figure 7-6: The Tag-Based Mapping Tool user mapping interface ... 156
xvii
Figure 7-8: Mapping Category Cycle of Correspondences ... 159
Figure 7-9: Specific Requirements for updating SportsFlows ... 160
Figure 7-10: Overall architecture of SportsFlows ... 162
Figure 7-11: Add Sport as an interest in SportsFlows ... 163
Figure 7-12: Add interests to sports in SportsFlows. Red circle highlights the list of interests for the sport. ... 164
Figure 7-13: The remote DBpedia SPARQL query ... 165
Figure 7-14: Latest sport news story prompt, displayed in the bottom right-hand corner of the Firefox browser ... 168
Figure 7-15: The sport news story sidebar, highlighted with a red circle ... 169
Figure 8-1: Specific Requirements for the Evaluation of the Tag-Based Mapping Tool ... 171
Figure 8-2: Mean time for Mapping Task ... 181
Figure 8-3: Mapping precision results for user groups ... 183
Figure 8-4: Breakdown of correspondences mapped with user-defined relations ... 186
Figure 8-5: Mapping tasks entered results for each user group ... 187
Figure 8-6: Survey results for ignored mapping tasks ... 188
Figure 8-7: Mapping tasks answered results for each user group ... 191
xviii
List of Tables
Table 1-1: Thesis evaluation outline ... 9
Table 2-1: Overview of Selected Mapping Systems ... 19
Table 2-2: Comparison between Selected Mapping Systems ... 25
Table 2-3: List of User-Specific Mapping Tasks ... 26
Table 2-4: Comparison of User Mapping Interfaces ... 37
Table 2-5: Types of Interaction that are/can be used in Mapping Tools ... 46
Table 2-6: Summary of evaluation methods in mapping tool user studies... 51
Table 2-7: Summary of Mapping Tool Evaluation Areas ... 52
Table 3-1: Experiment evaluation outline with current experiment (1) highlighted ... 57
Table 3-2: Participant experimentation order, -- indicates there is no value in the cell. ... 63
Table 3-3: Overall mapping results for the user groups. ... 65
Table 3-4: Comments from participants on difficulty of mapping with tools ... 70
Table 3-5: Comments from participants on interfaces of mapping tools ... 71
Table 3-6: Comments from participants on difficulty of mapping with tools ... 71
Table 3-7: Summary of the Analysis of Goals ... 72
Table 4-1: Comparison of User Mapping Tasks for each Process ... 90
Table 4-2: Comparison between mapping process ... 91
Table 5-1: Theoretical Framework for Cognitive Support ... 107
Table 6-1: Experiment evaluation outline with current experiment (2) highlighted ... 120
Table 6-2: Overall mapping results for each user group. A double dash, --, indicates there is no value in the cell. ... 126
xix
Table 7-1: Priorities of mapping browsing context ... 153
Table 8-1: Experiment evaluation outline with current experiment (3) highlighted ... 172
Table 8-2: Overall mapping results of Non-Technical and Ontologically Aware user groups. A double dash, --, indicates there is no value in the cell. ... 179
Table 8-3: Overall mapping results of Technically Aware and Others user groups. A double dash, --, indicates there is no value in the cell. ... 180
Table 8-4: Summary of the Analysis of the Hypothesises... 195
Table 9-1: Thesis evaluation outline ... 201
Table A-1:Experiment one – The comparison of the time taken to map with COMA++. ... 234
Table A-2:Experiment one – The comparison of the time taken to map with the NL prototype mapping tool. ... 234
Table A-3: Experiment one – The comparison of the mapping precision achieved with COMA++. ... 235
Table A-4:Experiment one – The comparison of the mapping precision achieved with the NL prototype mapping tool. ... 235
Table A-5: Experiment two – The comparison of the time taken to map with the tag-based mapping tool. ... 235
Table A-6:Experiment two – The comparison of the mapping precision achieved with the tag-based mapping tool. ... 235
Table A-7: Experiment two – The comparison of the mapping session prompts entered and finished with the tag-based mapping tool. ... 236
Table A-8:Experiment three – The comparison of the mapping results for the Non-Technical user group and the Ontologically Aware user group with the updated tag-based mapping tool. ... 236
xx
Table A-10: Experiment three – The comparison of the first half of the experiment results against the second half of the experiment results for the Non-Technical user group using a paired two-tailed t-Test. ... 237
Table A-11: Experiment three – The comparison of Non-Technical user group experiment results with the the standard set in the previous experiment using a one-sample t-test. ... 238
Table A-12: Experiment three – Comparison of the unintrusive questionnaire results using Mann-Whitney test. ... 238
Table A-13: Experiment three – Comparison of the appropriate stories questionnaire results using Mann-Whitney test. ... 239
Table A-14: Experiment three – Comparison of the mapping benefits questionnaire results using Mann-Whitney test. ... 239
1
1 Introduction
1.1 Motivation
Semantic mapping1 [Kalfoglou 2003] is a solution to the semantic interoperability problem2 [Heflin 2000], where information needs to be exchanged between two sources with different underlying semantic models3. Semantic mappings allow data to be consistently interpreted with different semantic models. Fully automatic mapping has been considered impracticable as indicated in [Noy 2004] which has led to the requirement for user input in the mapping process and has been asserted in [Falconer 2009] [Shvaiko 2008]. Traditionally, knowledge engineers have predominately been assumed to be responsible for bridging the semantic models by creating mappings. However, there has been a substantial increase in the number of semantic models published on the web of Linked Data4. Furthermore as the number of Internet users and the number of accessible Web pages grows, it is becoming increasingly more difficult for users to find information that are relevant to their particular needs. This has led to the requirement of personalised systems [Gauch 2003] with personal semantic models to support the user’s needs, which has been stated in [Huhns 2002]. For a truly scalable solution to wide-scale semantic interoperability, it is argued in this thesis that knowledge engineers alone will be insufficient as the volume of mapping tasks will be too much for such a small cohort of skilled people alone. In addition, for data integration to occur between two companies a mapping will need to be developed and this task is typically carried out by a knowledge engineer or person who has received substantial training. Unfortunately these users generally have insufficient domain knowledge which is crucial for the task and will require the involvement of a domain expert from the company for each domain being mapped. This leads to one of the most time consuming data management problems, asserted in [Falconer 2009]. However this problem can be simplified if the domain experts themselves are empowered to carry out the task for their own domain. The motivation for this thesis was thus to identify a way for people who use mappings, to participate themselves in the creation of mappings between semantic models that are relevant to them. This creates a challenge because the people who use mappings may only
1
Semantic mapping is the process of finding correspondences between semantic models, see section 2.1 2
Semantic Interoperability requires that any two computer systems will derive the same inferences from the same information.
3
A Semantic model is a conceptual data model used to describe the meaning of data 4
2
have basic computing skills and thus will not have the technical skills that are assumed in the majority of current mapping tools.
Current semantic mapping tools typically require a high level of technical expertise which limits the users of the tools to knowledge engineers or users who have received substantial training, stated in [Falconer 2009]. Recently, the need for more general user support has been highlighted as a key challenge in semantic mapping [Shvaiko 2008]. Nonetheless little research has been undertaken on enriching user support, asserted in [Jameson 2006]. In fact, any published ontology mapping research on enriching user support has been aimed at improving the experience for knowledge engineers with a high level of technical expertise, an example is [Falconer 2007]. To allow people who use mappings themselves to interact in the semantic mapping process, it is argued in this thesis that the design foci for semantic mapping tools needs to shift to people who only have basic computing experience, denoted as ordinary users in this thesis.
It is also argued in this thesis that semantic mapping is not a “one-shot” process and that mappings need to be developed and refined over time which would require regular involvement of users in the process. In the author’s opinion, the mapping process needs to be modified to allow the act of mapping to occur over time within the users own computing environment. A motivation for such a long term process and continuous user involvement is the use case of "personal information delivery". Personal information delivery involves the push of content from information streams on the web to users based on their interests. Mappings are used to personalise the content pushed to the user. For example if a person named John had an interest in football, modelled within his personal semantic model, then mappings would be constructed to semantic models representing sporting information streams, e.g. the BBC sport news RSS feed5. The resulting mappings would be used to personalise the sporting information from the streams by only delivering sporting news relating to football to John. The traditional mapping approach where knowledge engineers alone are involved in the mapping process is thus impracticable in this use case due to the volume of mapping tasks needed6. In addition, the user’s interests may change over time which would require the mapping to be continually refined.
A further scenario for such a process is biomedical science. The number of biomedical resources available to researchers is enormous. This causes a problem when the medical
5
http://newsrss.bbc.co.uk/rss/sportonline_world_edition/front_page/rss.xml 6
Over 3.4 million unique people visited the BBC sport news page during the world cup in 2006 which could lead to over 3.4 million mappings being required, see
3
literature is searched due to the large volume of documents retrieved. Using the system described would allow users to partially map documents together 'on the fly' as needed rather than the time-consuming method of mapping the entire documents together. Furthermore the process allows the mapping to be continually refined as the documents are modified.
As stated before, the majority of current mapping tools typically require a high level of technical expertise which limits the users of the tools to knowledge engineers or users who have received substantial training. Disruptive innovation allows services to be opened up to non-consumers by reducing the obstacles attached to the service [Christensen 1998]. In particular, often disruptive innovation makes the product much simpler, more convenient and more accessible as asserted by Anthony [Anthony 2008]. For examples, the Nintendo Wii allowed a new generation of gamers to be born through intuitive controls making playing games simpler and more accessible, whilst Google Ads made advertising on the web accessible to anyone7. In the author’s opinion, to allow ordinary users to participate in the semantic mapping process the service itself, i.e. the act of mapping, must follow this approach and become much simpler,
more convenient and more accessible.
The semantic mapping process can be extremely difficult, requiring tremendous patience and an expert understanding of the domain, terminology, and semantics as stated by Falconer [Falconer 2007]. The current state of the art mapping tools have interfaces that quickly become unmanageable due to the clutter of irrelevant and relevant information, even for knowledge engineers as asserted in [Robertson 2005] [Falconer 2009]. To simplify the semantic mapping process the time spent and the amount of effort the user expends will need to be dramatically reduced. The interfaces of semantic mapping tools will also need to be enhanced to allow ordinary users to use them. In particular, the usability needs to be significantly improved. Usability is:
The extent to which a product can be used by specified users to achieve specified goals with effectiveness, efficiency, and satisfaction in a specified context of use. (ISO 9241-11)
In the definition effectiveness means that the goal was accomplished by the user adequately, efficiency means that the goal was accomplished by the user with a minimum expenditure of time and effort, and satisfaction discovers what people think and feel about using a product, to assess the perceived quality of use.
7
4
Current mapping tools are standalone applications and require users to open the tool and develop mappings whenever they are needed. Such a process will not be accessible or
convenient for ordinary users as it requires users themselves to know when mappings are needed and to enter the tool of their own accord, which may not happen. Instead the mapping process needs to be seamlessly integrated into the ordinary users computing environment
so that mapping tasks are highlighted and displayed to users when required as they occur naturally over time. This gives rise to the requirement that both the process and tool be non-intrusive and not disrupt users in their daily work. It also requires users to be constantly involved or engaged in the process over time.
In summary, contrary to the existing research trend which presupposes only knowledge engineers will be involved in the semantic mapping process, it is argued that the users of mappings need to be actively included in the semantic mapping process. This realisation comes from the need that in its current form, the semantic mapping process, which relies on the availability of knowledge engineers, will not scale to the World Wide Web as the propagation of semantic models continues to increase. This proliferation will lead to an increase in the volume of mappings needed. However the current mapping processes and state of the art mappings tools are extremely complex and can even be unmanageable for knowledge engineers. This leads to the question of how can the mapping process and tools be made accessible, convenient and usable for ordinary users?
1.2 Research Question
The research question posed in this thesis is:
How can the act of semantic mapping become accessible, convenient, simple, effective, efficient and more satisfactory for ordinary users to achieve semantic mappings gradually and over time between semantic models of interest to the user?
5
term used to describe a task as not being complicated or easy to achieve. In the research question, simple requires that the goal of generating mapping will be easy to accomplish for ordinary users. Effective is a term used to explain that a purpose was accomplished adequately or produced the intended result. In the research question, effective requires that the goal of constructing mappings was accomplished by ordinary users sufficiently. Efficient is a term used to describe that a task was performed in the best possible manner with the least waste of time and effort. In this research question, efficient requires that generation of mappings was accomplished by ordinary users with a minimum expenditure of time and effort. Satisfactory is a term used to explain that the task was suitable or acceptable. In the research question, satisfactory requires that ordinary users perceived the task of constructing mapping to be acceptable.
The semantic models used in the thesis are OWL DL ontologies8. OWL ontologies were chosen as they are more complex than other types of semantic models and thus may be harder for ordinary users to understand which would make the act of mapping more complex for ordinary users. Examples of other semantic models are folksonomies [Vander der Wal 2007] and linked data [Bizer 2009]. In addition, many of the problems inherent in the ontology domain are consistent across other semantic model domains, see section 2.1.1.2. This allows for the approach proposed in this thesis to be applicable to mapping with other semantic model formats. The mapping use-case studied is restricted to one-to-one concept mappings as it is the most common use case used currently in the semantic mapping research community, see section 2.1.7.
1.3 Objectives and Goals
In order to investigate the research question the following objectives were derived:
RO1: Determine whether ordinary users can actively participate in the construction of semantic mappings to a similar standard as knowledge engineers in areas of interest to the ordinary users;
RO2: Determine the parts of the semantic mapping process which are difficult for ordinary usersand identify techniques to reduce the difficulty of these parts;
RO3: Develop a mapping process that will aid ordinary users in the act of mapping over time, called the incremental mapping process;
8
6
RO4: Develop a tool that is based on the incremental mapping process from RO3 and the techniques identified in RO2;
RO5: Evaluate the tool with ordinary users over a long term period (at least 2 weeks and up to 5 weeks).
Although two to five weeks maybe perceived as a short term period, in the author’s opinion, it will give a snapshot of the long term behaviour of the user with the developed mapping tool. Furthermore there is no formal definition in mapping for what a long term period is and there has been no user study conducted on mapping tools over time to give a basis on what to judge a long term period as.
1.4 Contribution
The major contribution of this thesis is the development of an approach which allows the act of mapping to become accessible, convenient, simple, effective, efficient and satisfactory for ordinary users. As mentioned in section 1.1 this type of approach is lacking in the state of the art. This approach includes discovering the mapping requirements needed for ordinary users to participate in the mapping process and identifying both the techniques and methods to solve these requirements. Such identification has not been carried out by the state of the art. Additionally an incremental mapping process is designed to allow the act of mapping to occur over time and an implementation of the process is used in the approach to reduce the workload of the mapping process. A mapping process tailored for ordinary users is lacking in the state of the art. The approach is implemented in a mapping tool called the tag-based mapping tool which is developed using the incremental mapping process and both the techniques and methods identified to solve the requirements. The tag-based mapping tool was evaluated and the results indicated that the approach allows the act of mapping to become accessible, convenient, simple, effective, efficient and satisfactory for ordinary users. The approach and the ideas for the approach have been published at [Conroy 2007] [Conroy 2008a] [Conroy 2008b] [Conroy 2008c] [Lanzenberger 2008] [Conroy 2009].
7
incrementally over time within the user’s computing environment. This process is independent from the mapping approach taken in this thesis and can be used for different mapping approaches, e.g. supporting the participation of knowledge engineers over time. In addition the process is designed to allow the number of user-specific mapping tasks to be reduced. Furthermore it also is designed to support users during these user-specific mapping tasks and identifies key points of user interaction during the task. Such clear identification, separation and support of user interactions are currently lacking in the state of the art and are needed if the usability of mapping tools is to be improved. Finally the process also identifies and highlights where personalisation can occur in the mapping process.
The second minor contribution of this thesis is the formulation of an approach to evaluate the user’s participation with mapping tools within their own computing environment over time. This evaluation approach is used to analyse the behaviour and experiences of users using the tag-based mapping tool and can also be used on other mapping tools. Such an evaluation approach is currently lacking in the state of the art. The current state of the art research have conducted few user studies on mapping tools with [Lambrix 2003] and [Falconer 2009] being a couple of examples of user studies carried out. Furthermore, the focus of evaluation in these studies has been on the mappings made by the tools using the standard precision and recall measures rather than assessing the users’ experience. The methodologies presented in this thesis, presented at [Conroy 2009], are centred on evaluating whether the act of mapping with a mapping tool is accessible, convenient, simple, effective, efficient and satisfactory for users. In addition the few user studies carried out by the state of the art have primarily been done in laboratory settings. However there is a need to evaluate mapping tools in real world case studies to analyse the user behaviour with the tool within their own computing environment. The evaluation approach included the design and implementation of a personalisation application, which uses the based mapping tool, to replicate a real world situation. This allowed the tag-based mapping tool to be evaluated in a real world situation with the users.
1.5 Technical Overview
8
1.5.1 Technical Approach
An initial study on the state of the art in the area of semantic mapping was conducted, which concentrated on the role of the user within the mapping process, in particular focussing on both the user interaction and visualisation of information. This literature review was supplemented with an initial user mapping experiment, due to the lack of user mapping studies carried out in the state of the art, which was designed to identify the practical user interaction issues. This involved contrasting the issues that two different mapping systems had on three different groups of users, each group having different levels of technology expertise reflecting the different types people can have. The initial experiment and literature investigation helped in the formation of an understanding of the issues involved in the user’s role in the semantic mapping process. Based on the state of the art analysis and experience gained through the initial user mapping experiment, an incremental mapping process and software mapping tool were designed. The mapping tool developed was called the tag-based mapping tool. The incremental mapping process was designed to focus on reducing the work load and difficulty in the act of mapping for users.
Two further sequential experiments were used to evaluate various aspects of the incremental mapping process and tag-based mapping tool. Examples include how the ontological information should be displayed and when mapping tasks can be prompted. For these experiments the tag-based mapping tool was designed to be embedded within the user’s own browser environment. The first experiment evaluated using a time-interval approach to display mapping tasks. The second experiment evaluated the impact of using a context-sensitive approach to display mapping tasks as well as several other changes made to the tool as a result of the evaluation of the previous experiment, for example only asking mapping tasks relating to the users interests. The modification to a context-sensitive approach was made to analyse if there was any change in the participation of ordinary users in the mapping process from using a time-interval approach.
1.5.2 Evaluation Overview
9
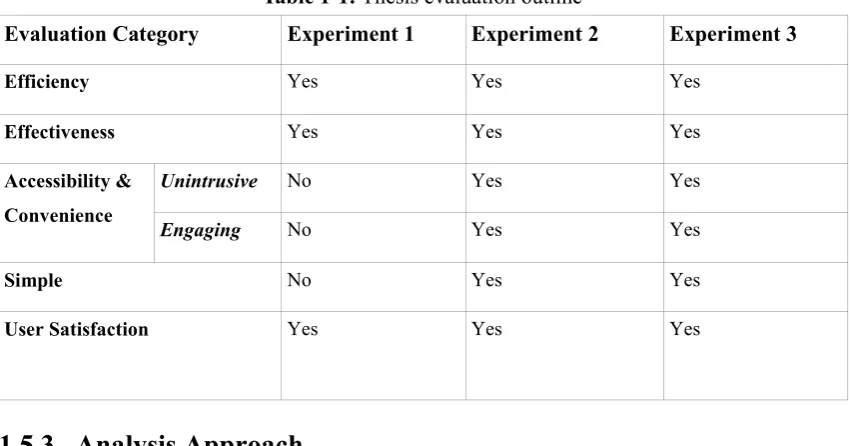
[image:31.595.100.526.261.484.2]while the effectiveness is measured by the accuracy of the tasks with the tool. The simplicity is measured by how easy it is for users to complete the act of mapping. For the act of mapping to be both accessible and convenient it needs: the process to be non-invasive to the user as they are carrying out their daily work as the work may be voluntary, making it important not to disrupt the user, and engaging enough so that the user will want to interact in the mapping process. Thus the evaluation categories used to measure accessible and convenience are unintrusive and engaging. The user satisfaction is evaluated through questionnaires and interviews with the users. The questions asked also supplement the evaluation of the unintrusive, engaging and simple categories. Table 1-1 lists how each experiment is evaluated.
Table 1-1: Thesis evaluation outline
Evaluation Category Experiment 1 Experiment 2 Experiment 3
Efficiency Yes Yes Yes
Effectiveness Yes Yes Yes
Accessibility & Convenience
Unintrusive No Yes Yes
Engaging No Yes Yes
Simple No Yes Yes
User Satisfaction Yes Yes Yes
1.5.3 Analysis Approach
Both quantitative and qualitative analysis was undertaken in each experiment. The following statistical tests were chosen after consultation with a statistician:
• Mann-Whitney U test [Crichton 2000]: This is a non-parametric test used to assess whether two independent samples of observations have equally large values. This test was used to measure the responses of the same questionnaire from different experiments. This test is used in experiment three to evaluate if the questionnaire responses of users were different to the responses given by the users in experiment two. • Unpaired two-tailed t-test [O’Connor 2003] [Ruxton 2006]: This is a two sample
10
used to measure the differences in mapping results, e.g. mapping precision, between users with different technology experience. This test is used in each of the experiments to compare the mapping performances between the different user groups.
• One-sample t-test [O’Connor 2003]: This is a one-sample location test of whether the mean of a normally distributed population has specific value to the null hypothesis. This test was used to measure the mapping results against a standard. This test is used in experiment three to evaluate if the mapping performance of users was different to the standard set by the users in experiment two.
• Paired two-tailed t-test [O’Connor 2003]: This is a test of the null hypothesis that the difference between two responses measured on the same statistical unit has a mean value of zero. This test was used to evaluate whether the mapping results for users improved over time. This test is used in experiment two and three to evaluate if the mapping performance of users changed over time.
• Slope t-test [O’Connor 2003]: This test is used to evaluate whether the slope of a regression line differs significantly from 0. This test was again used to evaluate whether the mapping results improved over time. This test is used in experiment three to evaluate if the mapping performance of users changed over time.
For the tests the significant level was chosen as α = 0.05, as it is conventionally used as the level of significance in statistical tests [Fisher 1925]. Also, any outliers from the data set that were more than two standard deviations away from the mean were eliminated to reduce the inflated error rates [Osborne 2004]. In particular, triangulation [Creswell 2003] is used to validate emergent themes, i.e. conclusions from the evaluations. This involves verifying that the themes are present in the multiple experiments carried out. This provides justification and evidence that the theme is a consistent usage pattern across a population of users. The analysis of the experiments supported the claim ordinary users can interact in the mapping process using the tag-based mapping tool.
1.5.4 Thesis Overview
Chapter Two provides a review and analysis of the state of the art in ontology mapping, with particular focus on the role of the user.
11
Chapter Four presents the design of the incremental mapping process. A summary of the process is provided including detail description of each key interaction step within the process. Chapter Five describes the implementation of the tag-based mapping tool based on the incremental mapping tool developed and a personal information delivery tool, SportsFlows, which uses the tag-based mapping tool to personalise sporting information for users.
Chapter Six presents the second of our experiments. The experiment required users to use the personal information delivery tool, SportsFlows, presented in the previous chapter. The experiment focused on evaluating the accessibility, convenience and usability of the mapping tool within the browser environment of three different groups of users with different expertise. Chapter Seven describes the improvements made to the tag-based mapping tool and the personal information tool SportsFlows based on the conclusions from the previous experiment. Chapter Eight presents the final experiment. The experiment was a final evaluation on the accessibility, convenience and usability of the process and tool constructed in this thesis. Chapter Nine gives an overview of the entire evaluation carried out in this thesis and describes if the objective of the research question in this thesis was achieved. In particular it describes how the objectives of each experiment were evaluated and discusses the conclusions from the experiments.
Chapter Ten discusses the contributions made, presents suggestions for future work, and concludes with some final remarks.
Appendix A contains the complete results for the statistical tests of the experiments.
Appendix B displays the interview questionnaire used in the first experiment, see section 3.4. Appendix C gives the list of added labels for each concept in the sports news ontology used in the SportsFlows applications, see section 5.2.
Appendix D presents the questionnaires used in the second experiment, see section 6.4.
Appendix E contains the email used in recruitment of the participants for the third experiment, see section 8.4.
12
2 State of the Art – Ontology Mapping
This chapter presents a summary of the state of the art in ontology mapping. In particular the emphasis is examining research carried out regarding the involvement by users in mapping activities. First an overview of the ontology mapping problem is described together with a motivating example and a discussion of the difficulties in mapping. Then an overview of ontology matching tools is presented focussing on the different types of algorithms that can be used. Next, the literature on mapping processes is discussed with an emphasis on evaluating where user input is required. Subsequently, current state of the art mapping tools are detailed highlighting the different types of user interfaces supported. Afterwards, recent research on adding user support to mapping tools is outlined. After that, a summary of the different types of interactions mapping tools can use is given. This is then followed by an overview of the techniques and approaches for user evaluation of mapping tools. Finally, requirements needed for ordinary users to use mapping process and tools are presented.
2.1 Overview of Ontology Mapping Problem
13
2.1.1 Motivating Example
Figure 2-1 shows a snapshot of a partial mapping between two ontologies. On the left is the source ontology which is a partial branch of the university ontology for the University of Aberdeen [Aberdeen 2003]. On the right is the target ontology which is a partial branch of the university ontology for the University of Manchester [Manchester 2003]. The ontologies are provided in the accompanying DVD media under SOA.
Figure 2-1: Example of partial portion of a mapping between Aberdeen University ontology and Manchester University ontology. Entities from both source and target ontology involved in the mapping are bounded by ellipses and correspondences are represented by the solid curved arcs.
The ontologies are both modelled as a different structure and uses a different vocabulary to represent similar information. This difference can be due to both the differing needs of each ontology and the fact that different people, who would have differing views [Lewotin 1982],
[image:35.595.124.511.221.588.2]14
were used to build each ontology. An example of two entities which use different vocabulary but model similar information is ‘System-Administrator’ from the Aberdeen ontology and ‘TechnicalStaff’ from the Manchester ontology. The two ontologies also contain many of the same concepts but the concepts are sometimes represented differently, for example ‘PhD Student’ is represented differently in both ontologies. The Aberdeen ontology represents ‘PhD Student’ as a sub class of ‘Student’ with the properties has-supervisor, studies-at and has-affiliation. While the Manchester ontology represents ‘PhD Student’ as a sub class of ‘Student’ with the property supervisor. Both concepts have different properties and the different class based structure, ‘Student’ is a sub class of ‘Affiliated-Person’ in the Aberdeen ontology but is not in the Manchester ontology. This heterogeneity causes problems when information needs to be shared or exchanged. To resolve this semantic interoperability problem, a mapping needs to be constructed between the two ontologies. However, developing a mapping is a difficult process.
2.1.2 Difficulty in Mapping
The study of mapping problems is not new in computer science and has been persistent through various different areas from theoretical computing [Hertling 1999] to the database community [Konstantinou 2008]. In fact people deal with mapping problems everyday with examples being both reading and interpreting our surroundings. Ontology mapping is closely related to the mapping problems we encounter every day, i.e. mapping one person’s view of the world to another person’s view of the world. However, ontologies are quite limited when expressing representations as they are based on the classical view of categories [Murphy 2002]. This classical view has three main claims: first that concepts are mentally represented definitions which provide the necessary conditions for membership in this category, second that every object is either in or not in a category, and finally that each member of a category is equally good, that is, a member cannot be a more typical member than another member.
15
context of use [Bernstein 2007]. Without knowing the context of use for a concept it can be difficult to understand what is the meaning of the concept. For example ‘Football’ can have different meanings based on the perception of different cultures, e.g. in Europe against in USA. This is especially problematic in mapping as the context of both terms needs to be understood. Mismatches between ontologies are the key type of problem that hinders the combined use of independently developed ontologies [Klein 2001]. Figure 2-2 displays Klein’s classification for ontology mismatches.
Figure 2-2: Classification of Ontology Mismatches [Klein 2001]
16
terminological and encoding mismatches. As recognised by Klein [Klein 2001], it relies on human expertise to recognise ontology mismatches.
All these problems make mapping generation a very challenging problem. Despite significant research on the development of matching algorithms, it has become obvious that the user must accept a degree of imperfection [Gal 2005]. A couple of prime reasons for this is the enormous ambiguity and heterogeneity of concept descriptions of data [Gal 2006] and the description of a concept in a schema can be semantically misleading [Miller 2000]. This has lead to automatic mapping being seen as impracticable [Noy 2004] and there remaining a need for “a human to be in the loop” [Hull 1997] [Shvaiko 2008] [Falconer 2009].
2.2 Ontology Matching Tools
17
Figure 2-3: List of schema based matching approaches [Shvaiko 2004]
One of the most widely used methods for computing similarities is heuristic techniques applied to the schema or ontological description. Heuristics are generally applied in two different ways. First, they are applied to the labels in the ontologies to compute lexical similarity, for example similar concept names, and second, they are applied to the structure of the ontology to measure structural similarity between terms, for example similar hierarchical relationships. The majority of mapping algorithms are based on heuristic techniques and will often apply a hybrid approach of lexical similarity and structure similarity.
18
An additional matching approach is based on mapping ontologies to a standard data dictionary such as WordNet9 or UMLS (Unified Medical Language System)10. Using this technique, the data dictionary acts as a central ontology and ontologies will need to be mapped to this dictionary. The ontology can then be compared to the data dictionary and the most similar term in the data dictionary becomes the canonical representation of the ontology term. This approach has been used to extend ontology matching to the medical domain using UMLS [Shamdasani 2009].
A further matching approach is probabilistic mapping [Moulton 1993]. With this approach the concepts are mapped together with an associated probability and this probability is used to infer other correspondences between related concepts. An example of this approach is OMEN [Mitra 2005] that is a probabilistic ontology mapping tool which is dependent upon a set of meta-rules that express the influences of correspondences on the existence of other candidate correspondences across concepts in source ontologies that are located in the proximity of the correspondence.
There has been much research on examining and evaluating different types of matching algorithms across different domains [OAEI 2011]. Mapping tools generally included multiple matching algorithms to generate candidate correspondences.
2.3 Mapping Process
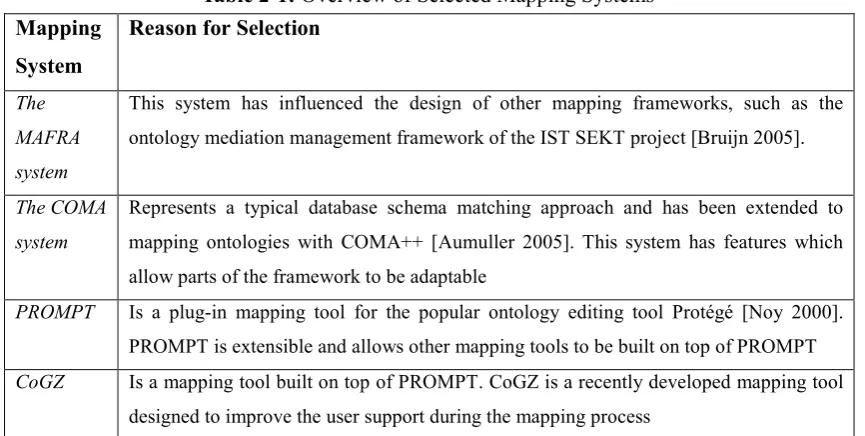
This section presents an examination of the mapping processes represented in current state of the art ontology mapping systems. Four ontology mapping systems were selected: the MAFRA system [Maedche 2002], the COMA system [Do 2002], PROMPT [Noy 2003] and CoGZ (Cognitive Support and Visualisation for Human-Guided Mapping Systems) [Falconer 2009]. The primary focus of this inspection was to identify the role of the user in the mapping process within each system. Each of the mapping systems is described in the sections below.
9
http://wordnet.princeton.edu/ 10
19
Table 2-1: Overview of Selected Mapping Systems
Mapping System
Reason for Selection
The
MAFRA
system
This system has influenced the design of other mapping frameworks, such as the
ontology mediation management framework of the IST SEKT project [Bruijn 2005].
The COMA
system
Represents a typical database schema matching approach and has been extended to
mapping ontologies with COMA++ [Aumuller 2005]. This system has features which
allow parts of the framework to be adaptable
PROMPT Is a plug-in mapping tool for the popular ontology editing tool Protégé [Noy 2000].
PROMPT is extensible and allows other mapping tools to be built on top of PROMPT
CoGZ Is a mapping tool built on top of PROMPT. CoGZ is a recently developed mapping tool
designed to improve the user support during the mapping process
2.3.1 The MAFRA System
20
Figure 2-4: Overview of MAFRA framework [Maedche 2002]
21
Figure 2-5: The graphical user interface of MAFRA [Maedche 2002]
The role of the user in the MAFRA system is to develop a mapping by validating the candidate correspondences suggested and appending any missed correspondence. There is no default navigation between candidate correspondences and it is left to the user to navigate this list themselves. The candidate correspondences are generated by a custom made matching algorithm. The MAFRA system does not allow for modification or replacement of the matching algorithm
2.3.2 The COMA System
22
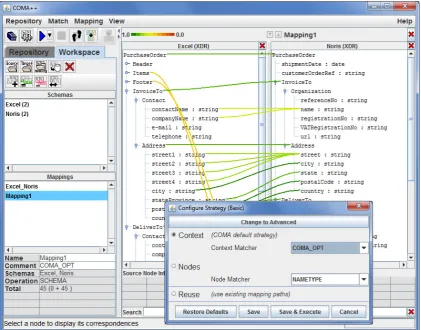
[image:44.595.82.487.129.411.2]features also include the addition of ontology matchers and a mechanism to reuse existing mapping results. The COMA++ architecture is shown in Figure 2-6.
Figure 2-6: Overview of COMA++ Architecture [Aumuller 2005]
The role of the users in COMA++ is to develop a mapping by validating candidate correspondences and appending any missed correspondences. There is no default navigation between candidate correspondences and it is left to the user to navigate this list themselves. The user can select the matching specific algorithms to use. The following is the process of user interaction with COMA++: (1) the user opens the tool, ontologies to be mapped and any partial mapping already constructed if available, (2) the user selects which matching algorithm(s) to use and modifies the parameters if required, (3) the user executes the matching algorithm and generates a set of candidate correspondences, (4) the user validates the candidate correspondences, (5) the user appends any missed correspondences, and (6) the user saves the mapping and closes the tool.
2.3.3 PROMPT
23
[image:45.595.218.399.247.437.2]class names and then loops through a series of steps: first the system takes one of the PROMPT suggestions and prompts it to the user, next the user validates the candidate correspondences, after which the system undertakes the operation involved in the validation, then the system automatically makes appropriate additional changes and finally updates the suggestions list accordingly. The role of the user is to validate the candidate correspondences suggested. The navigation of the suggestions is decided by the system, although users can choose to navigate the list of suggestions themselves. The series of suggestions continues until the user decides the mapping process has finished. Users can also append any missed correspondences with the tool.
Figure 2-7: PROMPT Algorithm overview [<oy 2003]
2.3.4 CoGZ
24
Figure 2-8: CoGZ mapping process [Falconer 2009]
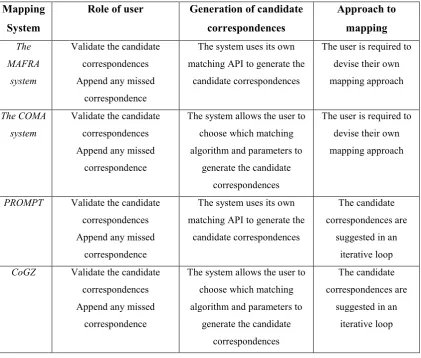
2.3.5 Summary
25
Table 2-2: Comparison between Selected Mapping Systems
Mapping System
Role of user Generation of candidate correspondences Approach to mapping The MAFRA system
Validate the candidate
correspondences
Append any missed
correspondence
The system uses its own
matching API to generate the
candidate correspondences
The user is required to
devise their own
mapping approach
The COMA
system
Validate the candidate
correspondences
Append any missed
correspondence
The system allows the user to
choose which matching
algorithm and parameters to
generate the candidate
correspondences
The user is required to
devise their own
mapping approach
PROMPT Validate the candidate
correspondences
Append any missed
correspondence
The system uses its own
matching API to generate the
candidate correspondences
The candidate
correspondences are
suggested in an
iterative loop
CoGZ Validate the candidate
correspondences
Append any missed
correspondence
The system allows the user to
choose which matching
algorithm and parameters to
generate the candidate
correspondences
The candidate
correspondences are
suggested in an
iterative loop
In each system the role of the user is the same, requiring the user to create a mapping by validating the candidate correspondences suggested and appending any missed correspondences. Two of the systems, the COMA system and CoGZ, allow the user to modify the matching approach used to generate the candidate correspondences. While another two of the systems, the MAFRA system and the COMA system, require the user to devise their own approach for mapping. The other two systems, PROMPT and CoGZ, guide the user through the mapping process by presenting suggested candidate correspondences in an iterative loop. However users are free to take their own mapping approach with these systems. In fact in a recent study with the ontology mapping community it was shown that less than 15% of the people surveyed relied on the order in which the suggestion were shown by the mapping system [Falconer 2009]. All of the systems rely on the user to find and append any missed correspondences.
time-26
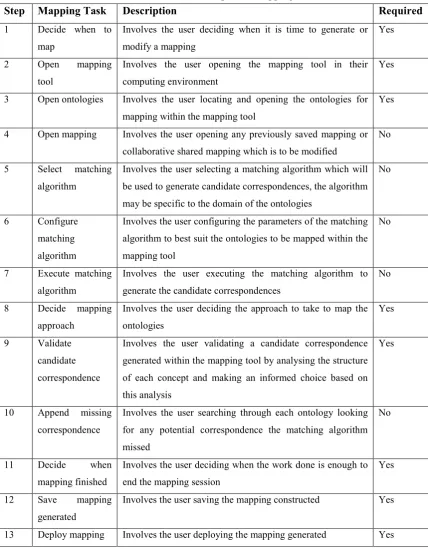
[image:48.595.68.497.170.720.2]consuming and/or highly cognitive. The full list of user-specified mapping tasks were derived from analysis of the state of the art mapping systems and are displayed in table 2-3. The “Required” column indicates if the task needs to be accomplished by the user or if the task is optional and dependent on the implementation of the mapping system.
Table 2-3: List of User-Specific Mapping Tasks
Step Mapping Task Description Required
1 Decide when to
map
Involves the user deciding when it is time to generate or
modify a mapping
Yes
2 Open mapping
tool
Involves the user opening the mapping tool in their
computing environment
Yes
3 Open ontologies Involves the user locating and opening the ontologies for
mapping within the mapping tool
Yes
4 Open mapping Involves the user opening any previously saved mapping or
collaborative shared mapping which is to be modified
No
5 Select matching
algorithm
Involves the user selecting a matching algorithm which will
be used to generate candidate correspondences, the algorithm
may be specific to the domain of the ontologies
No
6 Configure
matching
algorithm
Involves the user configuring the parameters of the matching
algorithm to best suit the ontologies to be mapped within the
mapping tool
No
7 Execute matching
algorithm
Involves the user executing the matching algorithm to
generate the candidate correspondences
No
8 Decide mapping
approach
Involves the user deciding the approach to take to map the
ontologies
Yes
9 Validate
candidate
correspondence
Involves the user validating a candidate correspondence
generated within the mapping tool by analysing the structure
of each concept and making an informed choice based on
this analysis
Yes
10 Append missing
correspondence
Involves the user searching through each ontology looking
for any potential correspondence the matching algorithm
missed
No
11 Decide when
mapping finished
Involves the user deciding when the work done is enough to
end the mapping session
Yes
12 Save mapping
generated
Involves the user saving the mapping constructed Yes
27
The first step requires the user to decide when there is a need to develop or alter a mapping. This is a high cognitive task requiring that the user to understand when there is a need for mapping. Steps two to four necessitate that the user opens the mapping tool, ontologies and mapping file if available. Steps five to seven require that the user needs to understand the matching algorithm provided by the mapping tool and the circumstances of when the algorithm should be used. These steps require the user to understand the benefits and downsides of using algorithms in different domains and are high cognitive tasks. The eighth step involves the user deciding which mapping approach to take. This is non-trivial and is a high cognitive task. In fact a study carried out on the mapping community showed that there is no consensus on which mapping approach to take and is usually down to personal preferences [Falconer 2009]. Steps nine and ten require the user to map the two ontologies by validating candidate correspondences and appending any missing correspondences. These steps involve reading the information of the candidate correspondences to make an informed decision and to search through the ontologies to locate any missing correspondences. These are high cognitive tasks and necessitate that the user have knowledge and understanding of the domain the ontologies represent. Step eleven is a high cognitive task and requires the user to understand when the mapping session has concluded. The user must understand when the level of work done is sufficient. The final two steps require the user to save the mapping constructed and know how to deploy the mapping. The steps above reveal that the mapping process is both labour intensive and requires that the user has strong knowledge engineering skills. This indicates that the user in this process would need to be a person with a knowledge engineering background or a person who has been trained by or is working hand in hand with a knowledge engineer.

![Figure 2-4: Overview of MAFRA framework [Maedche 2002]](https://thumb-us.123doks.com/thumbv2/123dok_us/8811991.918875/42.595.74.497.74.352/figure-overview-mafra-framework-maedche.webp)
![Figure 2-5: The graphical user interface of MAFRA [Maedche 2002]](https://thumb-us.123doks.com/thumbv2/123dok_us/8811991.918875/43.595.100.522.71.379/figure-the-graphical-user-interface-of-mafra-maedche.webp)
![Figure 2-6: Overview of COMA++ Architecture [Aumuller 2005]](https://thumb-us.123doks.com/thumbv2/123dok_us/8811991.918875/44.595.82.487.129.411/figure-overview-coma-architecture-aumuller.webp)
![Figure 2-7: PROMPT Algorithm overview [�oy 2003]](https://thumb-us.123doks.com/thumbv2/123dok_us/8811991.918875/45.595.218.399.247.437/figure-prompt-algorithm-overview-oy.webp)