Volume 72
Issue 2
Summer
Article 7
Summer 1981
Sentence Decisionmaking: The Logic of Sentence
Decisions and the Extent and Sources of Sentence
Disparity
Kevin Clancy
John Bartolomeo
David Richardson
Charles Wellford
Follow this and additional works at:
https://scholarlycommons.law.northwestern.edu/jclc
Part of the
Criminal Law Commons
,
Criminology Commons
, and the
Criminology and Criminal
Justice Commons
This Symposium is brought to you for free and open access by Northwestern University School of Law Scholarly Commons. It has been accepted for inclusion in Journal of Criminal Law and Criminology by an authorized editor of Northwestern University School of Law Scholarly Commons.
Recommended Citation
0091-4169/81/7202-0524
THEJOURNAL OF CRIMINAL LAW & CRIMINOLOGY Vol. 72, No. 2
Copyright © 1981 by Northwestern University School of Law Pntedi)7 USA.
The proposed Federal Criminal Code features several innovations aimed at the problem of disparate sentencing In keeping with the Journal of Criminal Law and Criminologs singular interdisciflinay tradition, we present below two viewpoints rarely encountered together. The first is a criminological evaluation of sentencing dis-parities based on empirical studies by a research group. In the second, Judge Tjoftat provides a legal anaysis of the same issue, drawing on his practical experience on the federal bench. They complement and supplement one another.
THE EDITORS
SENTENCE DECISIONMAKING: THE
LOGIC OF SENTENCE DECISIONS
AND THE EXTENT AND SOURCES
OF SENTENCE DISPARITY*
KEVIN CLANCY,** JOHN BARTOLOMEO,*** DAVID
RICHARDSONt AND CHARLES WELLFORD*
/Inj the great majority of federal cnminzal cases.., a defendant who comes up for sentencing has no way of knowing or reliabl' predicting whether he will walk out of
* The views expressed are those of the authors and not necessarily the position of their respective organizations. The research described in this article is part of a large sentencing study funded by the Federal Justice Research Program.
The authors are grateful to the following people who have carefully reviewed and commented on this paper: Arthur White, Robert Baskin, Adam Yarmolinsky, Brian Forst, William Rhodes, and Karen Skrivseth. Special thanks are due to Paul Berger, who provided valuable guidance in developing and applying several innovative statistical programs, Michael Rouse, who provided research assistance, and all the operational staffs of Yankelovich, Skelly and White, Inc., who contributed to the successful completion of this survey.
** Senior Vice President at Yankelovich, Skelly and White, Inc. and Professor of Market-ing at Boston University Graduate School of Management. Dr. Clancy has directed numer-ous sociological and marketing research studies, and has written extensively on the subject of response bias in surveys. Ph.D., New York University, 1971.
*** Vice President at Yankelovich, Skelly and White, Inc. Dr. Bartolomeo is an internal
consultant to the firm, providing study design and analysis assistance on special projects. Ph.D., University of Pennsylvania, 1977.
t Vice President of the Government Studies Division at Yankelovich, Skelly and White, Inc. He was project manager and principal researcher on the Federal Sentencing Guidelines Research Project, on which this paper is based. M.A., University of Minnesota School of Public Affairs.
the courtroom on probation, or be locked up for a term ofyears that may consume the rest of his lif, or something in between.
Judge Marvin E. Frankel'
I. INTRODUCTION
To make sentencing in federal courts more evenhanded and ra-tional, the proposed revision of the Federal Criminal Code would estab-lish a sentencing commission.2 Within limits established by the legislature, the sentencing commission would establish sentencing guide-lines for different types of offenders, offenses, and purposes of sentencing. In addition, the commission would establish a research program to gen-erate information on the effectiveness of sentences imposed and to use that research to recommend modifications of statutes relating to sen-tencing that produce more effective, humane, and rational sensen-tencing. The research described in this paper is directed towards assessing the extent to which disparity is likely in current federal courts' sentencing practices, and to describe a logic that best accounts for current sentenc-ing practices. This research, and the larger project from which it is drawn, was developed to establish an empirical basis for the initial work of a sentencing commission, and to estimate the extent of the problems in sentencing to which the reforms are addressed.
Most observers of the criminal justice system agree that there are unfair disparities in the sentences meted out in the courts. Indeed, a majority of federal judges believe that the problem exists at least to some extent.3 However, agreement ends with this, for there is considerable debate about the extent of the problem and the degree to which dispar-ity is attributable to the judge's sentencing style, philosophy on the role of criminal sanction, overall tendency to be lenient or harsh, and other factors.
There is little empirical evidence on the extent and sources of sen-tence disparity in the federal courts, and virtually no empirical investi-gation of the phenomenon on a national scale. Judge Marvin Frankel has argued that federal sentence disparity is a serious problem, but has offered only primarily anecdotal documentation.4 Partridge and El-dridge5 demonstrate significant variation in the responses of judges in
t M. FRANKEL, CRIMINAL SENTENCES: LAW WITHOUT ORDER 6 (1973).
2 See S. 1722, 96th Cong., 1st Sess. tit. III, §§ 994-95. See also id. tit. I, §§ 2001-09, 2101-06, 2201-04, 2301-2101-06, 3725; tit. III, §§ 991-93, 996-97 (1980).
3 Yankelovich, Skelly & White, Inc., Judicial Reactions to Sentencing Guidelines 3-4 (1980).
4 M. FRANKEL, supra note 1, passim.
KEVIN CLANCY, ET AL.
one circuit to hypothetical cases. A more recent study by Diamond and Zeisel provides empirical evidence for the existence of serious disparity, but their findings are limited to two federal jurisdictions.6 Research conducted for the New York State Executive Advisory Committee on Sentencing using simulation techniques, demonstrated disparity among New York state judges.7 Finally, Rhodes and Conly,8 using a large sam-ple of cases drawn from several jurisdictions, provide empirical analyses of the factors concerning the defendant and the case that affect sentenc-ing decisions. However, this analysis of actual sentencsentenc-ing decisions per-mits limited inferences regarding the effect of an individual judge on the sentencing decision.
This paper reports the results of the first national survey of federal judges on the extent and causes of sentence disparity. The study had three principal objectives: determination of the extent of sentence dis-parity, examination of the effect of specific case characteristics on sen-tence decisions, and determination of the effect of various attributes of the judge and the judicial environment on sentence decisions.
A. DETERMINING THE EXTENT OF SENTENCE DISPARITY
To determine sentence disparity, the study looked at the relative amounts of consensus and dissensus among federal judges regarding the possible sentences for sixteen hypothetical cases. There are two types of sentence disparity. The first type is interjudge disparity which occurs when there is dissensus among judges over the appropriate sentence for cases with effectively identical offense/offender characteristics. The sec-ond type is intrajudge disparity. It occurs when there is instability over time of a given judge's sentences for cases with identical or extremely similar offense/offender profiles. Table 1 illustrates the two types of dis-parity with hypothetical data. The table reveals dissensus among the three judges concerning the length of prison terms and instability over time for Judges X and Z, but not Judge Y. This paper will deal with only the first type of disparity-dissensus among judges, or interjudge disparity. Consequently, any disparity revealed by the analysis proba-bly understates its actual extent. Throughout this paper the phrases
6 S. DIAMOND & H. ZEISEL, SENTENCING COUNCILS: A STUDY OF SENTENCE
DISPAR-ITY AND ITS REDUCTION (forthcoming). This study was conducted in the Northern District
of Illinois and the Eastern District of New York.
7 NEW YORK STATE EXECUTIvE ADVISORY COMM. ON SENTENCING, CRIME AND
PUN-ISHMENT IN NEW YORK: AN INQUIRY INTO SENTENCING AND THE CRIMINAL JUSTICE SYS-TEM (1979) [hereinafter cited as CRIME AND PUNISHMENT].
8 W. RHODES & C. CONLY, ANALYSIS OF FEDERAL SENTENCING (Inst. for Law and Soc. Research) (forthcoming).
"dissensus among judges" and "sentence disparity" will be used inter-changeably, except where this could prove confusing.
TABLE 1
HYPOTHETICAL DATA TO ILLUSTRATE THE Two DIMENSIONS OF SENTENCE DISPARITY
(Prison sentences for identical cases (in years) by judge and time)
JUDGE
MEAN
TIME X Y Z SENTENCE
T, 3 5 4 4
T2 4 5 6 5
T3 2 5 2 3
MEAN SENTENCE
3
5
4
Consistent with this conceptualization, we have operationalized dissensus as the degree to which judges disagree about the sentence that should be served by offenders found guilty in sixteen hypothetical cases. For each of these cases, judges received seven pieces of information about the offender and the offense and were asked to make a sentencing decision. As the sixteen cases were identical, or "held constant," for all judges in the survey, disagreement about sentences is a measure of in-terjudge disparity, or dissensus.9 Thus, for these sixteen cases, the first objective of the analysis was to partition the variance in sentence deci-sions into two parts: (1) that on which judges agree and which is di-rectly attributable to characteristics of the case; and (2) that on which there is dissensus not attributable to the case, but rather to the judge or elements of the judge's environment. In statistical terms, this partition separates that proportion of decision variance accounted for by the characteristics of the case from the unexplained variance that is consid-ered attributable to the judge.
KEVIN CLANCY, ET AL.
The second and third objectives involve more detailed analyses of each portion of this partitioned variance in sentence decisions-the role of specific case characteristics and the role of particular attributes of the judge and the judicial environment.
B. DETERMINING THE EFFECT OF SPECIFIC CASE CHARCTERISTICS ON
SENTENCE DECISIONS
The study examined the influence of the following seven case char-acteristics on sentence decisions: (1) the offense itself (two were consid-ered, bank robbery and fraud), (2) the offender's age, (3) the offender's criminal record, (4) the offender's role as principal or accomplice to the offense, (5) method of case disposition (plea or trial), (6) the dollar amount involved, and (7) the role of membership in an ongoing crimi-nal organization (for fraud offenses) or the use of a weapon (for bank robbery). The study used these seven factors because other empirical investigations of sentence decisions conducted at the state and local level have indicated their importance.'0
An additional element of this objective was to determine the ways in which certain offense or offender profiles elicit judgments about the appropriate goals of a sentence which, in turn, influence the sentence itself.l' For example, what attributes of the case "cue" the judge that the principal goal of the sanction should be general deterrence rather than, say, incapacitation?- Moreover, how do these case-specific goals influence the nature and extent of the sentence imposed? Case-specific goal articulation is a potential source of both dissensus and consensus in sentence decisions. Goal articulation aggravates the problem of sen-tence disparity to the degree that identical cases yield disparate goals which in turn, produce disparate sentences. If judges agree on sentence goals in specific cases, and agreement on goals does indeed lead to simi-lar sentences, then goal articulation contributes to the maintenance of uniformity in sentencing.
C. DETERMINING THE EFFECT OF VARIOUS ATTRIBUTES OF THE
JUDGE AND THE JUDICIAL ENVIRONMENT ON SENTENCE
DECISIONS
Is dissensus about the appropriate sentence related to characteris-tics of the judge and the judicial environment in which he works?
Iden-10 L. WILKINS, J. KRESS, D. GOTTFREDSON, J. CALPIN & A. GELMAN, SENTENCING GUIDELINES: STRUCTURING JUDICIAL DISCRETION (Nat'l Inst. of Law Enforcement and Grim. Just. 1978) [hereinafter cited as SENTENCING GUIDELINES].
11 For a discussion of judges' and other legal professionals' views of the criminal justice system's overall goals, see Yankelovich, Skelly & White, Inc., Sentencing Goals and their Ap-plication in the Federal Courts (August 1980).
tifying the source of interjudge disparity in sentence decisions could furnish valuable insights into methods of curtailing future disparity. The study analyzed five sets of factors having no direct bearing on the case itself to understand what accounts for disparate sentences given for identical cases: (1) differential perceptions of the severity of different sentences, (2) the judge's propensity to give relatively harsh sentences, (3) the judge's overall goal orientation regarding criminal sanction, for example, his predisposition regarding the functions of sentences, regard-less of the specifics of the case, (4) background characteristics such as demographics and career history, and (5) the region of the country in which the judge's district is located.
The discussion below is keyed to these three objectives, graduallly unfolding the logic of sentencing decisions that judges made in the sur-vey interview. However, before presenting these findings, it is necessary to describe the methodology employed.
II. METHODOLOGY
There are three key elements of the methodology: the sample and field work, the questionnaire, and the analytic techniques.12
THE SAMPLE AND FIELD WORK
Two-hundred-sixty-four active federal district judges, interviewed between September and November, 1979, comprised the sample. Pro-fessional interviewers personally conducted interviews in the judges' chambers or other offices located in the court building. The average interview lasted ninety minutes.
THE QUESTIONNAIRE
The results reported in this paper reflect responses to a significant portion of the survey interview. All of the questionnaire items used in these analyses were structured, except that judges were free to give whatever sentences they chose to hypothetical case scenarios. There were four sets of questions.
The first set required judges to make sentencing decisions based on attributes of the offender and the offense. This involved three tasks:
KEVIN CLANCY, ET AL.
TABLE 2
EXAMPLES OF CASE SCENARIOS
CARD #1
The offense committed was bank robbery
The offender is between 18 and 24 years old
Record:
Role:
Plea/Trial:
Extent of Injury to Victim: Dollar Amount:
The offender has no past criminal record
The offender was an accomplice; he was following the lead of others
The offender entered a plea of guilty
A weapon was used and at least one of the victims suffered serious personal injury
The total amount involved was less than $1,000
CARD #2 Offense:
Age:
Record:
Role:
Plea/Trial:
Organization:
Dollar Amount:
The offense committed was fraud
The offender was 35 to 65 years old
The offender has a dozen previous arrests, most for serious offenses, and has been convicted four times
The offender was an accomplice; he was following the lead of others
The offender entered a plea of guilty
The offender is not a member of any criminal organization
The total amount involved was less than $1,000
Task 1. Interviewers presented the judges with sixteen of-fense/offender case "scenarios" and asked them to choose the appropri-ate sentence. Two examples of these scenarios appear as Table 2. Judges were free to administer sentences that comprised any combina-tion of prison time (in months), supervised time (in months), and fine (in dollars). Moreover, they were instructed to indicate the actual sentence that should be served by the offender. In order to maximize the
poten-Offense:
Age:
[image:8.454.66.404.53.608.2]tial for drawing statistical inferences about the effect of each factor on sentence decisions, the scenarios reflect an incomplete orthogonal experi-mental design.1 3 Note that the study used two opposite extreme values of each factor in the scenarios. Across all scenarios, these extreme levels of each factor were evenly balanced to insure orthogonality. Table 3 provides a full display of the factors, and the levels within factors, for the sixteen offense/offender scenarios.
TABLE 3
EXPERIMENTAL DESIGN FOR 16 OFFENSE/OFFENDER
SCENARIOS
DOLLAR CRIMINAL
SCENARIO # CRIME AGE RECORD ROLE GUILTY BY AMOUNT ORGANIZATION WEAPON
I. ... Robbery Young None Accomplice Plea Low N.A. Yes 2 ... Fraud Old Long Accomplice Plea Low No N.A. 3 ... Robbery Young Long Accomplice Trial Low N.A. No 4 ... Fraud Old None Accomplice Trial Low Yes N.A. 5 ... Robbery Old None Principal Trial Low N.A.. Yes 6 ... Fraud Young Long Principal Trial Low No N.A. 7 ... Robbery Old Long Principal Plea Low N.A. No 8 ... Fraud Young None Principal Plea Low Yes N.A. 9 ... Fraud Old Long Principal Trial High Yes N.A. 10 ... Robbery Young None Principal Trial High N.A. No II ... Fraud Old None Principal Plea High No N.A. 12 ... Robbery Young Long Principal Plea High N.A. Yes 13 ... Fraud Young Long Aoomplice Plea High Yes N.A. 14 ... Robbery Old None Accomplice Plea High N.A. No 15 ... Fraud Young None Accomplice Trial High No N.A. 16 ... Robbery Old Long Accomplice Trial High N.A. Yes
SPECIFICATIONS OF EXTREME LEVELS USED IN THE SCENARIOS
Xs r: Young - 18-24 years old Old - 35-64 years old
Rtaad: None - No prior arrests
Long - 12 arrests and 4 convictions for serious offenses Dolar Amummt: Low - ss than $1,000
High - More than S100,000
Criminal Orgaxizati=1W/mpwa: NA. - Does not apply to this scenario
This entire sequence of questions constitutes an experiment that was incorporated into the questionnaire. The sixteen case scenarios are logically equivalent to experimental treatments or stimuli, and the sen-tence imposed is the response to the stimuli. In keeping with this experi-mental parlance, any variance in the sentence decisions imposed that is not attributable to the stimuli (Le., the specific characteristics of the case and the offender) is assumed to be attributable to the subject (Le., the judge). Thus, the amount of variance unaccounted for by the factors in
the scenarios is interpretable as the degree of dissensus among judges about sentence decisions.
Task 2. The second task was a simplified version of the first. Judges gave monadic (ie., individual, one-at-a-time) ratings of the influ-ence that extreme and intermediate levels of each factor should have on the severity of a sentence. The study used a standard seven-point scale,
[image:9.454.55.399.159.402.2]KEVIN CLANCY, ET AL.
anchored at either end by "should make the sentence much tougher". versus "should make the sentence much lighter." Gathering these mo-nadic ratings is necessary to facilitate interpolations of the effects of in-termediate levels of each factor. (Recall that only extreme levels were incorporated into the scenarios used in Task 1.)
Task 3. Finally, judges were asked to indicate the goal they hoped to achieve with their sentence for four of the sixteen offense/offender scenarios. The four scenarios were randomly selected in each interview. The goal alternatives presented to the judge were general deterrence, special deterrence, rehabilitation, incapacitation, and retribu-tion/deservedness.
The second set of questions, asked separately from the first, look at the perceived severity of sentences. This was done because judges do not give sentences in a single or metric "currency." Rather, sentences are composites of at least three components: prison time, supervised time, and fine. Possibly judges have differential perceptions of the severity of each of these components of a sentence; or perhaps they disagree about the severity equivalences across these components. The study contained questions designed to map the three components of a sentence into a single composite index of perceived sentence severity. The questioning procedure parallels the one described above for sentence decisionmak-ing. It entailed two tasks:
Task . Judges indicated their perception of the severity of each of nine composite sentences composed of prison time, supervised time, and fine.14 The severity scale had seven points, ranging from "extremely se-vere" to "extremely lenient." The nine sentence composites were con-structed according to the same experimental design principles that guided the construction of the sixteen offense/offender scenarios. Table 4 displays the nine sentence composites and reveals the experimental
design that supported their construction.
Task 2. The second task involved monadic ratings of the sever-ity/leniency of extreme and intermediate levels of prison time, super-vised time and fine.
The third set of questions elicited attitudinal data on current sen-tencing policies, including the perceived importance of various goals of criminal sanction. The final set collected background information on the judge, such as age, years of experience, prior career history, region of the country, and so forth.
14 A number of judges found it difficult to evaluate severity without having a specific crime or offender whom they were judging. In analyzing these data, each judge's responses were individually constructed into a ranking of relative severities of alternative sentence com-binations.
TABLE 4
EXPERIMENTAL DESIGN FOR THE NINE SENTENCE
COMPOSITES
SENTENCE SUPERVISED
COMPOSITE # PRISON TIME TIME FINE
(YEARS) (YEARS) ($)
1 0 0 0
2 2 2 5,000
3 25 5 30,000
4 0 2 30,000
5 2 5 0
6 25 0 5,000
7 0 5 5,000
8 2 ,0 30,000
9 25 2 0
ANALYTIC TECHNIQUES
The study employed several analytic techniques. Repeated meas-ures analysis of variance indicated the role of case characteristics and the judge in sentencing decisions. Interpolation and extrapolation tech-niques estimated the effects of intermediate levels of offender/offense characteristics that were not included in the scenarios, but instead were asked monadically.15 Analysis of variance determined the role of case-specific goals in sentence disparities. Micromodeling analyzed the per-ceived severity of sentences for each judge. Finally, the effect of judges' .background characteristics on sentence decisions was determined through analysis of variance followed by step-wise regression analysis..
534 KEVIN CLANC, ET AL. [Vol. 72
TABLE 5
PARTITIONING OF INCARCERATION DECISION VARIANCE
(N = 208)
UNIQUE VARIANCE IN
DECISION TO
SOURCE OF VARIANCE: IMPRISON
Offense/Offender Characteristics (main effects) 37%
Judge/Environment (main effects) 10%
Interaction Effects (between offense/offender characteristics and between judge and
offense/offender characteristics) 53%
TABLE 6
SUMMARY: PARTITIONING OF SENTENCE DECISION
VARIANCE (N = 208)
UNIQUE VARIANCE FOR:
SOURCE OF VARIANCE: PRISON TIME SUPERVISED TIME FINE
Offense/Offender
Characteristics (main effects) 45% 1% 4% Judge Environment (main
ef-fects) 21% 55% 38%
Interaction Effects (between of-fense/offender characteristics
and between judge and
of-fense/offender characteristics) 34% 44% 58%
III. FINDINGS
A. HOW MUCH DISPARITY?
The survey results suggest that sentence disparity does exist. The amount of such disparity varies depending on which aspect of the sen-tencing decision is examined.1 6 If one concentrates strictly on the deci-sion to incarcerate, the disparity is modest (see Table 5). However, when one examines the full range of sentencing options simultaneously,
[image:12.454.63.403.55.481.2]TABLE 7
DETAILED ANALYSIS OF VARIANCE RESULTS: EFFECTS OF
OFFENSE/OFFENDER CHARACTERISTICS,
JUDGES/ENVIRONMENT AND
INTERACTIONS ON PRISON TIME
UNIQUE SUM OF MEAN F-TEST
OF VARIANCE VARIANCE SQUARES SQUARES RATIO SIGNIFICANCE
Offense/Offender Characteristics (main effects)
Judge/Environment (main ef-fects)
Interaction Effects (between of-fense/offender characteristics
and between judge and of-fense/offender characteristics)
45% 49,735 3316 271 <.001
21% 23,916 116 9.7 <.001
34% 37,985 12
more dissensus appears. More variance in sentences is explained by dif-ferences among individual judges than by any other single factor. See Tables 6, 7, 8, and 9. Differences among judges play a particularly strong role in accounting for the amounts of supervised time and fines, completely overwhelming the variance explained by all of the of-fender/offense characteristics measured in the survey results. The judge is less a factor in explaining the length of a convicted offender's prison term, but is nonetheless significant. The judge accounts for 21% of the variance in the prison term imposed, compared to 45% that is attributa-ble to characteristics of the case.
This partitioning of sentence decision variance understates the amount of disparity exhibited in responses to the sixteen cases tested in the survey because additional disparity is harbored in the interaction effects that are also displayed in Tables 6, 7, 8 and 9. To understand this point, it is necessary to digress and provide a brief explanation of interaction effects. Interactions are conditional effects. The relationship between an independent variable and the dependent variable depends on the value of another independent variable-being greater for certain values of the second, independent variable than for others.
Table 10 provides an example of an interaction between two case characteristics.17 Offenders who are accomplices get shorter prison terms than those who are principals (6.2 years vs. 7.8 years). Simil~.rly, offenders who plead guilty are sentenced to less time in prison than
of-17 This example can be elaborated to include interactions between three, four, or more independent variables.
[image:13.454.37.398.61.238.2]KEVIN CLANCY ET AL. [Vol. 72
TABLE 8
DETAILED ANALYSIS OF VARIANCE RESULTS: EFFECTS OF
OFFENSE/OFFENDER CHARACTERISTICS,
JUDGES/ENVIRONMENT AND
INTERACTIONS ON SUPERVISED TIME
SOURCE OF VARIANCE
Offense/Offender Characteristics (main effects)
Judge/Environment (main ef-fects)
Interaction Effects (between of-fense/offender characteristics
and between judge and of-fense/offender characteristics)
UNIQUE SUM OF MEAN F-TEST
VARIANCE SQUARES SQUARES RATIO SIGNIFICANCE
1% 350.7 23.4
55% 13,798 65.4
44% 11,045 3.5
6.7 < .001
18.7 < .001
TABLE 9
DETAILED ANALYSIS OF VARIANCE RESULTS: EFFECTS OF
OFFENSE/OFFENDER CHARACTERISTICS,
JUDGES/ENVIRONMENT AND
INTERACTIONS ON FINE
SOURCE OF VARIANCE
Offense/Offender characteristics (main effects)
Judge/Environment (main ef-fects)
Interaction Effects (between of-fense/offender characteristics
and between judge and of-fense/offender characteristics)
UNIQUE SUM OF MEAN F-TEST
VARIANCE SQUARES SQUARES RATIO SIGNIFICANCE
4% 7,455 497 11.7 <.001
38% 71,112 421
58% 107,335 42.3
9.95 < .001
fenders found guilty through a trial (6.8 vs. 7.2 years). However, even though offenders who plead guilty get lighter sentences on the average (6.8 vs. 7.2), the impact on pleading is quite large for accomplices (5.6 vs. 6.7), but actually reversed for principals (8.0 vs. 7.6). Clearly there is some effect other than the cumulative impact of the two independent factors that only interaction can explain.
[image:14.454.58.411.59.449.2]TABLE 10
INTERACTION BETWEEN OFFENDER'S ROLE IN THE CRIME
AND THE METHOD OF DISPOSITION ON MEAN
PRISON TIME (IN YEARS) (N = 208)
METHOD OF DISPOSITION FOUND GUILTY
ROLE IN THE CRIME PLEA OF GUILTY BY TRIAL MEAN
Accomplice ... 5.6 6.7 6.2 Principal ... 8.0 7.6 7.8 Mean ... 6.8 7.2
and represents patterned differences between judges in the influence of offense/offender characteristics on their sentence decisions. This second type of interaction is an additional form of sentence dissensus.
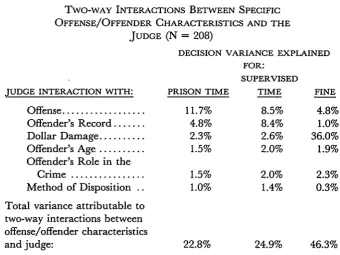
This point returns us to the earlier claim that our initial partition-ing of decision variance underestimated the disparity measured in the survey, for the majority of these interactions are of the second type, be-tween the judge and specific offense/offender characteristics. Table 11 furnishes a breakdown of these interactions. The most important inter-actions affecting prison term and supervised time involve the offense it-self and the offender's record. Indeed, the rank order of the magnitude of all six interactions is identical for both prison and supervised time. When the two crimes tested were bank robbery and fraud, the sizeable interaction variance attributable to the offense itself (11.7% for prison term and 8.5% for supervised time) suggests that judges have rather dif-ferent perceptions of the seriousness of common crime and white-collar crime. However, the amount of fine imposed is highly contingent on the judge's concern about the dollar damage inflicted by the crime. Thirty-six percent of interaction variance is attributable to dollar damage, com-pared to 4.8% for the offense and 1% for the offender's record. These findings regarding interactions generally strengthen the inference that sentence dissensus is a major factor in explaining sentence decisionmak-ing. They suggest that disparity is not simply random divergence of opinion about the sentence that should be imposed, but is also a conse-quence of patterned differences of opinion about the influence that spe-cific case attributes should have on the sentence.
KEVIN CLANCY, ET AL.
TABLE 11
TWO-WAY INTERACTIONS BETWEEN SPECIFIC
OFFENSE/OFFENDER CHARACTERISTICS AND THE
JUDGE (N = 208)
DECISION VARIANCE EXPLAINED FOR:
SUPERVISED
JUDGE INTERACTION WITH: PRISON TIME TIME FINE
Offense ... 11.7% 8.5% 4.8% Offender's Record ... 4.8% 8.4% 1.0% Dollar Damage ... 2.3% 2.6% 36.0% Offender's Age ... 1.5% 2.0% 1.9% Offender's Role in the
Crime ... 1.5% 2.0% 2.3% Method of Disposition .. 1.0% 1.4% 0.3%
Total variance attributable to two-way interactions between offense/offender characteristics
and judge: 22.8% 24.9% 46.3%
meaning given other data about the case. The logic of sentence deci-sions is explored further in the following section, which treats the role of each case characteristic and the role of the goal the judge hopes to achieve with the sentence imposed.
B. THE LOGIC OF SENTENCE DECISIONS: THE ROLE OF SPECIFIC CASE
ATTRIBUTES AND CASE-SPECIFIC GOALS
Case Attributes
Not surprisingly, the attributes of the offender and the offense have a significant bearing on the sentence imposed. However, these effects are anything but uniform across the three components of sentences. All of the case characteristics studied have a significant impact on the prison term, but only the past record of the offender influences the amount of supervised time, while the crime and the age of the offender affect the fine imposed (see Table 12). These patterns support the inference (also not surprising) that prison term is the most important element of a sen-tence and as such, is most sensitive to the various nuances of the case.
[image:16.454.57.398.62.317.2]white-collar crime, and that- common crimes are better punished with longer incarceration terms. This is corroborated by the tendency of judges to impose relatively heavy fines for the fraud cases. Also quite important is a set of factors related to the amount of harm caused by the crime and indicators of the harm that the offender might potentially have on society. In rank order these include the offender's past criminal record, the use of a weapon and the injury inflicted, the offender's mem-bership in a criminal organization, the dollar damage of the crime, and the prominence of the offender's role in the crime. The method of case disposition has a modest, though statistically significant, impact on the prison sentence. The relationship between prison sentence and the of-fender's age is somewhat more complicated. Judges show some leniency for juveniles (under 18 years of age) and younger offenders (18 to 24 years), are somewhat harsher for middle-age offenders (25 to 60 years), and are lenient for older offenders (over 60 years of age).18 There is, of course, an artificial quality to these data. When actually sentencing, judges may construct composite sentences of prison time, supervision, and fine. To examine the effect of different factors on each of these sentence components separately does not account for trade-offs among them. Even prison time, clearly the most important component of the criminal sanction, does not constitute the complete sentence. A full un-derstanding of the sentencing decision process requires that the three components be considered simultaneously for any given case. A subse-quent section of this report therefore combines these three sentence com-ponents into a single measure to evaluate sentence disparities and the influence of specific case characteristics. However, before these findings
18 As a test of the reliability of these findings, these data were compared to the Rhodes/Conly analysis of actual sentence decisions. See note 8 supra. Direct comparisons are difficult because of the formulation of the analytic equations and differences in both in-dependent and in-dependent variable definition. However, four key variables were ranked for their influence on prison terms with the following results.
Yankelovich INSLAW -Actual andeWht Data Impact
and W hite o r s n T r
Simulation on Prison Term
Impact on Bank
Rank Order on Effect of: Prison Term Fraud Robbery Prior record ... 1 1 1
Age ... 2 4 2 Role in crime ... 3 2 3 Plea ... 4 3 4
540 KEVIN CLANCY, ETAL. [Vol. 72
TABLE 12
EFFECT OF SPECIFIC OFFENSE/OFFENDER
CHARACTERISTICS ON PRISON TIME, SUPERVISED
TIME, AND FINE
AVERAGE SENTENCESa = 84 months of prison time/20 months of supervised time/$1536 of fine.
N = 208
INCREASE (+) OR DECREASE (-) IN AVERAGE SEN-TENCE DUE TO CASE CHARACTERISTICS PRISON SUPERVISED
TIME TIME FINE
CASE CHARACTERISTICS (MONTHS) (MONTHS) ($)
Type of Crime
Bank Robbery ... +33 n.s.c -617
Fraud ... -33 n.s. +617
Age
Under l8b ... -12.0 n.s. -536
18-24 ... -- 6.8 n.s. -306
25 -35b ... + 4.3 n.s. +193
35-60 ... + 6.8- n.s. +306
Over 60b ... - 3.5 n.s. +155 Record
No past record ... -21 +1 n.s.
No record; but suspectedb ... 0 0 n.s.
1 arrest; no convictionsb ... - 6 0 n.s.
Multiple arrests; no convictions . + 1 0 n.s.
5 arrests; I convictionb ... + 9 0 n.s.
12 arrests; 4 convictions ... +21 -1 n.s.
Role
Accomplice ... - 9 n.s. n.s.
Principal ... + 9 n.s. n.s.
Method of Disposition
Plead guilty ... - 3 n.s. n.s.
Found guilty ... + 3 n.s. n.s.
Dollar Damage
Under $1,000 ... -11.4 n.s. n.s.
over $100,000 ... +11.4 n.s. n.s.
Membership in Criminal Organization
Not a member ... -14.6 n.s. n.s.
Member ... + 14.6 n.s. n.s.
Use a Weapon
No weapon ... .. -16.4 n.s. n.s.
Weapon and injury ... +16.4 n.s. n.s.
a This represents the average across all sixteen scenarios of the sentences judges assign. In statisti-cal terms, it is the grand raean. It provides a base for comparison of individual factor effects on
sentences, and has no meaning by itself. Because of the artificial nature of the cases, numerical effects of specific characteristics should be used only as indicates and should not be compared to real-world sentences.
[image:18.454.66.389.155.543.2]are presented it is valuable to discuss the role of case-specific goals on prison time.
Case-Specift Goals
The foregoing section indicates the role of several offense and of-fender characteristics in judges' sentencing decisions. However, it leaves unexamined the cognitive process underpinning those decisions. An im-plicit first step in sentencing is the articulation of a specific goal or in-tended function of the sentence imposed.1 9
In this analysis we examined how, in each specific case, certain con-figurations of case attributes are associated with a particular goal or goals. Since this process of goal articulation is fitted to the attributes of each case, it may bear little relationship to the judge's overall philoso-phy regarding the functions of criminal sanctions.2 0 In other words, these case-specific goals intervene between the offense/offender charac-teristics and the sentences, and result in sentences different from the ones that would have occurred had other goals been sought. This proposition of the role of case-specific goal articulation is captured in Figure 1.
FIGURE 1
THE ROLE OF CASE-SPECIFIC GOALS
Judgment
Offense/ Regarding
Offender The Most
Characteristics 0 Appropriate 0 Sentence
Goal(s) of Imposed
The Sentence
The crucial point to be made about case-specific goals is that they are a potential source of sentence disparity. If identical cases produce divergent judgments about the appropriate goal and if the choice of a
19 Most theoretical and empirical work on sentencing discusses sentencing goals to some extent. Some, such as W. GARFIN, PARTIAL JUSTICE: A STUDY OF BIAS IN SENTENCING (1975), simply describe the major goals of sentencing on which there is a presumed consensus among thejudiciary. Others focus on more specific issues, for example, the goals of imprison-ment, see N. MORRIS, THE FUTURE OF IMPRISONMENT (1974); REPORT OF THE 20TH
CEN-TURY FUND TASK FORCE ON CRIMINAL SENTENCING, FAIR AND CERTAIN PUNISHMENT
(1975); or on the achievement of specific goals, see F. ZIMRING & G. HAWKINS, DETERRENCE: THE LEGAL THREAT IN CRIME AND CONTROL (1973). A few researchers have considered how goals should be incorporated into sentencing guidelines. See, e.g., CRIME AND PUNISH-MENT, supra note 7.
[image:19.454.56.392.312.424.2]542 KEVIN CLANCY, ETAL. [Vol. 72
particular goal is, in turn, related to the sentence that is imposed, dispar-ity can result.
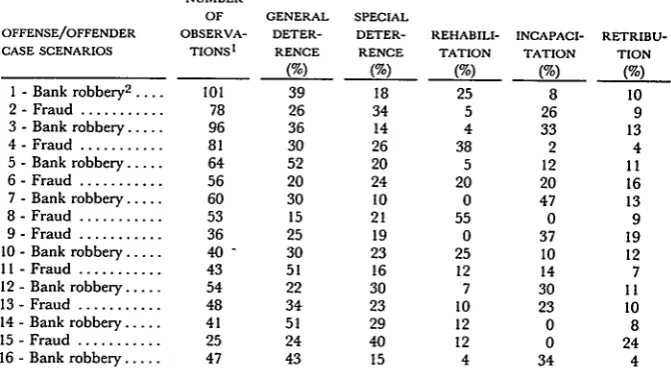
The survey provides data to test these hypotheses. Afterjudges sen-tenced the hypothetical offenders in the sixteen case scenarios, inter-viewers asked them to indicate the principal goal they hoped to achieve with their sentence.21 Table 13 shows the distribution of responses,
which appears to substantiate the proposition that identical cases yield
TABLE 13
THE RELATIVE DISTRIBUTION OF CASE-SPECIFIC GOALS FOR SIXTEEN OFFENSE/OFFENDER SCENARIOS
PRINCIPAL CASE-SPECIFIC-GOALS NUMBER
OF GENERAL SPECIAL
OFFENSE/OFFENDER OBSERVA- DETER- DETER- REHABILI- INCAPACI- RETRIBU-CASE SCENARIOS TIONS1 RENCE RENCE TATION TATION TION
(%) (%) (%) (%) (%)
1 -Bank robbery2 .... 10 1 3 9 18 2 5 8 10
2- Fraud ... 78 26 34 5 26 9
3 - Bank robbery ... 96 36 14 4 33 13
4 -Fraud ... 81 30 26 38 2 4
5 - Bank robbery ... 64 52 20 5 12 11
6 -Fraud ... 56 20 24 20 20 16
7 - Bank robbery ... 60 30 10 0 47 13 8 - Fraud ... 53 15 21 55 0 9
9 - Fraud ... 36 25 19 0 37 19
10 - Bank robbery ... 40- 30 23 25 10 12
11 -Fraud ... 43 51 16 12 14 7
12 - Bank robbery ... 54 22 30 7 30 11
13 -Fraud ... 48 34 23 10 23 10
14 - Bank robbery ... 41 51 29 12 0 8
15 -Fraud ... 25 24 40 12 0 24
16 - Bank robbery ... 47 43 15 4 34 4
I Any one judge answered this question for just the first four of the sixteen scenarios. Though scenario cards were to be shuffled, there is some overrepresentation of the first cards and under-representation of the last.
2 Refer to Table 3 for the specific combination of factors associated with each scenario.
divergent goals among judges. In any given case, a goal rarely is cited
by less than 10% of the judiciary, but in only three cases does a majority
seek any single goal: general deterrence in cases 5, 11, and 14. Deterrence is the goal most likely to drive sentence decisions. The average fre-quency of citation for general deterrence is 33%, followed by special de-terrence (23%). Incapacitation (18%), rehabilitation (15%), and retribution (11%) are less frequently pursued. Finally, the nature of the crime seems to have some bearing on the intended purpose of the
[image:20.454.61.397.222.409.2]tence. Bank robbery is more likely than fraud to prompt the judge to seek the goals of general deterrence, incapacitation, and retribution. Conversely, special deterrence and rehabilitation are more often sought in the fraud cases (see Table 14).22 While these are the goals expressed
as most important in specific cases, most judges also consider at least one other goal somewhat applicable.23
TABLE 14
AVERAGE PERCENTAGES OF CASE-SPECIFIC GOALS BY TYPE
OF CRIME
TOTAL BANK
CASE ROBBERY FRAUD
SCENARIOS SCENARIOS SCENARIOS
(Number of Observations) (923) (503) (420)
CASE-SPECIFIC GOALS: % % %
General deterrence ... 33 38 28 Special deterrence ... 22 18 26 Incapacitation ... 19 22 15 Rehabilitation ... 15 11 21 Retribution ... 11 11 11
Does the intended purpose of the sentence influence the sentence itself-the amount of prison time, supervised time, or fine? The goal sought by the judge strongly influences the amount of prison time im-posed (see Table 15). The influence of case-specific goals on the amount of supervised time and fine is less pronounced. Such influence is largely limited to the fraud cases (see Tables 16 and 17). In half of the cases studied, the goal of incapacitation yields significantly longer prison terms, while the goal of rehabilitation yields lighter prison sentences. The desire to rehabilitate is also associated with more extensive periods of supervision and lighter fines. The goals of retribution and deterrence are somewhat more likely to prompt contracted periods of supervision and heavier fines.
22 These results contrast somewhat with those presented in Mann, Wheeler & Sarat,
Sen-tencing the White Collar Ofender, 17 Am. CRIM. L. REv. 479 (1980).
[image:21.454.61.394.176.333.2]KEVIN CLANCY, ET AL.
TABLE 15
THE EFFECT OF CASE-SPECIFIC GOALS ON PRISON TIME
IF SIGNIFICANT:
OFFENSE/OFFENDER CASE SCENARIOS
I -Bank robberya 2 -Fraud 3 - Bank robbery
4 -Fraud 5 -Bank robbery 6 -Fraud 7 -Bank robbery 8 -Fraud 9 -Fraud 10 -Bank robbery
11 - Fraud
NUMBER OF OBSER-VATIONS 101 78 96 81 69 56 60 53 36 40 43
SIGNIFI-CANCE GOAL
LEVEL ELICITING
OF F- HEAVIEST
TEST SENTENCE
** * Incapacitation
** Special
Deterrence
** Incapacitation ** Incapacitation
Incapacitation GOAL ELICITING LIGHTEST SENTENCE Rehabilitation Rehabilitation Rehabilitation Rehabilitation Special Deterrence 12 -Bank robbery 54 Incapacitation Rehabilitatio
13 -Fraud 48 ** Incapacitation Rehabilitatio
14 - Bank robbery 41 ** Incapacitation Rehabilitatio
15 - Fraud 25 *
16 -Bank robbery 47 Incapacitation Rehabilitatio
a Refer to Table 3 for specific combinations of factors associated with each scenario.
* = Not significant ** = Significant at .20 level *** = Significant at .05 level n n n
n
Divergent perceptions of the appropriate case-specific goals appar-ently aggravate the problem of disparity. In their response to the sur-vey, judges did indeed pursue quite different goals for identical cases and these disparate goals, in turn, resulted in disparate sentence deci-sions.
C. THE PSYCHOLOGICAL/COGNITIVE, CONTEXTUAL, AND
ATTITUDINAL CORRELATES OF SENTENCE DECISIONS
[image:22.454.61.401.83.376.2]OFFENSE/OFFENDER CASE SCENARIOS
I -Bank robberya
2 -Fraud
3 -Bank robbery 4 -Fraud 5 -Bank robbery
6 - Fraud 7 -Bank robbery
8 -Fraud
9 -Fraud
10 -Bank robbery 11 - Fraud 12 -Bank robbery
13 -Fraud 14 -Bank robbery
15 -Fraud
16 -Bank robbery
NUMBER OF OBSER-VATIONS 101 SIGNIFI-CANCE LEVEL OF F-TEST GOAL ELICITING HEAVIEST SENTENCE Rehabilitation
78 *** Rehabilitation
**"' Incapacitation
Rehabilitation
54 * Rehabilitation
48 *
41 *** Rehabilitation
a Refer to Table 3 for specific combinations of factors associated with each scenario. * Not significant ** = Significant at .20 level *** = Significant at .05 level
judge, and (b) divergences of opinion among judges about the goal of the sentence for each specific case.
This section poses additional questions about the sources of dispar-ity by focusing on certain psychological/cognitive attributes of the judge-primarily, patterned divergences in perceptions of the severity of
sentences and in predispositions to be harsh or lenient in sentencing-and on judges' general attitudes toward sentencing sentencing-and the judicial en-vironment in which sentencing decisions are made. The key point about these factors is that their relationship to the case itself is indirect at best. They constitute the cognitive and social filter through which data about the case must flow before a sentence decision is reached.
TABLE 16
THE EFFECT OF CASE-SPECIFIC GOALS ON SUPERVISED
TIME
IF SIGNIFICANT:
[image:23.454.58.395.87.404.2]546 KEVIN CLANCY, ETAL. [Vol. 72
TABLE 17
THE EFFECT OF CASE-SPECIFIC GOALS ON FINE IF SIGNIFICANT:
SIGNIFI-NUMBER CANCE GOAL GOAL
OF LEVEL ELICITING ELICITING
OFFENSE/OFFENDER CASE OBSER- OF F- HEAVIEST LIGHTEST
SCENARIOS VATIONS TEST SENTENCE SENTENCE
1 -Bank robberya 101 _b ...b
2 -Fraud 78 Retribution Rehabilitation
3 -Bank robbery 96 _
4 -Fraud 81 Retribution Rehabilitation
5 -Bank robbery 64 *
6 - Fraud 56 *
7 -Bank robbery 60 *
8 -Fraud 53 Special Rehabilitation
Deterrence
9 - Fraud 36 *
10 -Bank robbery 40 *
I l - Fraud 43 *
12 -Bank robbery 54 *
13 -Fraud 48 *
14 - Bank robbery 41 *
15 -Fraud 25 *
16 -Bank robbery 47 *
a Refer to Table 3 for specific combinations of factors associated with each scenario. b Fines not given for these cases.
• - Not significant ** Significant at .20 level *** - Significant at .05 level
Psychological/Cognitive Factors.- The Role ofJudges" Perceptions of Sentence Severity and Predispositions to be Lenient or Harsh
A revealing pattern cuts across Tables 15, 16 and 17-a kind of
reciprocal relationship between the goals sought by judges and the type of sentence imposed. Thus, rehabilitative sentences tend to yield dimin-ished prison time and increased supervised time, while retribution and deterrence are associated with heavier fines and contracted periods of supervision. This relationship is not particularly surprising, for it
con-forms to intuitive expectations. However, it is quite noteworthy as an
indicator of an important feature of sentence decisionmaking, namely the cognitive process whereby judges simultaneously weigh both the sig-nificance of case attributes and the relative severity of the sentence op-tions available. These latter consideraop-tions add to the complexity of sentence decisions and constitute an additional potential source of dis-parity.
[image:24.454.67.404.95.351.2]TABLE 18
DETAILED ANALYSIS OF VARIANCE RESULTS: EFFECTS OF OFFENSE/OFFENDER CHARACTERISTICS,
JUDGES/ENVIRONMENT AND
INTERACTIONS ON COMPOSITE MEASURE OF SENTENCE SEVERITY
UNIQUE SUM OF MEAN
F-SOURCE OF VARIANCE VARIANCE SQUARES SQUARES TEST SIGNIFICANCE Offense/Offender Characteristics
(main effects) 20% 1251 83 161 <.001
Judge/Environment (main effects) 65% 4087 33 64 <.001
Interaction Effects (between of-fense/offender characteristics and between judge and offense/offender
characteristics) 15%
that judges impose. Judges appear to perceive the severity of any given component of a sentence differently. They may also have markedly dif-ferent perceptions of the severity equivalences across the various compo-nents of a sentence. For example, how severe is six months in prison as contrasted with two years of supervision? Given these differential per-ceptions, two judges quite possibly could reach identical conclusions about the seriousness of each of the hypothetical cases presented in the survey, but impose radically different sentences24 because they adhere to radically different notions about the sentences' severity. Conversely, it is possible that identical sentences given by two judges are a deceptive in-dication of consensus, because differences between their perceptions of the seriousness of the case may be balanced by an opposite view about the severity of the sentence.
To address this issue of sentencing tradeoffs, we conducted an anal-ysis of perceived severity beginning with the creation of a composite measure of sentence severity for each judge using a micromodeling pro-cedure. Micromodeling consists of an examination of each judge's per-ception of the severity of a particular sentence using as a data, base their ratings of various sentence combinations. This composite sentence was then used as a dependent variable in an analysis of variance predicting the sentences a judge imposed. The results appear in Table 18. Twenty percent of the decision variance is attributable to the offense/offender characteristics (main effects), and 15% is due to interactions among the offense/offender characteristics and between judges and offense/offender characteristics. The balance of the decision variance-a substantial 65%--is attributable to the judge given the assumptions of our design. This confirms and enlarges on previous findings. Judges do indeed
[image:25.454.62.398.62.212.2]KEVIN CLANCY, ET AL.
give different sentences for the same cases. The amount of dissensus among judges is quite significant. In fact, the effect of the individual judge on the composite sentence imposed is greater than it is on each component separately. This suggests that one element of sentencing guidelines might be to agree upon the units of exchange between alter-native components of sentences.
Having established that alternative tradeoff patterns among sen-tencing alternatives account for some interjudge sentence disparity, we are still left with the question: To what degree is sentence disparity at-tributable to differences in the perceived severity of sentences rather than in the perceived seriousness of the case? A related question deals with patterns of actual leniency/harshness of sentences: To what degree is sentence disparity attributable to basic predispositions, or tendencies, among judges to give sentences that are more or less harsh? The answers to these queries are laden with policy implications. If discrepant percep-tions of sentence severity and predisposipercep-tions to sentence harshly or leni-ently contribute measurably to disparity, the problem of sentence disparity is appropriately addressed by seeking consensus on the desired underlying metric of sentence severity. This task could prove infinitely more difficult than the development of guidelines because perceptions of sentence severity are value-charged and psychologically and socially de-termined.
To explore these questions, we conducted another stage of the anal-ysis in which: (a) judges were categorized based on their perceptions of the relative severity of sentences; (b) they were further categorized based on the relative actual harshness or leniency of their sentences; and (c) the effects of these two dimensions on sentences were estimated. The first step of this analysis was to calculate the average sentences (prison time, supervision, and fine) across all judges for each of the sixteen sce-narios. These average sentences were then fed through the judge-spe-cific equations that related the three components of sentences in order to estimate each judge's perception of the relative severity of the average sentence. This was repeated for all sixteen of the hypothetical cases. The sixteen severity estimates were then averaged for each judge, yield-ing a reliable estimate of each judge's perception of the relative severity of different types of sentences.
This exercise enables us to classify judges according to theirpercep-tions of the severity of sentences. It enables us to answer questheirpercep-tions such as: Does Judge X believe that three years in prison is more or less severe than Judge Y does? Or, more complexly, does Judge X believe that three years of prison, plus one year of supervision, plus $1,000 fine is more or less severe than Judge Y does? However, it does not enable us to classify judges according to their actual lenienqy or harshness in
TABLE 19
NINE-WAY CLASSIFICATION MATRIX FOR OVERALL
PERCEIVED SENTENCE SEVERITY AND LENIENCY
OR HARSHNESS OF SENTENCES GIVEN
IN SCENARIOS
OVERALL PERCEIVED
SENTENCE SEVERITY
HARSH
()
OVERALL
LENIENCY/
HARSHNESS MEDIUM
IN RESPONSE
TO SCENARIOS
LENIENT
()
13.830
0.828
13.095
0.093
12.081
-0.921
Mean 14.319 13.116 11.471
Effect 1.317 0.114 -1.431
* - Mean ** = Effect ** = Standard deviation (7) Number in group.
sentences. This is an important distinction. Two judges with different perceptions of sentence severity may nevertheless make quite similar sentence decisions.
We accounted for the harshness/leniency factor by classifying judges into a two-dimensional, nine-cell matrix. The first dimension of the matrix took each judge's perceived sentence severity score and as-signed each judge to one of three levels of perceived severity. For each of these levels, judges were further classified into one of three levels of relative leniency or harshness. Thus, judges who regard sentences as be-ing rather severe were subdivided into those whose sentences for the six-teen cases were relatively harsh, those whose sentences were relatively light, and those whose sentences fell in the middle of the spectrum. The nine-way classification is displayed in Table 19.
While the procedure used to develop this classification system is
High Medium Low
15.097 13.624 12.770
-0.050 -0.320 0.371
0.527 0.223 0.365
(13) (14) (14)
14.284 13.070 11.938
-0.129 -0.140 0.268
0.201 0.149 0.262
(14) (14) (14)
13.577 12.655 10.011
0.179 0.460 -0.639
0.213 0.146 1.358
[image:27.454.62.395.106.392.2]KEVIN CLANCY ET AL.
TABLE 20
REPEATED MEASURE ANALYSIS OF VARIANCE RESULTS:
EFFECTS OF OFFENSE/OFFENDER CHARACTERISTICS,
OVERALL PERCEPTIONS OF SENTENCE SEVERITY AND
OVERALL ACTUAL LENIENCY OR HARSHNESS ON SENTENCE DECISIONS
UNIQUE
F-SOURCE OF VARIANCE VARIANCE TEST SIGNIFICANCE
Offense/Offender
Characteristics 14% 161 < .001
Judge:
- Sentence severity
percep-tions 39% 296 <.001
-Actual leniency/harshness 16% 120 <.001
-Interaction: severity per-ceptions and
lenien-cy/harshness 3% 13 < .001 Residual Variance and
Other Interactions 28%
complicated, this should not obscure the straightforwardness of its un-derlying logic and its power as an analytic tool. The question that prompted this entire sequence of analyses can now be posed in more refined form. To what degree is sentence dissensus the result of (a) di-vergent perceptions of the severity of the sentences imposed, (b) pat-terned predispositions of judges to be relatively harsh or lenient, and (c) an interaction between perceptions of severity and predispositions to-ward harshness or leniency? Perceived severity, relative harshness or le-niency, and case characteristics were entered as independent variables into a repeated measures analysis of variance to determine their effects on sentencing decisions.25 The results appear in Table 20. Thirty-nine per-cent of the decision variance is linked to divergent perceptions of the severity of sentences, and another 16% is attributable to judges' general predispositions to be relatively harsh or lenient when sentencing. The cumulative importance of these perceptions and practices of the judge overwhelm the importance of case attributes in the sentence decisions made for the sixteen hypothetical cases.
25 The case attributes were entered as sixteen levels, for the six hypothetical cases, in the repeated measures design. This isolated the variance due to case attributes from the variance due to perceived severity and relative harshness.
[image:28.454.65.402.65.317.2]Seemingly, then, the disparities we observed in sentences are not random events. Rather, a substantial portion of this dissensus is attribu-table to divergent perceptions of the severity of the sentences that are being meted out and predispositions on the part of judges to be more or less harsh when sentencing.
The Role of Factors that Have No Direct Bearing on the Case
Up to this point, the discussion has focused on factors that are ei-ther directly related to a case-the offender's background, the nature of the offense, and the goal that the judge hopes to achieve with the sen-tence-or that are directly related to the nature of the sanction-nota-bly the relative severity and harshness of the judges. We now turn to four sets of factors that have little or no direct bearing on the case. The first set includes the overall goal orientation of the judge (as opposed to case-specific goals discussed previously) and the'judge's perception of how satisfactorily the federal criminal justice system achieves these goals. We analyzed the following orientations: general deterrence, spe-cial deterrence, rehabilitation, incapacitation, retribution/deservedness, and restitution. The second set includes the judge's evaluation of the general quality of the federal sentencing process and his or her percep-tion of the degree to which sentence disparity constitutes a problem for the federal criminal justice system. The third set encompasses back-ground characteristics of the judge: political ideology (self-identification as liberal or conservative); career variables, such as the number of years served as a federal judge and years in the legal profession; the type of community in which the judge was raised (urban/suburban/rural); and the judge's race. The fourth factor is the region of the country in which the judge's jurisdiction is located-with judges separated into four ma-jor sections of the country. These variables were entered as independent
variables into a step-wise multiple regression in which the dependent variable was mean prison time given across all sixteen cases.26 The re-sults appear in Table 21.27
Approximately 40% of the variance in prison time sentences is at-tributable to these factors-a surprising and important finding in view
26 Thus this analysis disregarded the role of offense/offender factors. The analysis re-ported here is for a subsample of 116 judges who received all of these questions. There were some missing observations for a number of respondents, but analysis ofjudges for whom there
were not missing observations yielded parallel results.
552 KEVIN CLANCY, ET AL. [Vol. 72
TABLE 21
THE EFFECT OF NONCASE FACTORS ON PRISON TIME
INCRE-JUDGE PERCEPTIONS OR MENTAL B- BETA T-
SIGNIF-CHARACTERISTICS VARIANCE COEFFICIENT COEFFICIENT TEST CANCE The system's achievement of
special deterrence goal 7.3% -29.671 0.319 -3.72 .01
Importance of incapacitation
goal 5.6% 18.079 0.245 3.26 .01
The system's achievement of
rehabilitation goal 4.9% 17.802 0.231 3.05 .01
Region of the country 4.8% 10.924 0.236 3.02 .01
Political ideology 3.5% 11.644 0.196 2.59 .05
The system's achievement of
retribution goal 2.8% -13.344 -0.180 -2.29 .05
Importance of general
deter-rence goal 2.4% 13.621 0.177 2.12 .05
Other variables combined 8.2%
Multiple R2 = .395
of their remoteness from the case. Even more interesting, however, is the particular variables that come into play. All of the significant variables except for region of the country represent value orientations or attitudes rather than background characteristics of the judge.28 Of these value orientations, political ideology appears to be the one that is most moved from the issue of criminal sanctions, with those judges who re-gard themselves as liberal giving less prison time than their conservative counterparts. The bulk of the variance, however, relates to the judge's perceptions regarding the overall goals of sentences-both the impor-tance attached to the goals and evaluations of how well the goals are being accomplished. Thus, the more important the goals of incapacita-tion and general deterrence, particularly the former, the greater the prison time given by the judge. Judges' views about which goals the system actually is accomplishing are associated with different sentences. Judges who believe that the system is helping to rehabilitate criminals give heavier sentences on average. On the other hand, those who believe the system is achieving special deterrence and retribution give lighter sentences on average. Southern judges give substantially heavier sentences than others.
These findings challenge the view that guidelines will impair the