R E S E A R C H A R T I C L E
Open Access
Preserved skeletal muscle protein anabolic
response to acute exercise and protein intake
in well-treated rheumatoid arthritis patients
Ulla Ramer Mikkelsen
1,2*, Kasper Dideriksen
1, Mads Bisgaard Andersen
1, Anders Boesen
1,
Nikolai Mølkjær Malmgaard-Clausen
1, Inge Juul Sørensen
3, Peter Schjerling
1, Michael Kjær
1and Lars Holm
1,4Abstract
Introduction:Rheumatoid arthritis (RA) is often associated with diminished muscle mass, reflecting an imbalance between protein synthesis and protein breakdown. To investigate the anabolic potential of both exercise and nutritional protein intake we investigated the muscle protein synthesis rate and anabolic signaling response in patients with RA compared to healthy controls.
Methods:Thirteen RA patients (age range 34–84 years; diagnosed for 1–32 years, median 8 years) were individually matched with 13 healthy controls for gender, age, BMI and activity level (CON). Plasma levels of C-reactive protein (CRP), interleukin (IL)-6 and tumor necrosis factor (TNF)-αwere measured using enzyme-linked immunosorbent assay (ELISA) in resting blood samples obtained on two separate days. Skeletal muscle myofibrillar and connective tissue protein fractional synthesis rate (FSR) was measured by incorporation of the amino acid13C6-phenylalanine
tracer in the overnight fasted state for 3 hours (BASAL) and 3 hours after intake of whey protein (0.5 g/kg lean body mass) alone (PROT, 3 hrs) and in combination with knee-extensor exercise (EX) with one leg (8 × 10 reps at 70 % of 1RM; PROT + EX, 3 hrs). Expression of genes related to inflammatory signaling, myogenesis and muscle growth/atrophy were analyzed by real-time reverse transcriptase-polymerase chain reaction (RT-PCR).
Results:CRP was significantly higher in the RA patients (2.25 (0.50) mg/l) than in controls (1.07 (0.25) mg/l;p= 0.038) and so was TNF-α(RA 1.18 (0.30) pg/ml vs. CON 0.64 (0.07) pg/ml;p= 0.008). Muscle myofibrillar protein synthesis in both RA patients and CON increased in response to PROT and PROT + EX, and even more with PROT + EX (p< 0.001), with no difference between groups (p> 0.05). The gene expression response was largely similar in RA vs. CON,
however, expression of the genes coding for TNF-α, myogenin and HGF1 were more responsive to exercise in RA
patients than in CON.
Conclusions:The study demonstrates that muscle protein synthesis rate and muscle gene expression can be stimulated by protein intake alone and in combination with physical exercise in patients with well-treated RA to a similar extent as in healthy individuals. This indicates that moderately inflamed RA patients have maintained their muscle anabolic responsiveness to physical activity and protein intake.
* Correspondence:ullaramer@hotmail.com
1
Institute of Sports Medicine, Department of Orthopaedic Surgery M, Bispebjerg Hospital and Center for Healthy Aging, Faculty of Health and Medical Sciences, University of Copenhagen, Bispebjerg Hospital bldg 8, Bispebjerg Bakke 23, 2400 Copenhagen NV, Denmark
2
Section for Sports Science, Institute of Public Health, Aarhus University, Dalgas Avenue 4, 8000 Aarhus C, Denmark
Full list of author information is available at the end of the article
Introduction
Rheumatoid arthritis (RA) is a systemic, inflammatory, autoimmune disease primarily affecting the joints [1]. Patients with RA are often characterized by having a lower muscle mass than their peers [2] and one of the causal mechanisms has been suggested to be related to the chronic inflammatory state [3]. Rat studies show that the development of low-grade inflammation negatively affects muscle mass and attenuates the muscle protein synthesis response to feeding [4, 5]. Moreover, plasma from cachectic patients (cancer and septic shock), char-acterized by high levels of inflammatory markers, can in-duce inflammatory signaling and loss of muscle protein in cultured muscle cells [6–8]. Likewise, an increased level of systemic inflammation may contribute to the muscle loss observed in relation to other diseases like cancer, chronic obstructive pulmonary disease (COPD) and diabetes [8–15]. Evidently, the loss of muscle mass leads to muscle strength deficits and in addition, RA pa-tients may have reduced muscle strength due to greater intramuscular fat infiltration [16] along with pain-related limitations. In addition to the repeatedly reported reduc-tion in muscle strength in RA patients [16–18], metabolic changes occur in both preclinical and later RA stages, in-cluding deterioration of blood lipid profile and insulin sensitivity [19–21] which may increase cardiovascular dis-ease risk, summing up to a reduced life span [22]. All of these conditions could be rejuvenated by improving skeletal muscle mass and quality by means of exercise and nutritional interventions, highlighting the importance of understanding the molecular regulation of muscle mass in RA.
Resistance exercise enhances protein turnover rate, thus increases both protein synthesis and breakdown rates. However, a concomitant intake of dietary protein further stimulates muscle protein synthesis resulting in a net pro-tein synthesis and thus propro-tein accretion. When repeated, it makes up a strategy to counteract loss of muscle mass and strength.
In the present study, we aimed to investigate skeletal muscle mass regulation in methotrexate-treated RA pa-tients, measuring leg muscle protein synthesis and ex-pression of genes involved in myogenesis, inflammatory signaling and growth/atrophy in response to resistance exercise and whey protein supplementation in RA pa-tients compared with that of control subjects. Each RA patient was carefully matched with a control subject based on age, gender, activity level and body mass index (BMI) to rule out direct effects of these parameters and focus on effects specifically related to the RA disease. The age and activity matching was important, since an impaired anabolic response - anabolic resistance - is re-ported with aging [23], and as even within the normal range of inflammatory indicators, both age and level of
physical activity plays a role and could contribute to re-ductions in muscle mass with RA.
In a rat model of RA, adjuvant-induced arthritis, re-markable changes in skeletal muscle have been demon-strated [24–30], including increased mRNA expression of tumor necrosis factor (TNF)-α, muscle ring-finger protein (MuRF1), atrogin1, insulin-like growth factor (IGF)-1, MyoD and myogenin in relation to muscle wasting and a reduced body weight gain during growth. Similar alter-ations in RA patients may underlie the muscle deterio-rations observed in these patients. However, whether expression of such anabolic or proteolytic pathway genes is altered in muscle of RA patients and how these are reg-ulated by exercise and protein intake is to our knowledge currently unknown.
In recent years, treatment of RA patients has improved resulting in better quality of life for most patients. There-fore, we included well-treated RA patients receiving the anchor disease-modifying antirheumatic drug (DMARD), methotrexate, which is first-line medical treatment for RA patients. Patients receiving biological anti-TNF-αor steroid therapy were excluded, in order to obtain a homogenous experimental group, and due to the fact that glucocorticoids are expected to markedly affect skeletal muscle per se [31]. Although the level of sys-temic inflammation in RA is somewhat reduced during antirheumatic treatment, it has been shown not to lower the level completely down to that of healthy peers [32, 33], and we anticipated that the well-treated RA patients in-cluded in this study would still have increased levels of systemic inflammation [17, 32, 34–38].
This study reports for the first time an anabolic re-sponse of myofibrillar and collagen protein synthesis and gene expression to acute resistance exercise and protein feeding in RA patients, similar to that of healthy controls. However, expression of the genes coding for TNF-α, myo-genin and hepatocyte growth factor (HGF)1 were more re-sponsive in RA patients compared to controls.
Methods Subjects
patients were classified into one of four groups (1–4) of physical activity level according to the physical activity part of the Copenhagen City Heart Study questionnaire (Østerbroundersøgelsen, [39]). Matching CON subjects had to fit into the same activity group as the correspond-ing RA patient. For inclusion of matchcorrespond-ing controls 150 candidates were screened by telephone interviews. The study was approved by the Research Ethics Committees of the Capital Region of Denmark (H-4-2011-028) and con-formed to the Declaration of Helsinki. All subjects gave written informed consent before participation. Subjects were asked to refrain from caffeine and alcohol for 1 and 3 days, respectively, prior to the experiment and to avoid exercise for the last 2 days before the experimental day.
Pretest day
Prior to the experimental day, subjects met for a pretest day for anthropometric measures, strength tests, dual-energy X-ray absorption (DXA) scanning, blood sampling, interview etc. Height was measured to the nearest centi-meter and weight to the nearest 100 g, wearing light clothes and without shoes. Waist circumference was measured as the smallest circumference between anter-ior superanter-ior iliac spine and the lower ribs, and hip cir-cumference as the largest circir-cumference around the hips, both to the nearest centimeter. Body mass index (BMI) and waist/height ratio were calculated from these
measurements. Following 10 min of supine rest, blood pressure and‘resting’heart rate were measured (Table 1a). Physical activity level of included subjects was recorded by use of the Physical Activity Scale (PAS) and converted to metabolic equivalent of task (MET) values as described by Aadahl and Jorgensen [40]. A brief dietary interview was performed to ensure that all included subjects consumed adequate protein and energy.
Body composition including lean body mass (LBM) was measured by a DXA scan (Model DPX-IQ, Lunar Corp., Madison, WI, USA) at medium speed (24 mSv). Appen-dicular lean soft tissue (ALST) was calculated as lean soft tissue in arms and legs [41]. Skeletal muscle index (SMI) was calculated as ALST/height2(H2). Furthermore fat-free mass/height2(FFM/H2) was calculated [42] (see Table 1b). One repetition maximum (1 RM) was measured in a knee extension device (Technogym, Superexecutive Line, Gambottola, Italy) at range of motion 20°–100° (0° cor-responds to full leg extension) and following individual adjustment and a brief warm-up consisting of low loads.
[image:3.595.58.547.433.725.2]Maximal voluntary contraction (MVC) in isometric knee extension was determined for each leg at 70° of knee flexion using the Good Strength device (Version 3.14 Bluetooth; Metitur Ltd, Jyväskylä, Finland) after a 5-min warm-up on a stationary bike. The subjects were seated and fastened in a rigid chair with hips and knees flexed. A leg cuff, which was connected to a strain gauge through a
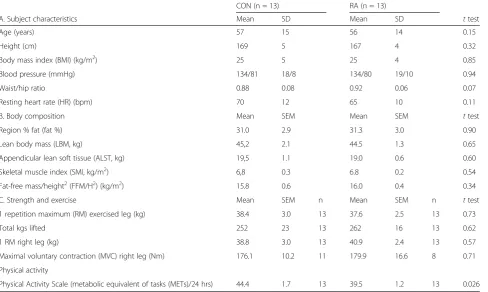
Table 1Baseline characteristics
CON (n = 13) RA (n = 13)
A. Subject characteristics Mean SD Mean SD ttest
Age (years) 57 15 56 14 0.15
Height (cm) 169 5 167 4 0.32
Body mass index (BMI) (kg/m2) 25 5 25 4 0.85
Blood pressure (mmHg) 134/81 18/8 134/80 19/10 0.94
Waist/hip ratio 0.88 0.08 0.92 0.06 0.07
Resting heart rate (HR) (bpm) 70 12 65 10 0.11
B. Body composition Mean SEM Mean SEM ttest
Region % fat (fat %) 31.0 2.9 31.3 3.0 0.90
Lean body mass (LBM, kg) 45,2 2.1 44.5 1.3 0.65
Appendicular lean soft tissue (ALST, kg) 19,5 1.1 19.0 0.6 0.60
Skeletal muscle index (SMI, kg/m2) 6,8 0.3 6.8 0.2 0.54
Fat-free mass/height2(FFM/H2) (kg/m2) 15.8 0.6 16.0 0.4 0.34
C. Strength and exercise Mean SEM n Mean SEM n ttest
1 repetition maximum (RM) exercised leg (kg) 38.4 3.0 13 37.6 2.5 13 0.73
Total kgs lifted 252 23 13 262 16 13 0.62
1 RM right leg (kg) 38.8 3.0 13 40.9 2.4 13 0.57
Maximal voluntary contraction (MVC) right leg (Nm) 176.1 10.2 11 179.9 16.6 8 0.71 Physical activity
Physical Activity Scale (metabolic equivalent of tasks (METs)/24 hrs) 44.4 1.7 13 39.5 1.2 13 0.026
rigid steel rod, was mounted on the leg just above the medial malleolus (Table 1c for strength data). Strength is expressed as moment in Nm, that is, corrected for lever arm length. The recorded moment was corrected for the effect of gravitational pull on the lower leg and foot by calibration before each measurement.
Resting blood samples were obtained by venipuncture for direct analysis of inflammatory cells and blood lipid pro-file at the Clinical Biochemistry Department, Bispebjerg Hospital, Copenhagen, using standard laboratory proce-dures. Furthermore, ethylenediaminetetraacetic acid (EDTA) plasma was stored at−80 °C pending analyses as described below.
Experimental protocol
On the experimental day, subjects arrived fasted in the morning by taxi to the Institute of Sports Medicine, Bispebjerg Hospital, Copenhagen, Denmark, where they were placed supine and remained rested. A catheter was inserted into an antecubital vein of each arm; one used for tracer infusion and one used for collection of blood sam-ples throughout the study. The trial design and sampling protocol is shown in Fig. 1. After obtaining a background blood sample, the ring-13C6-phenylalanine tracer (sterile and pyrogen-free; Cambridge Isotopes Laboratories, Andover, MA, USA) was administered as a primed (8 umol/kg LBM), continuous (8 umol/kg LBM/hr)
infusion. The tracer, which was mixed in sterile saline and sterilized through a 0.2-μm sterile disposable filter (Minisart, Sartorius Stedium Biotech GmbH, Goettingen, Germany), was infused throughout the experimental day (total infusion time 8 hrs). After 1½ hrs of tracer infusion, the first muscle biopsy was obtained from the resting leg (B; baseline). At 4 hrs the subjects moved to the exercise equipment and (after one set of warm-up knee extensions consisting of eight repetitions at 35 % of 1 RM) performed one-legged knee extension exercises consisting of ten sets of eight repetitions at 70 % of 1RM separated by a 1-min break where subjects remained seated in the knee-extensor device. Subjects were randomized to perform the exercise with their dominant or non-dominant leg. The exercise session was completed in approximately 30 min and was supervised by the experiment leader. The contralateral leg remained rested. Immediately after cessation of the exercise session (4½ hrs of tracer infusion) biopsies were obtained from both legs, at least 4 cm away from the previous biopsy. Immediately here-after a protein drink consisting of 0.5 g intact whey pro-tein isolate (Lacprodan-9224, Arla Foods Ingredients, Viby, Denmark)/kg LBM (12.5 % enriched with ring-13C6 -phenylalanine) dissolved in 190 ml water was consumed (total amount in RA and CON groups: 25.3 (0.7) and 25.7 (1.2) g (mean (SEM)), respectively). Three hours later bi-lateral biopsies were obtained, at least 4 cm away from
Fig. 1Study design. The stable isotope labeled amino acid13C
6-phenylalanine was infused throughout the study period, and fractional synthesis
[image:4.595.56.540.425.685.2]any previous biopsies. The order of biopsies along one leg, and whether the exercised or rested leg was biopsied first was randomized among RA patients whereas identical procedures were followed in the matched CON subject.
Blood samples and analyses
Venous blood samples were drawn into EDTA tubes and cooled on ice for 10 min, followed by centrifugation (10 min at 3060 g at 4 °C), and the plasma phase was stored at−80 °C until analysis.
Plasma levels of the inflammatory markers C-reactive protein (CRP), interleukin (IL)-6 and TNF-α were mea-sured using enzyme-linked immunosorbent assay (ELISA) in blood samples obtained on the pretest day and the basal blood sample from the experimental day. The mean value of these is presented. ELISA kits (CRP DuoSet DY1707, IL-6 Quantikine HS ELISA Kit HS600B and TNF-α HSTA00D) were from R&D Systems (Minneapolis, MN, USA) and procedures have been described previously [43]. Inflammatory cell profile and blood lipid profile (triglycer-ides, total cholesterol, high-density lipoprotein (HDL) and low-density lipoprotein (LDL) cholesterol) in basal blood samples was measured at the Clinical Biochemistry De-partment, Bispebjerg Hospital, Copenhagen, as previously described [43].
During the experimental day blood samples (see Fig. 1) were obtained at time points 0, 15, 90, 150, 210 and 270 min after commencement of isotope infusion and at time points +15, +30, +60, +90, +120 and +180 min after consumption of the protein drink, for determination of ring-13C6-phenylalanine enrichment and plasma glucose. Blood glucose was measured immediately using an Accu-Chek, Inform II (Roche Diagnostics, Basel, Switzerland).
Muscle biopsies
As shown in Fig. 1, a total of five biopsies (B) were ob-tained; baseline, rest, exercise (EX) 0, PROT 3 and PROT + EX 3 (at time points corresponding to 1½, 4½ and 7½ hrs of isotope infusion) providing three intervals for fractional protein synthesis rate (FSR) calculations; BASAL FSR (rest), PROT FSR (0–3 hrs after protein drink in rested leg), PROT + EX FSR (0–3 hrs after pro-tein drink in exercised leg). The same five muscle biopsies were used for gene expression analyses by real-time re-verse transcriptase polymerase chain reaction (RT-PCR) as described below. The muscle biopsies were obtained under local anesthetic (1 % lidocaine), through separate incisions at least 4 cm apart, in order to separate them as much as possible while still obtaining biopsies from rea-sonably similar areas of muscle, this has previously been shown not to affect FSR measurements [44]. The percu-taneous needle biopsy technique with a 5-mm biopsy needle [45] and manual suction was used. The biopsy was freed from visible fat and connective tissue, and
one piece immediately snap frozen (for later gene ex-pression analyses) and another piece of approximately 30 mg (range 15.1–57.5) for stable isotope enrichments was wiped clean from blood in ice-cold saline, weighed, and snap frozen. Muscle biopsies were stored at−80 °C until analyses.
Stable isotope analyses Protein fractionation
Raw skeletal muscle specimens were homogenized (Fast-prep, 120A-230; Thermo Savant, Holbrook, NY, USA) for 4 × 15 sec in 1 ml homogenization buffer (0.02 M Tris, pH 7.4, 0.15 M NaCl, 2 mM EDTA, 0.5 % Triton-X 100, 0.25 M sucrose) left overnight at 5 °C, then homog-enized once again at day 2 and left at 4 °C for 1 hr before centrifugation (20 min, 1600 g, 4 °C). The supernatant was discarded and 1.5 mL of high-salt buffer (0.7 M KCl and 0.1 M pyrophosphate) was added to the pellet, which was vortexed for 30 sec and left at 4 °C overnight. After a spin (20 min, 1600 g, 4 °C), the supernatant (myofibrillar pro-tein fraction) was transferred to new vials and the pellet (connective tissue fraction) washed once more with high-salt buffer and left for 2 hrs and centrifuged (20 min, 1600 g, 4 °C) again from which the supernatant was dis-carded. The myofibrillar proteins in the supernatant were precipitated by adding 3.45 mL ice-cold 99 % ethanol and left at 4 °C for 30 min. After spinning (20 min, 1600 g, 4 °C) the supernatant was discarded. Both myofibrillar and connective tissue protein pellets were added to 1 mL of 6 M HCl and left at 110 °C overnight to hydrolyze proteins. The analysis of protein-bound tracer abundances were carried out on the GC-C-IRMS equipment (Finnigan Delta Plus, Bremen, Germany) as described in more detail elsewhere [46].
Precursor enrichment
Fractional synthesis rate calculations
The ring-13C6-phenylalanine enrichment of the myofibril-lar and connective tissue muscle protein fractions mea-sured by GC-C-IRMS (Hewlett Packard 5890-Finnigan gas chromatography-combustion III-Finnigan Deltaplus iso-tope ratio mass spectrometry; Thermo Finnigan MAT, Bremen, Germany) were used to calculate the fractional synthesis rate (FSR) in percent per hour. Calculations are based on the incorporation rate of ring13C6-phenylalanine into muscle proteins using a standard precursor–product model as follows:
FSRð%=hrÞ ¼ΔEproduct100 EprecursorΔt
where ΔEproduct is the change in tracer enrichment of protein-bound ring13C6-phenylalanine in two biopsies from the same leg taken with a time interval ofΔt. Epre-cursor is the mean preEpre-cursor 13C6-phenylalanine enrich-ment during that time interval. Here we used venous plasma tracer enrichments as a surrogate estimate of the precursor enrichment.
Whole-body rate of appearance (Ra) of 13C6 -phenyl-alanine (an estimate of whole-body protein breakdown rate) was calculated as:
Ra¼Infusion rate E plateau
Where Eplateau was the weighted average of venous plasma enrichment throughout the basal or protein (PROT) + exercise (EX) periods or the two combined.
RNA extraction
RNA was extracted as described in [47]. Essentially, ap-proximately 15 mg of frozen muscle tissue from each biopsy was homogenized in TRI Reagent (Molecular Research Center, Cincinnati, OH, USA), using 1-bromo-3-chloropropane for phase separation and isopropanol to precipitate RNA. The RNA pellet was washed in ethanol and dissolved in RNase-free water. RNA concentrations were determined by spectroscopy at 260 nm. Quality of the RNA was checked by gel electrophoresis and spectro-photometer ratios at 260/240 nm (acceptable range 1.2–1.6 at pH 8) and 260/280 nm (1.8–2.0 at pH 7.5–8.0).
Real-time RT PCR analysis
Expression of a total of 26 different genes was measured (see Table 2 for full list) belonging to the following groups; satellite cell regulators and inflammation, heat shock proteins, myogenic regulatory factors, atrogenes and cytokines and their receptors.
Total RNA (500 ng from each muscle sample) was con-verted into cDNA in 20 ul using the OmniScript reverse
transcriptase (Qiagen, Valencia, CA, USA) according to the manufacturer’s protocol.
For each target mRNA, 0.25 ul cDNA was amplified in a 25-ul SYBR Green PCR reaction containing 1 × Quan-titect SYBR Green Master Mix (Qiagen) and 100 nM of each primer (Table 2). The amplification was monitored real time using the MX3005P real-time PCR machine (Stratagene, Santa Clara, CA, USA). The threshold cycle (Ct) values were related to standard curves made with PCR products to determine the relative difference between the unknown samples, accounting for the PCR efficiency. The specificity of the PCR products was confirmed by dissociation curve analysis after amplification. All mRNA data were normalized to ribosomal protein, large, P0 (RPLP0). For normalization control, glyceraldehyde-3-phosphate dehydrogenase (GAPDH), see Additional file 1. Baseline data (1.5 hrs rest, relative to mean CON) are shown in Additional file 2. mRNA expression data are presented as fold changes relative to individual baseline values.
Statistical analysis
Results are reported as mean (SE) unless otherwise stated. Protein synthesis and gene expression data were analyzed by two-way repeated-measures (RM) ANOVA (SigmaPlot 12.3, Systat Software Inc, San Jose, CA, USA) and Student-Newman-Keuls (SNK) post hoc test with cor-rection for multiple comparisons. Significant effects of group (CON vs. RA) or biopsy and interaction (group × biopsy) are shown on graphs at a significance level of
p < 0.05.P values ≤0.1 are also shown on graphs, for trends. All mRNA data were log-transformed for stat-istical analyses and shown as geometric mean ± back-transformed SE. For some mRNA targets, the pattern of missing data led to exclusion of subject pairs from the statistical analyses, resulting in exclusion of the following number of subject pairs; IL1β= 4; IGF-IEc = 1; IL1R = 1; cmet = 1. All other data (with only a single data point per subject) were compared by a paired two-tailed
ttest (Prism 6.02 for Windows, GraphPad Software Inc, La Jolla, CA, USA). Plasma ELISA data were log-transformed for statistical analyses.
Results and discussion Baseline characteristics
As shown in Fig. 2, CRP was higher in the RA patients (2.25 (0.50) mg/l) than in CON subjects (1.07 (0.25) mg/l;
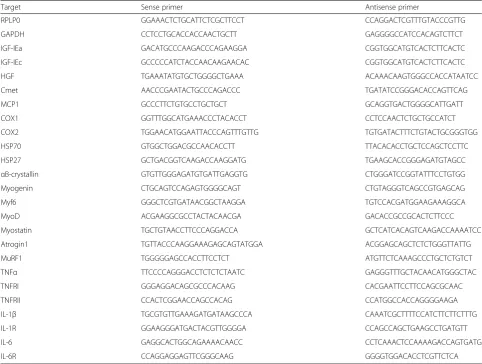
Table 2Primers used for real-time RT-PCR
Target Sense primer Antisense primer
RPLP0 GGAAACTCTGCATTCTCGCTTCCT CCAGGACTCGTTTGTACCCGTTG
GAPDH CCTCCTGCACCACCAACTGCTT GAGGGGCCATCCACAGTCTTCT
IGF-IEa GACATGCCCAAGACCCAGAAGGA CGGTGGCATGTCACTCTTCACTC
IGF-IEc GCCCCCATCTACCAACAAGAACAC CGGTGGCATGTCACTCTTCACTC
HGF TGAAATATGTGCTGGGGCTGAAA ACAAACAAGTGGGCCACCATAATCC
Cmet AACCCGAATACTGCCCAGACCC TGATATCCGGGACACCAGTTCAG
MCP1 GCCCTTCTGTGCCTGCTGCT GCAGGTGACTGGGGCATTGATT
COX1 GGTTTGGCATGAAACCCTACACCT CCTCCAACTCTGCTGCCATCT
COX2 TGGAACATGGAATTACCCAGTTTGTTG TGTGATACTTTCTGTACTGCGGGTGG
HSP70 GTGGCTGGACGCCAACACCTT TTACACACCTGCTCCAGCTCCTTC
HSP27 GCTGACGGTCAAGACCAAGGATG TGAAGCACCGGGAGATGTAGCC
αB-crystallin GTGTTGGGAGATGTGATTGAGGTG CTGGGATCCGGTATTTCCTGTGG
Myogenin CTGCAGTCCAGAGTGGGGCAGT CTGTAGGGTCAGCCGTGAGCAG
Myf6 GGGCTCGTGATAACGGCTAAGGA TGTCCACGATGGAAGAAAGGCA
MyoD ACGAAGGCGCCTACTACAACGA GACACCGCCGCACTCTTCCC
Myostatin TGCTGTAACCTTCCCAGGACCA GCTCATCACAGTCAAGACCAAAATCC
Atrogin1 TGTTACCCAAGGAAAGAGCAGTATGGA ACGGAGCAGCTCTCTGGGTTATTG
MuRF1 TGGGGGAGCCACCTTCCTCT ATGTTCTCAAAGCCCTGCTCTGTCT
TNFα TTCCCCAGGGACCTCTCTCTAATC GAGGGTTTGCTACAACATGGGCTAC
TNFRI GGGAGGACAGCGCCCACAAG CACGAATTCCTTCCAGCGCAAC
TNFRII CCACTCGGAACCAGCCACAG CCATGGCCACCAGGGGAAGA
IL-1β TGCGTGTTGAAAGATGATAAGCCCA CAAATCGCTTTTCCATCTTCTTCTTTG
IL-1R GGAAGGGATGACTACGTTGGGGA CCAGCCAGCTGAAGCCTGATGTT
IL-6 GAGGCACTGGCAGAAAACAACC CCTCAAACTCCAAAAGACCAGTGATG
IL-6R CCAGGAGGAGTTCGGGCAAG GGGGTGGACACCTCGTTCTCA
Abbreviations: RT-PCRreal-time reverse transcriptase-polymerase chain reaction,RPLP0large ribosomal protein P0,GAPDHglyceraldehyde-3-phosphate dehydrogenase,
IGFinsulin-like growth factor,HGFhepatocyte growth factor,MCP1monocyte chemoattractant protein = CCL2,COXcyclooxygenase,HSPheat shock protein,MuRF1
muscle ring finger protein 1,TNFtumor necrosis factor,ILinterleukin,Rreceptor The HGF primers are specific for the two largest splice variants including the SP domain
A
B
C
[image:7.595.61.539.563.694.2][32, 35, 37, 38, 48, 49], but were similar to the moderate levels observed by Crowson et al. [50]. Most likely, the limited elevation of systemic inflammatory markers em-phasizes the very well-functioning state of the RA patients participating in this study.
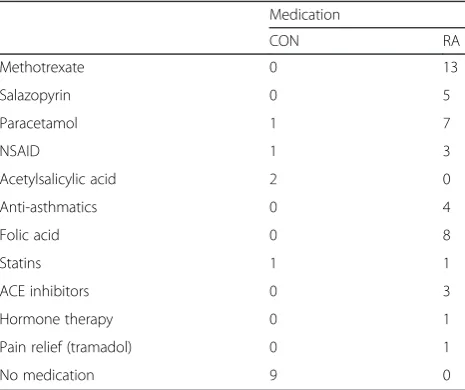
The overview of subject characteristics in Table 1 re-veals many similarities between RA and CON groups. However, waist/hip ratio (Table 1a) tended to be higher in RA than CON (p = 0.07). Among RA patients, six were smokers (5–20 cigarettes/day, mean 10) and among con-trols four were smokers (1–17 cigarettes/day, mean 10). Use of medication in the two groups is shown in Table 3. These records show that all RA patients use medication of some type, mostly DMARDs like methotrexate (all 13 patients) and salazopyrin (5/13 patients). Pain relief medication was frequently used by RA patients, mostly paracetamol (7/13 patients) and nonsteroidal anti-inflammatory drugs (NSAIDs) (3/13) whereas only a sin-gle CON participant reported use of each of these drugs. Most RA patients had some comorbidity (see Additional file 3 for complete list), except for two patients. No sub-jects from the CON group used any rheumatic drugs and had only a minor intake of painkillers. Seven CON subjects were completely free from comorbidities. These differences in comorbidities and medication could be con-founding the systemic inflammation data (Fig. 2), since some comorbidities may contribute to an elevation of in-flammatory markers while antirheumatic medication is likely to reduce these markers. Body composition mea-sures (Table 1b) were not different between RA and CON, likewise, no differences in knee extensor muscle strength (Table 1c) measured as one repetition maximum (1 RM) and maximal voluntary contraction (MVC) were observed between groups. The total number of kg lifted during the
experimental acute exercise session was not different be-tween groups (Table 1c). When estimated by PAS, physical activity level turned out higher in CON than in RA (p= 0.026). The similarities in body composition between RA patients and CON were somewhat surprising and in con-trast to previous reports of reduced muscle mass [2, 16, 42] and increased fat accumulation in RA patients [51, 52]. Furthermore, the similar muscle strength between RA and CON indicate that the patients were well-functioning in comparison to those participating in previous studies [16, 17, 38, 53, 54]. Data on blood lipid profile and circu-lating inflammatory cells is given in Table 4. Although metabolic changes are usually reported at all stages of RA disease [19], we detected neither differences between RA and CON in blood lipid profile, blood pressure, metabolic syndrome biomarkers, fasting glucose, nor in the circulat-ing inflammatory cell profile for all of which changes have previously been reported in RA patients [19, 48, 50]. Again, this reflects the clinically well-controlled condition of the participating patients. Throughout the experimental day, blood glucose level was not different between groups and was stable around 5 mmol/l (Fig. 3 and Table 4b).
Muscle protein synthesis
[image:8.595.57.290.521.716.2]Fractional synthesis rate (FSR) of muscle myofibrillar and connective tissue protein is shown in Fig. 4. The myofibrillar protein synthesis was enhanced in response to protein intake (p < 0.05) and was further increased when combined with heavy resistance exercise (p< 0.001). This response was similar in CON and RA groups. Con-nective tissue protein synthesis was increased after exer-cise combined with protein intake (p< 0.001), but not by protein intake alone (p> 0.1). Irrespective of state (fasting, protein fed alone or in combination with exercise), con-nective tissue FSR tended to be higher in RA than CON (p= 0.060). Plasma tracer enrichment (Fig. 5) was lower Table 3Medication
Medication
CON RA
Methotrexate 0 13
Salazopyrin 0 5
Paracetamol 1 7
NSAID 1 3
Acetylsalicylic acid 2 0
Anti-asthmatics 0 4
Folic acid 0 8
Statins 1 1
ACE inhibitors 0 3
Hormone therapy 0 1
Pain relief (tramadol) 0 1
No medication 9 0
[image:8.595.306.538.547.716.2]Abbreviations: CONcontrol subjects,RArheumatoid arthritis patients,NSAID nonsteroidal anti-inflammatory drug,ACEangiotensin-converting enzyme
Table 4Inflammaroty cells & Blood lipid profile
CON (n = 13) RA (n = 13)
A. Inflammatory cell profile Mean SEM Mean SEM ttest Leucocytes (total, x109/l) 7.3 0.4 6.7 0.7 0.53
Neutrohils (x109/l) 4.7 0.3 4.1 0.6 0.44
Lymphocytes (x109/l) 1.81 0.13 1.82 0.19 0.96
Monocytes (x109/l) 0.57 0.05 0.55 0.05 0.77
B. Blood lipid profile
Triglycerides (mmol/l) 1.2 0.1 1.4 0.2 0.41 Total cholesterol (mmol/l) 5.3 0.3 5.5 0.3 0.75 HDL cholesterol (mmol/l) 1.7 0.1 1.6 0.1 0.44 LDL cholesterol (mmol/l) 3.1 0.2 3.4 0.3 0.28 Fasting glucose (mmol/l) 5.0 0.2 5.3 0.2 0.66
in RA vs. CON throughout the infusion period (p= 0.028) (ranged between 0.11 and 0.14 in RA and 0.12 and 0.18 in CON). Whole-body protein breakdown rate (rate of tracer amino acid appearance) was reduced following protein in-take (PROT) and one-legged resistance exercise (EX) (BASAL = 64.4 (SE 3.8) and 71.5 (SE 3.2) and PROT + EX = 58.5 (SE 2.4) and 63.6 (SE 2.1) μmol/kg LBM/hr in CON and RA, respectively; timep< 0.001) and tended to be higher in RA than in CON as an average over the entire study period (TOTAL; p = 0.11). However, the whole-body assessment of protein turnover is neither protein nor tissue specific and we cannot say whether the tendency to a higher protein turnover rate in RA patients is a general phenomenon or may be related to a specific tissue (i.e., skeletal muscle) or protein type.
We showed a comparable basal muscle protein synthe-sis rate in RA and CON (Fig. 4a and b). Muscle protein turnover in patients with RA has to our knowledge been investigated in only one human study previously [55], showing that the resting, fasted FSR in RA patients not receiving steroid therapy was similar to osteoarthritis pa-tients serving as controls. Further, the present study shows for the first time an anabolic response (elevated myofibril-lar FSR) to acute whey protein feeding alone, which was amplified when combined with acute resistance exercise in patients with RA. Additionally, this response was not different from that observed in healthy control subjects matched for age, gender, BMI and physical activity. Appar-ently, in our RA patients the connective tissue fraction was less responsive to nutritional intervention than the myofibrillar fraction, which is in accordance with previous findings [56]. For further details of the anabolic response to acute exercise and protein feeding, protein expression
and signaling analyses of targets of the Akt-mTOR signal-ing pathway would have been relevant, however, since we observed similar FSR responses in RA and CON, we chose to focus on transcriptional regulation of genes involved in other aspects of muscle adaptation as described in the following section.
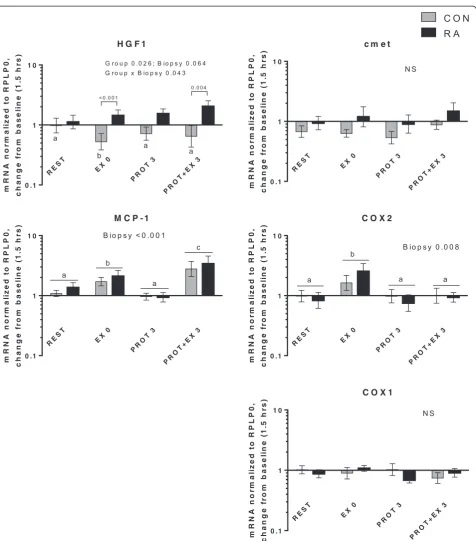
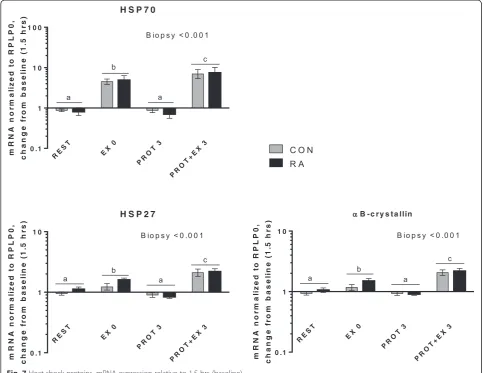
Muscle gene expression
In the present study, expression of genes related to in-flammatory signaling, myogenesis and muscle growth/ atrophy as well as heat shock proteins responded similarly in RA and CON. No differences were observed in basal gene expression level between RA and CON (Additional file 2). Changes in mRNA expression from baseline is shown in Figs. 6, 7, 8, 9 and 10, divided into subgroups re-lated to satellite cell (SC) regulators and inflammation (Fig. 6), heat shock proteins (Fig. 7), myogenic regulatory factors (Fig. 8), atrogenes (Fig. 9), as well as cytokines and receptors (Fig. 10). As shown in Fig. 6, HGF1 expression was overall higher in RA vs. CON (Group,p= 0.026), spe-cifically HGF1 expression was higher in RA patients than CON at EX0 and PROT + EX3 (p< 0.001 andp= 0.004, respectively). The higher expression of HGF1 in RA than CON indicate an increased sensitivity toward signaling via this pathway in RA patients, which could be located to the skeletal muscle stem cells, SCs, since HGF1 signaling is involved in activation of SC [57, 58], although our gene expression analysis is not specific to the SCs. HGF1 acti-vates SCs via binding to the cmet receptor [59].
[image:9.595.59.538.89.297.2]CCL2) was induced by exercise (but not protein feeding), both acutely (EX 0,p= 0.02) and even more 3 hrs later (p < 0.001) in both groups combined. This indicates that it is involved in the adaptive response to resistance exercise. Potentially, it plays a role in crosstalk between inflammatory cells (macrophages) and SC, as indicated
by its colocalization with these cells [60]. Cyclooxygen-ase 2 (COX2) expression was induced immediately after exercise (p= 0.011), in line with previous reports [61, 62], although at later time points. In contrast, we and others have previously reported COX2 induction only when exer-cise was combined with COX inhibition [47, 63]. Taken
A
B
[image:10.595.60.537.90.594.2]together, we observed some indications on involvement of HGF1, MCP-1 and COX2 in the adaptive response to exercise, however, differential regulation between RA and CON was only observed for HGF1.
In Fig. 7 mRNA expression of heat shock proteins (HSPs) is shown. All three HSPs (HSP70, HSP27 and αB-crystallin) were induced by exercise both immediately after (EX 0,p< 0.001) and 3 hrs later (PROT + EX 3,p< 0.001), but not by protein intake. The induction of HSPs a few minutes after exercise (EX0), suggests that the HSP response to unaccustomed exercise is even more acute than previously shown (as discussed in [64]) and that muscle of RA patients is equally responsive as in CON.
Myogenic regulatory factors (Fig. 8) were induced by exercise combined with protein intake but not by protein intake alone. Myogenin expression was higher in RA than CON (Group; p = 0.021), pointing at an increased re-sponsiveness in RA patients, although this was not ap-parent for the other myogenic regulatory factors Myf6 and MyoD. Myf6 expression was increased both imme-diately after exercise (EX 0, p < 0.001) and 3 hrs later (PROT + EX 3,p< 0.001). Expression of MyoD was in-creased only 3 hrs after exercise (PROT + EX 3,p< 0.001). In general, myogenic regulatory factors were induced by exercise, and mainly after 3 hrs compared with immedi-ately after, which is in line with previous observations
A
B
Fig. 5Enrichment and rate of appearance of13C
6-phenylalanine.aPlasma13C6-phenylalanine (13C6-Phe) enrichment (tracer-to-tracee ratio (TTR))
during the entire infusion period. Mean ± SE, n = 13.bRate of appearance (μmol/kg LBM/hr) of13C
6Phe (Ra) during the basal period (BASAL,
[image:11.595.57.536.90.512.2][65, 66] and the response was not different between RA and CON. Nor did we observe a difference in resting gene expression between RA and CON (Additional file 2) in the current study. In muscle from a rat model of RA (adjuvant-induced arthritis) both protein and mRNA
expression of MyoD and myogenin were increased at rest, however, this was not investigated in relation to exercise [24–26].
[image:12.595.61.538.84.626.2]muscle mass, myostatin, was downregulated 3 hrs after exercise + protein (PROT + EX 3,p< 0.001) and responds to exercise in an overall similar manner in RA patients and CON. Atrogin1 was downregulated 3 hrs after protein intake alone (PROT 3,p< 0.001) and in combination with exercise (PROT + EX 3,p< 0.001), whereas MuRF1 was downregulated 3 hrs after protein intake alone (PROT 3,
p< 0.001), but upregulated 3 hrs after exercise combined with protein intake (PROT + EX3,p< 0.001). Also for the atrogenes, no impact of RA could be observed. In muscle of the rat model of RA, mRNA expression of MuRF1 and atrogin1 was markedly increased [27, 29, 30], however, this difference was not apparent in our human subjects. Simi-larly, COX2 expression was markedly increased in muscle of arthritic rats, which was not reproduced in the RA pa-tients of the present study either (Fig. 6).
Figure 10 displays mRNA expression of selected cyto-kines and their receptors. TNF-α expression was higher in RA than in CON across all biopsy points (Group,p= 0.036) and was induced immediately after exercise (EX 0, p < 0.001); the former is in line with the increased
[image:13.595.56.541.90.463.2]TNFR1 expression was slightly increased 3 hrs after protein + exercise (PROT + EX 3, p < 0.001), whereas no changes were observed for TNFR2 or IL-1β. Induction of TNFR expression 3 hrs after exercise + protein has to our knowledge not been reported before, although higher levels of TNFR1 gene expression was recently reported in older (61 and 76 years) compared to younger subjects (40 years) [69], both at rest and 24 hrs after acute resist-ance exercise. Generally, regulation of TNF receptors in human muscle is not well understood. Both TNFR1 and 2 were expressed at high levels in the present study, while correlations were observed between TNFR1 and 2 expres-sion (r = 0.57, p= 0.003, data not shown). Inflammatory signaling via IL-6, IL-6R and IL-1R was induced by ex-ercise with an early upregulation of IL-6 immediately after exercise (EX 0, p< 0.001) and to a lesser extent in the resting leg (REST,p< 0.001) whereas the recep-tors were upregulated 3 hrs after exercise + protein (PROT + EX 3, p < 0.001). None of these responses were different between RA and CON, indicating a normal cytokine response to acute resistance exercise in RA patients.
At baseline no differences in mRNA expression between RA and CON were observed for any of the investigated target genes (Additional file 2), although in skeletal muscle of arthritic rats, marked changes in gene expression in-duced by the disease have been consistently reported.
Thus, our human data from RA patients do not confirm the upregulation of muscle regulatory, inflammatory and catabolic markers found in animal models of RA, which is in line with the overall healthy state and preserved ana-bolic response of RA patients in the present study.
[image:14.595.59.540.90.431.2]response to exercise in elderly muscle, which could also contribute to the muscle deficits in RA patients. However, apart from a more pronounced induction of TNF-α, HGF1 and myogenin in RA vs. CON, this was not the case in the present study. Previously, knowledge about regula-tion of muscle gene expression in RA has relied only on animal studies, but from the current study we can now add human data.
Taken together, our gene expression data indicate that specific targets involved in muscle and SC regulation (HGF1, myogenin and TNF-α) are induced to a larger ex-tent in RA patients than in healthy CON subjects, how-ever, the majority of genes investigated showed similar responses in RA vs. CON indicating that skeletal muscle tissue of RA patients responds equally well to an acute ex-ercise stimulus compared to healthy CON subjects.
Limitations
Keeping in mind that results may not apply for RA pa-tients in general, the present study indicate that skeletal muscle of RA patients does not differ markedly from healthy control muscle and that they respond to protein
intake alone and in combination with exercise in a simi-lar way. The patients participating in the present study were a selected group of well-functioning RA patients, and thus no changes in either muscle strength or muscle mass were detected, which reduces the external validity of the study and leaves the question open of how RA pa-tients with highly elevated systemic inflammatory levels and/or cachexia are characterized with respect to molecu-lar (signaling) regulators of muscle mass and muscle pro-tein turnover in response to the same interventions.
Conclusions
[image:15.595.58.541.89.434.2]Additional files
Additional file 1:Normalization control.GAPDH gene expression data normalized to RPLP0 and individual baseline values, log-transformed for statistical analyses and shown on a logarithmic scale as geometric mean ± SEM.Black barsdenote rheumatoid arthritis patients (RA, n = 13) and
grey barshealthy controls (CON, n = 13). (PDF 173 kb)
Additional file 2:mRNA expression at baseline.Baseline expression of all targets is expressed relative to mean healthy CON at baseline. Gene expression data were normalized to RPLP0, log-transformed for statistical analyses and shown on a logarithmic scale as geometric mean ± SEM.Black
barsdenote rheumatoid arthritis patients (RA, n = 13) andgrey bars healthy controls (CON, n = 13). No significant differences were observed between groups. (PDF 177 kb)
Additional file 3:Comorbidities.Table of reported comorbidities in rheumatoid arthritis patients (RA) and healthy controls (CON). The number of subjects reporting each comorbidity is given. (PDF 179 kb)
Abbreviations
ACR:American College of Rheumatology; ALST: appendicular lean soft tissue; B: baseline; BMI: body mass index; CON: control; COPD: chronic obstructive pulmonary disease; COX: cyclooxygenase; CRP: C-reactive protein; DAS28: Disease Activity Score in 28 joints; DMARD: disease-modifying antirheumatic drug; DXA: dual-energy X-ray absorption; E: enrichment; EDTA: ethylenediaminetetraacetic acid; ELISA: enzyme-linked immunosorbent assay; EX: exercise; FFM: fat-free mass; FSR: fractional synthesis rate; GAPDH: glyceraldehyde-3-phosphate dehydrogenase; H: height; HDL: high-density lipoprotein; HGF: hepatocyte growth factor; HSP: heat shock protein; IGF: insulin-like growth factor; IL: interleukin; LBM: lean body mass; LDL: low-density lipoprotein; MCP1: monocyte chemoattractant protein = CCL2; MET: metabolic equivalent of task; MuRF1: muscle ring finger protein 1; MVC: maximal voluntary contraction; NSAIDs: nonsteroidal anti-inflammatory drugs; PAS: Physical Activity Scale; PROT: protein; R: receptor; Ra: rate of appearance; RA: rheumatoid arthritis; RM: repetition maximum; RPLP0: large ribosomal protein P0; RT-PCR: reverse transcriptase-polymerase chain reaction; SCs: satellite cells; SMI: skeletal muscle index; TNF: tumor necrosis factor; TTR: tracer-to-tracee ratio.
Competing interests
The authors declare that they have no competing interests.
Authors’contributions
URM conceived of the study, participated in its design, carried out the study, data acquisition, data analyses and interpretation, and wrote the manuscript. KD participated in the design of the study, acquisition and interpretation of data, and revised the manuscript. MBA participated in the recruitment of subjects, execution of the study and acquisition of data. AB and NMMC participated in execution of the study and acquisition of data, and revised the manuscript. IJS participated in subject recruitment, coordination of the study and interpretation of data, and revised the manuscript. PS performed gene expression analyses and analysis and interpretation of data, and wrote the manuscript. MK participated in the conception of the study, interpretation of data, and wrote the manuscript. LH participated in the design of the study, performed stable isotope analyses and interpretation of data, and wrote the manuscript. All authors have read and approved the final version of the manuscript.
Acknowledgements
Camilla Brink Sørensen, Ann-Marie Sedstrøm, Ida Trondhjem Haakansson and Ann-Christina Reimann are thanked for their expert technical assistance. Funding is greatly acknowledged from The Danish Medical Research Council (10–094021), Nordea Healthy Aging, The Danish Rheumatism Association (R93-A1669), and Arla Foods Ingredients who provided the Lacprodan whey protein.
Author details
1Institute of Sports Medicine, Department of Orthopaedic Surgery M,
Bispebjerg Hospital and Center for Healthy Aging, Faculty of Health and Medical Sciences, University of Copenhagen, Bispebjerg Hospital bldg 8,
Bispebjerg Bakke 23, 2400 Copenhagen NV, Denmark.2Section for Sports
Science, Institute of Public Health, Aarhus University, Dalgas Avenue 4, 8000 Aarhus C, Denmark.3Copenhagen Center for Arthritis Research (COPECARE),
Center for Rheumatology and Spine Diseases, Centre of Head and Orthopaedics, Rigshospitalet, Glostrup Hospital, University of Copenhagen, Nordre Ringvej 57, 2600 Glostrup, Denmark.4Department of Biomedical Sciences, Faculty of Health and Medical Sciences, University of Copenhagen, Blegdamsvej 3B, 2200 Copenhagen, Denmark.
Received: 21 January 2015 Accepted: 17 August 2015
References
1. American College of Rheumatology Subcommittee on Rheumatoid Arthritis G. Guidelines for the management of rheumatoid arthritis: 2002 Update. Arthritis Rheum. 2002;46:328–46.
2. Summers GD, Deighton CM, Rennie MJ, Booth AH. Rheumatoid cachexia: a clinical perspective. Rheumatology. 2008;47:1124–31.
3. Roubenoff R. Rheumatoid cachexia: a complication of rheumatoid arthritis moves into the 21st century. Arthritis Res Ther. 2009;11:108.
4. Rieu I, Magne H, Savary-Auzeloux I, Averous J, Bos C, Peyron MA, et al. Reduction of low grade inflammation restores blunting of postprandial muscle anabolism and limits sarcopenia in old rats. J Physiol. 2009;587:5483–92.
5. Balage M, Averous J, Remond D, Bos C, Pujos-Guillot E, Papet I, et al. Presence of low-grade inflammation impaired postprandial stimulation of muscle protein synthesis in old rats. J Nutr Biochem. 2010;21:325–31. 6. van Hees HW, Schellekens WJ, Linkels M, Leenders F, Zoll J, Donders R, et al.
Plasma from septic shock patients induces loss of muscle protein. Crit Care. 2011;15:R233.
7. He WA, Berardi E, Cardillo VM, Acharyya S, Aulino P, Thomas-Ahner J, et al. NF-kappaB-mediated Pax7 dysregulation in the muscle microenvironment promotes cancer cachexia. J Clin Invest. 2013;123:4821–35.
8. Op den Kamp CM, Langen RC, Snepvangers FJ, de Theije CC, Schellekens JM, Laugs F, et al. Nuclear transcription factor kappa B activation and protein turnover adaptations in skeletal muscle of patients with progressive stages of lung cancer cachexia. Am J Clin Nutr. 2013;98:738–48.
9. Degens H, Alway SE. Control of muscle size during disuse, disease, and aging. Int J Sports Med. 2006;27:94–9.
10. Peterson JM, Bakkar N, Guttridge DC. NF-kappaB signaling in skeletal muscle health and disease. Curr Top Dev Biol. 2011;96:85–119.
11. Bonaldo P, Sandri M. Cellular and molecular mechanisms of muscle atrophy. Dis Moel Mech. 2013;6:25–39.
12. Marquis K, Debigare R, Lacasse Y, LeBlanc P, Jobin J, Carrier G, et al. Midthigh muscle cross-sectional area is a better predictor of mortality than body mass index in patients with chronic obstructive pulmonary disease. Am J Respir Crit Care Med. 2002;166:809–13.
13. Prado CM, Lieffers JR, McCargar LJ, Reiman T, Sawyer MB, Martin L, et al. Prevalence and clinical implications of sarcopenic obesity in patients with solid tumours of the respiratory and gastrointestinal tracts: a population-based study. Lancet Oncol. 2008;9:629–35.
14. Langen RC, Gosker HR, Remels AH, Schols AM. Triggers and mechanisms of skeletal muscle wasting in chronic obstructive pulmonary disease. Int J Biochem Cell Biol. 2013;45:2245–56.
15. D'Souza DM, Al-Sajee D, Hawke TJ. Diabetic myopathy: impact of diabetes mellitus on skeletal muscle progenitor cells. Front Physiol. 2013;4:379. 16. Baker JF, Von Feldt J, Mostoufi-Moab S, Noaiseh G, Taratuta E, Kim W, et al.
Deficits in muscle mass, muscle density, and modified associations with fat in rheumatoid arthritis. Arthritis Care Res. 2014;66:1612–8.
17. Beenakker KG, Ling CH, Meskers CG, de Craen AJ, Stijnen T, Westendorp RG, et al. Patterns of muscle strength loss with age in the general population and patients with a chronic inflammatory state. Ageing Res Rev. 2010;9:431–6. 18. Stenstrom CH, Minor MA. Evidence for the benefit of aerobic and strengthening
exercise in rheumatoid arthritis. Arthritis Rheum. 2003;49:428–34.
19. Kerekes G, Nurmohamed MT, Gonzalez-Gay MA, Seres I, Paragh G, Kardos Z, et al. Rheumatoid arthritis and metabolic syndrome. Nat Rev Rheumatol. 2014;10:691–6.
21. Ferraz-Amaro I, Garcia-Dopico JA, Medina-Vega L, Gonzalez-Gay MA, Diaz-Gonzalez F. Impaired beta cell function is present in nondiabetic rheumatoid arthritis patients. Arthritis Res Ther. 2013;15:R17.
22. Sokka T, Abelson B, Pincus T. Mortality in rheumatoid arthritis: 2008 update. Clin Exp Rheumatol. 2008;26:S35–61.
23. Burd NA, Gorissen SH, van Loon LJ. Anabolic resistance of muscle protein synthesis with aging. Exerc Sport Sci Rev. 2013;41:169–73.
24. Castillero E, Martin AI, Lopez-Menduina M, Granado M, Villanua MA, Lopez-Calderon A. IGF-I system, atrogenes and myogenic regulatory factors in arthritis induced muscle wasting. Mol Cell Endocrinol. 2009;309:8–16. 25. Castillero E, Martin AI, Lopez-Menduina M, Villanua MA, Lopez-Calderon A.
Eicosapentaenoic acid attenuates arthritis-induced muscle wasting acting on atrogin-1 and on myogenic regulatory factors. Am J Physiol Regul Integr Comp Physiol. 2009;297:R1322–31.
26. Castillero E, Nieto-Bona MP, Fernandez-Galaz C, Martin AI, Lopez-Menduina M, Granado M, et al. Fenofibrate, a PPAR{alpha} agonist, decreases atrogenes and myostatin expression and improves arthritis-induced skeletal muscle atrophy. Am J Physiol Endocrinol Metab. 2011;300:E790–9.
27. Granado M, Martin AI, Priego T, Lopez-Calderon A, Villanua MA. Tumour necrosis factor blockade did not prevent the increase of muscular muscle RING finger-1 and muscle atrophy F-box in arthritic rats. J Endocrinol. 2006;191:319–26.
28. Granado M, Priego T, Martin AI, Vara E, Lopez-Calderon A, Angeles VM. Anti-tumor necrosis factor agent PEG-sTNFRI improves the growth hormone/insulin-like growth factor-I system in adjuvant-induced arthritic rats. Eur J Pharmacol. 2006;536:204–10.
29. Granado M, Martin AI, Villanua MA, Lopez-Calderon A. Experimental arthritis inhibits the insulin-like growth factor-I axis and induces muscle wasting through cyclooxygenase-2 activation. Am J Physiol Endocrinol Metab. 2007;292:E1656–65.
30. Lopez-Menduina M, Martin AI, Castillero E, Villanua MA, Lopez-Calderon A. Systemic IGF-I administration attenuates the inhibitory effect of chronic arthritis on gastrocnemius mass and decreases atrogin-1 and IGFBP-3. Am J Physiol Regul Integr Comp Physiol. 2010;299:R541–51.
31. Schakman O, Kalista S, Barbe C, Loumaye A, Thissen JP. Glucocorticoid-induced skeletal muscle atrophy. Int J Biochem Cell Biol. 2013;45:2163–72. 32. Metsios GS, Stavropoulos-Kalinoglou A, Douglas KM, Koutedakis Y, Nevill AM, Panoulas VF, et al. Blockade of tumour necrosis factor-alpha in rheumatoid arthritis: effects on components of rheumatoid cachexia. Rheumatology. 2007;46:1824–7.
33. Hetland ML, Jensen DV, Krogh NS. Monitoring patients with rheumatoid arthritis in routine care: experiences from a treat-to-target strategy using the DANBIO registry. Clin Exp Rheumatol. 2014;32:141–6.
34. Rall LC, Rosen CJ, Dolnikowski G, Hartman WJ, Lundgren N, Abad LW, et al. Protein metabolism in rheumatoid arthritis and aging. Effects of muscle strength training and tumor necrosis factor alpha. Arthritis Rheum. 1996;39:1115–24. 35. Marcora SM, Chester KR, Mittal G, Lemmey AB, Maddison PJ. Randomized
phase 2 trial of anti-tumor necrosis factor therapy for cachexia in patients with early rheumatoid arthritis. Am J Clin Nutr. 2006;84:1463–72. 36. Valle Y, Ledezma-Lozano IY, Torres-Carrillo N, Padilla-Gutierrez JR,
Navarro-Hernandez RE, Vazquez-Del Mercado M, et al. Circulating TNFRI and TNFRII levels correlated with the disease activity score (DAS28) in rheumatoid arthritis. Scand J Rheumatol. 2009;38:332–5.
37. Metsios GS, Stavropoulos-Kalinoglou A, Treharne GJ, Nevill AM, Sandoo A, Panoulas VF, et al. Disease activity and low physical activity associate with number of hospital admissions and length of hospitalisation in patients with rheumatoid arthritis. Arthritis Res Ther. 2011;13:R108.
38. Bearne LM, Scott DL, Hurley MV. Exercise can reverse quadriceps sensorimotor dysfunction that is associated with rheumatoid arthritis without exacerbating disease activity. Rheumatology. 2002;41:157–66. 39. Østerbroundersøgelsen http://www.si-folkesundhed.dk/upload/
6_østerbroundersøgelsen.pdf.
40. Aadahl M, Jorgensen T. Validation of a new self-report instrument for measuring physical activity. Med Sci Sports Exerc. 2003;35:1196–202. 41. Kim J, Wang Z, Heymsfield SB, Baumgartner RN, Gallagher D. Total-body
skeletal muscle mass: estimation by a new dual-energy X-ray absorptiometry method. Am J Clin Nutr. 2002;76:378–83.
42. Arshad A, Rashid R, Benjamin K. The effect of disease activity on fat-free mass and resting energy expenditure in patients with rheumatoid arthritis versus noninflammatory arthropathies/soft tissue rheumatism. Modern Rheumatol. 2007;17:470–5.
43. Mikkelsen UR, Couppe C, Karlsen A, Grosset JF, Schjerling P, Mackey AL, et al. Life-long endurance exercise in humans: circulating levels of inflammatory markers and leg muscle size. Mech Ageing Dev. 2013;134:531–40.
44. Volpi E, Chinkes DL, Rasmussen BB. Sequential muscle biopsies during a 6-h tracer infusion do not affect human mixed muscle protein synthesis and muscle phenylalanine kinetics. Am J Physiol Endocrinol Metab. 2008;295:E959–63. 45. Bergstrom J. Percutaneous needle biopsy of skeletal muscle in physiological
and clinical research. Scand J Clin Lab Invest. 1975;35:609–16.
46. Bechshoeft R, Dideriksen KJ, Reitelseder S, Scheike T, Kjaer M, Holm L. The anabolic potential of dietary protein intake on skeletal muscle is prolonged by prior light-load exercise. Clin Nutr. 2013;32:236–44.
47. Mikkelsen UR, Schjerling P, Helmark IC, Reitelseder S, Holm L, Skovgaard D, et al. Local NSAID infusion does not affect protein synthesis and gene expression in human muscle after eccentric exercise. Scand J Med Sci Sports. 2011;21:630–44. 48. Duijnisveld BJ, Bigot A, Beenakker KG, Portilho DM, Raz V, van der Heide HJ,
et al. Regenerative potential of human muscle stem cells in chronic inflammation. Arthritis Res Ther. 2011;13:R207.
49. Aletaha D, Alasti F, Smolen JS. Rheumatoid arthritis near remission: clinical rather than laboratory inflammation is associated with radiographic progression. Ann Rheum Dis. 2011;70:1975–80.
50. Crowson CS, Myasoedova E, Davis 3rd JM, Matteson EL, Roger VL, Therneau TM, et al. Increased prevalence of metabolic syndrome associated with rheumatoid arthritis in patients without clinical cardiovascular disease. J Rheumatol. 2011;38:29–35.
51. Matschke V, Murphy P, Lemmey AB, Maddison P, Thom JM. Skeletal muscle properties in rheumatoid arthritis patients. Med Sci Sports Exerc. 2010;42:2149–55. 52. Giles JT, Allison M, Blumenthal RS, Post W, Gelber AC, Petri M, et al. Abdominal adiposity in rheumatoid arthritis: association with cardiometabolic risk factors and disease characteristics. Arthritis Rheum. 2010;62:3173–82.
53. Helliwell PS, Jackson S. Relationship between weakness and muscle wasting in rheumatoid arthritis. Ann Rheum Dis. 1994;53:726–8.
54. Hakkinen A, Sokka T, Kotaniemi A, Paananen ML, Malkia E, Kautiainen H, et al. Muscle strength characteristics and central bone mineral density in women with recent onset rheumatoid arthritis compared with healthy controls. Scand J Rheumatol. 1999;28:145–51.
55. Gibson JN, Poyser NL, Morrison WL, Scrimgeour CM, Rennie MJ. Muscle protein synthesis in patients with rheumatoid arthritis: effect of chronic corticosteroid therapy on prostaglandin F2 alpha availability. Eur J Clin Invest. 1991;21:406–12.
56. Dideriksen KJ, Reitelseder S, Petersen SG, Hjort M, Helmark IC, Kjaer M, et al. Stimulation of muscle protein synthesis by whey and caseinate ingestion after resistance exercise in elderly individuals. Scand J Med Sci Sports. 2011;21:e372–83.
57. Tatsumi R, Anderson JE, Nevoret CJ, Halevy O, Allen RE. HGF/SF is present in normal adult skeletal muscle and is capable of activating satellite cells. Dev Biol. 1998;194:114–28.
58. Sambasivan R, Tajbakhsh S. Adult skeletal muscle stem cells. Results Probl Cell Differ. 2015;56:191–213.
59. Rodgers JT, King KY, Brett JO, Cromie MJ, Charville GW, Maguire KK, et al. mTORC1 controls the adaptive transition of quiescent stem cells from G0 to G(Alert). Nature. 2014;510:393–6.
60. Hubal MJ, Chen TC, Thompson PD, Clarkson PM. Inflammatory gene changes associated with the repeated-bout effect. Am J Physiol Regul Integr Comp Physiol. 2008;294:R1628–37.
61. Weinheimer EM, Jemiolo B, Carroll CC, Harber MP, Haus JM, Burd NA, et al. Resistance exercise and cyclooxygenase (COX) expression in human skeletal muscle: implications for COX-inhibiting drugs and protein synthesis. Am J Physiol Regul Integr Comp Physiol. 2007;292:R2241–8.
62. Buford TW, Cooke MB, Willoughby DS. Resistance exercise-induced changes of inflammatory gene expression within human skeletal muscle. Eur J Appl Physiol. 2009;107:463–71.
63. Burd NA, Dickinson JM, LeMoine JK, Carroll CC, Sullivan BE, Haus JM, et al. Effect of a cyclooxygenase-2 inhibitor on postexercise muscle protein synthesis in humans. Am J Physiol Endocrinol Metab. 2010;298:E354–61. 64. Mikkelsen UR, Paulsen G, Schjerling P, Helmark IC, Langberg H, Kjaer M, et al. The heat shock protein response following eccentric exercise in human skeletal muscle is unaffected by local NSAID infusion. Eur J Appl Physiol. 2013;113:1883–93.
66. Drummond MJ, Miyazaki M, Dreyer HC, Pennings B, Dhanani S, Volpi E, et al. Expression of growth-related genes in young and older human skeletal muscle following an acute stimulation of protein synthesis. J Appl Physiol. 2009;106:1403–11.
67. Hotamisligil GS, Murray DL, Choy LN, Spiegelman BM. Tumor necrosis factor alpha inhibits signaling from the insulin receptor. Proc Natl Acad Sci U S A. 1994;91:4854–8.
68. Grounds MD, Radley HG, Gebski BL, Bogoyevitch MA, Shavlakadze T. Implications of cross-talk between tumour necrosis factor and insulin-like growth factor-1 signalling in skeletal muscle. Clin Exp Pharmacol Physiol. 2008;35:846–51.
69. Merritt EK, Stec MJ, Thalacker-Mercer A, Windham ST, Cross JM, Shelley DP, et al. Heightened muscle inflammation susceptibility may impair regenerative capacity in aging humans. J Appl Physiol. 2013;115:937–48.
70. McKay BR, Ogborn DI, Baker JM, Toth KG, Tarnopolsky MA, Parise G. Elevated SOCS3 and altered IL-6 signaling is associated with age-related human muscle stem cell dysfunction. Am J Physiol Cell Physiol. 2013;304:C717–28. 71. Raue U, Slivka D, Jemiolo B, Hollon C, Trappe S. Proteolytic gene expression
differs at rest and after resistance exercise between young and old women. J Gerontol A Biol Sci Med Sci. 2007;62:1407–12.
72. McKay BR, Ogborn DI, Bellamy LM, Tarnopolsky MA, Parise G. Myostatin is associated with age-related human muscle stem cell dysfunction. FASEB J. 2012;26:2509–21.
Submit your next manuscript to BioMed Central and take full advantage of:
• Convenient online submission
• Thorough peer review
• No space constraints or color figure charges
• Immediate publication on acceptance
• Inclusion in PubMed, CAS, Scopus and Google Scholar
• Research which is freely available for redistribution