III. RESEARCH METHOD
This chapter describes the design of the research, how to collect the data from the subject of the research, and how to analyze the data. This chapter also describes research procedure, validity and reliability of the test instrument, data treatment, and hypothesis testing.
3.1 Research Design
achievement. In this design, there were two classes: an experimental class 1 and an experimental class 2 which were received the treatments. Both experimental class 1 and experimental class 2 received the same pre-test and posttest.
The design can be presented as follows:
G1 : T1 X1 T2
G2 : T1 X2 T2
Where:
G1 : experimental class 1
G2 : experimental class 2
T1 : pretest
X1 : experimental class 1 treatment
X2 : experimental class 2 treatment
T2 : posttest
(Setiyadi, 2006:135)
3.2 Population and Sample
one class as the try out class, one class as an experimental class 1, and another as an experimental class 2. In order to see that the experimental class 1 and the experimental class 2 had approximately the same ability, the researcher took the data from conducting the pretest for the classes, experimental class 1 and experimental class 2. The results were then compared to the other result. It was necessary to measure whether the two classes had the same basic ability or in other words, they had equal knowledge.
3.3 Variables
This research consists of the following variables:
1. The students’ vocabulary mastery (achievement) as dependent variable (Y), 2. Visual dictionary and sequential art as independent variables (X1 and X2).
3.4 Instrument
questions represented the vocabularies stated in the process of teaching vocabulary through visual dictionary and sequential art.
3.5 Data Collecting Technique
The data of this research was gained from:
1. Try Out
This test had aim to know the validity and reliability of the test. The test was administered before the pretest. The total items were 40 and it was allocated within 60 minutes.
2. Pretest
Pretest was conducted before the researcher conducts the treatment. It was used to know how far the students mastered the vocabulary. The test consisted of 30 items in multiple choices and each item had 4 options of answer. One is the correct answer and the rest are the distracters. It was conducted in 45 minutes. The pretest was administered once.
3. Posttest
answer and the rest were distracters. It was conducted in 45 minutes. This test had the same difficulty level as pretest.
4. Observation
The observation was conducted in the experimental class to observe the teaching-learning process during the treatment of teaching vocabulary through visual dictionary and sequential art.
5. Interview
The interview was conducted in both experimental classes, in which the students’ answers were classified and generalized as the resource. Interview used to find out the problems that students face/undergo in learning vocabulary through visual dictionary and sequential art.
3.6 Research Procedure
1. Pre-observation
Pre-observation was conducted through interview to the English teacher of SMP Muhammadiyah Trimurjo to find out the background problems in English teaching and learning process before the researcher do her research there.
2. Determining the Subject of the Research
class consists of 30 students. In determining the experimental class 1 and experimental class 2, the researcher used coin.
3. Selecting and determining the material
The researcher determined the material was taken from www.thedeliciousrevolution.com website. The selecting process considered material which would attract students’ interest. The researcher used procedure texts that contained the target words from the vocabulary of content words (noun, verb, adjective, and adverb). The visual dictionary and sequential art was modified and composed by the researcher herself in accordance to the texts used for the treatments.
4. Conducting Try Out
Try Out was conducted to measure the level of difficulty, discrimination power, validity and reliability of pretest and posttest. It was administered for 40 items in 60 minutes. The aim of try out was to know the quality of the test used as the instrument of the research, and determine which item should be revised for pretest and posttest. The try-out test conducted before the first meeting in one class out of the experimental class.
5. Conducting the Pretest
Pretest was conducted to measure students’ basic ability. It consisted of 30 items in multiple-choice questions and each item had 4 options of answer. It was conducted in 45 minutes.
6. Giving Treatments
words (noun, verb, adjective, and adverb) which learnt through visual dictionary in experimental class 1 and sequential art in experimental class 2. 7. Conducting the Posttest
The posttest was conducted for 30 items in multiple-choice questions and each item had 4 options of answer. It was conducted in 45 minutes to measure whether there was increase of students’ vocabulary achievement after being given treatments.
8. Analyzing the Test Result
After conducting pretest and posttest, the researcher analyzed the data. The data was analyzed by using T-Test. It was used to compare the result of students’ vocabulary achievement taught through visual dictionary and sequential art.
9. Conducting the Observation
process is reported) was used to observe teaching-learning activity and to note the classroom events during the treatment process. The observation sheet was in the form of a checklist.
10.Conducting Interview
The interview was conducted in IXA and IXB as the experimental class 1 and experimental class 2, in which the students’ answers were classified and generalized as the resource. Some representatives of the students as the interviewees were chosen from low and high scores based on the mean score of the post-test. The interview was in the form of open and formal questions (the questions must be in the form of explanation or description rather than “yes” or “no” answers, to avoid the students from being reluctant to answer the questions given). The interview was conducted to find out the problems the students face in learning vocabulary through visual dictionary and sequential art.
3.7Scoring System
To score the students’ work of the test, the researcher used percentage scoring. The ideal highest score was 100. The score were calculated by using the following formula:
PS = 100
N R
Where:
R : the total of right answer N : total item
(Henning, 1987: 17)
3.8 Criteria of Good Test
In this research, to prove whether the test had good quality, it was tried out first. The test is said having a good quality if it has a good quality, reliability, level of difficulty, and discrimination power. The try out test was given to the students to know how the quality of the test which was used as the instrument of the research. The try out test was given to another class that was not included in the sample. The data gained were analyzed to judge the level of difficulty, discrimination power, validity, and reliability of the test.
3.8.1 Validity
The validity of the test is the extent to which it measured what it is supposed to measure and nothing else (Heaton, 1991:159). In order to measure whether the test has a good validity, the researcher analyzes the test from content and construct validity.
vocabulary of content words (noun, verb, adjective and adverb) related to procedure text that were supposed to comprehend by grade IX students.
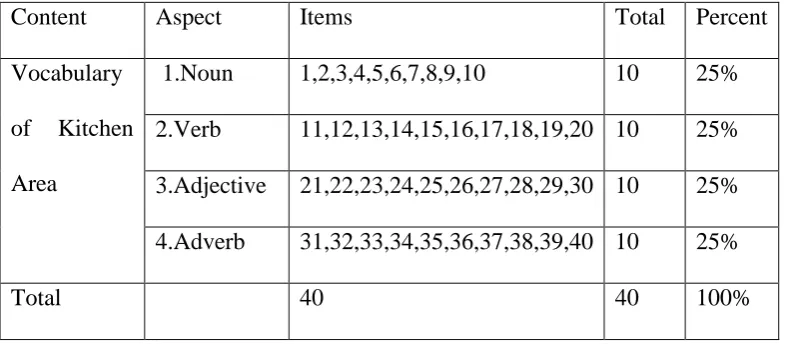
[image:10.595.126.521.374.546.2]The researcher used the table of specification to check content validity of the test items. The total percentage in the table indicated the relatives’ degree of emphasis of each content area and each instructional objective given in the test. The table of specification can be used to determine which test is more relevant to our particular situation and is also necessary to check whether test items have good content validity.
Table 1. Table of Specification of Try Out Test
Content Aspect Items Total Percent
Vocabulary of Kitchen Area
1.Noun 1,2,3,4,5,6,7,8,9,10 10 25%
2.Verb 11,12,13,14,15,16,17,18,19,20 10 25% 3.Adjective 21,22,23,24,25,26,27,28,29,30 10 25% 4.Adverb 31,32,33,34,35,36,37,38,39,40 10 25%
Total 40 40 100%
the construct validity can be measured by evaluating all items in the test. If all items have measured vocabulary mastery of the students, this instrument has fulfilled construct validity.
Then, in order to measure content validity and construct validity, the researcher uses inter-rater analysis to make the instrument more valid. Accordingly, the three English teachers of SMP Muhammadiyah Trimurjo took part in measuring the content and construct validity of the instrument. If the percentage of one test item is > 50%, the item will be taken.
3.8.2 Reliability
rxy =
2 2 2 2 y y N x x N y x xy N Where:rxy : the correlation coefficient of reliability between odd and even
N : the number of students who take part in the test x : the total numbers of odd number items
y : the total numbers of even number items x2 : the square of x
y2 : the square of y
𝑥 : the total score of odd number items
𝑦 : the total score of even number items
(Henning, 1987: 60)
Then the researcher uses Spearman Brown’s Prophecy formula (Hatch and Farhady, 1982: 246) to know the coefficient correlation of whole items as follows:
rk =
xy xy r r 1 2 Where:
rk : the reliability of the test
The criteria of reliability are: 0.90- 1.00 : high
0.50- 0.89 : moderate 0.0- 0.49 : low
(Hatch and Farhady, 1982: 247)
3.8.3 Level of Difficulty
To know whether the test items are easy or difficult from the students’ perception that took the test, the researcher has calculated the level of difficulty. Difficulty level is calculated by dividing the number of students who get it right by the total number of students (Shohamy, 1985: 79).
The formula as follows:
LD =
N L U
Where:
LD : level of difficulty
U : the number of upper group students who are answer correctly L : the number of lower group students who are answer correctly N : the total number of students who take the test
The criteria are:
< 0.30 : difficult 0.31 – 0.70 : average
3.8.4 Discrimination Power
The discrimination power is used to discriminate between weak and strong examinees in the ability being tested. The results of the students’ test were divided into two groups, upper and lower. The upper students meant that the students who answered the questions correctly were more than the lower students answered correctly. To determine the discrimination power, the researcher used the following formula:
DP =
N
correctL correctU
2 1
(Shohamy, 1985: 81)
Where:
DP : discrimination Power
U : the number of upper group students who are answer correctly
L : the number of lower group students who are answer correctly
N : the total number of students
The criteria are:
1. If the value is positive, it means that a larger number of more knowledgeable students than poor students get the item correct. If the value is zero, it means that there is no discrimination.
3. In general, the higher the discrimination index will be the better. In classroom situation, most items should be higher than 0.20 indexes.
3.9 Data Analysis
The purpose of analysis was to reduce data to be intelligible and interpretable so that the relation of research problem could be studied. Therefore, the data from the observation and interview were also collected and interpreted to describe the situation in the class and found out the problems the students face/undergo in learning vocabulary through visual dictionary and sequential art.
The researcher analyzed the data in order to compare the increase of the students’ vocabulary mastery in the used of visual dictionary and sequential art as the media. The researcher analyzed the students’ vocabulary achievement by doing these activities:
1. Scoring the pretest and posttest.
2. Tabulating the result of the test and calculating mean of the pretest and posttest.
𝑀𝑑 = 𝑑 𝑁
Md = mean
3. Drawing a conclusion from the tabulated results of the pre-test and post-test, then analyzing by using Independent Group T-test through the Statistical Package for Social Science (SPSS) 17 for windows.
Furthermore, in order to find out the problems the students face/undergo in learning vocabulary through visual dictionary and sequential art, triangulation method was used. The first instrument that used was observation, which conducted in the experimental classes to observe the teaching-learning process during the treatment of teaching vocabulary through visual dictionary and sequential art. In analyzing the data from the observation of students’ learning activities, the researcher counts the number of activities done by the students and then calculates the percentage of the students’ activities.
The criteria as follows:
The score for each activity is 10 to the total score 100 1. 40-50 : Poor
2. 60-70 : Enough 3. 80-90 : Good 4. 100 : Very good
Arikunto (2006:7)
The indicator of the students’ activities is more than 75%. If more than 75% learning activities are done by the students, it means that the teaching learning process can be categorized as a good level (Arikunto, 2006:7).
answers, to avoid the students from being reluctant to answer the questions given). To analyze its qualitative data, matrix analysis, in this case description analysis was used since the researcher used her own idea, including her own interpretation toward the data (Setiyadi, 2006:262).
3.10Data Treatment
According to Hatch and Farhady quoted by Setiyadi (2006: 168-169), using t-test for the hypothesis t-testing has three underlying assumptions, namely:
1. The data is interval ratio.
2. The data is taken from random sample in a population. 3. The data is distributed normally.
Therefore, the researcher used the following procedures to treat the data treatment:
3.10.1 Normality Test
The normality of test used to measure whether the data in experimental class 1 and experimental class 2 are normally distributed or not.
The hypothesis for the normality test is as follows: H0 : the data is not distributed normally
H1 : the data is distributed normally
H1 is accepted if p > α, and the researcher uses level of significance 0.05
3.10.2 Homogeneity Test
This test was used to determine whether the data fulfill the criteria of the quality of variance. This test used T-Test to analyze the data.
The hypothesis for the homogeneity of variance is as follows: H0 : there is no significant difference (equal)
H1 : there is a significant difference (not equal)
In this case, H0 is accepted if p > α (p = the significant score of students, α
= the significant level). Here, the researcher uses the significant level (α) 0.05.
3.11 Hypothesis Testing
The hypothesis was used to prove whether the hypothesis proposed in this research was accepted or not. Independent Group T-Test was used and the hypothesis was also statistically tested by using statistical computerization (SPSS 17). The hypothesis analyzed at the significant level of 0.05 in which the hypothesis will be approved if sign < α. It means that the probability of error in the hypothesis is only about 5%.
The hypotheses are:
2. Visual dictionary is more effective to improve students’ vocabulary achievement than sequential art.