416
TOTAL CIVILIAN INCOME IN NORTHERN IRELAND.
By NORMAN CUTHBERT, M.A.
{Read before the Society, April 2Qth, 1951.)
In recent years a good deal of the attention of economists has been devoted to regional problems. This has been largely due to the realisation that the mobility of factors of production (particularly labour) has been far from perfect and that consequently political units and economic units are not the same. The study of aggregates may fail to disclose the nature of the problems that affect the constituent parts, while the effects of a particular economic policy decided for the country as a whole may be very different in different regions. That these regional differences are of fundamental importance is amply demonstrated in the field of employment, for even in a situation of " full " employment for an economy treated as a whole pockets of relatively heavy unemployment may continue to persist. Moreover, because of the general economic conditions within the region or because of the relationship of the region to the rest of the economy, employ-ment may respond less readily to the Governemploy-ment's efforts to stimulate investment than might be expected from a study of the economy as a whole. It is here that a knowledge of certain fundamental regional data could be of the greatest service,, in putting the regional problems in their setting, and in enabling those shouldering the responsibility for policy to have a more complete perception of the possible economic consequences of their decisions. One would like not only to have some knowledge of the division of the national income among the different regions, but also information about regional differences in saving, channels of investment, balance of payments and the employment multiplier. A start has to be made somewhere and this paper is an attempt to marshal the information that is available and has a bear-ing on the aggregate income of Northern Ireland.
417
tknerally, income which, does not represent a flow from productive investment is not included in national income calculations and sequently national debt interest is excluded when a nation is con-sidered as a whole. On the other hand, interest payments from abroad, no matter whether or not they are derived from holdings of foreign national debts, are included. To treat national debt interest as income for a, region and at the same time exclude it for the nation will result in. the loss'of comparability. On the other hand, to ex-clude such income from both may constitute a serious understatement or overstatement of regional income; for, from the viewpoint of the region, the income from investment In Government securities is like income imm any other investment—it is immaterial whether all or none of its investment is in national debt securities so long as the burden of taxation on the region for the service of the debt is un-changed. To follow the usual practice in national income estimates, of treating as income " deadweight " debt interest derived from other regions, but omitting it from the region being studied except in so far as it is paid to " foreigners ", involves the practical but insoluble probtem of apportioning responsibility for the service of the national' debt amongst the regions. It therefore seems right to include income from Government securities on a par with other income from invest-ment. For the purpose of comparison with the whole economy it is. necessary to add in national debt interest to the United Kingdom national income, otherwise the sum of the parts will not be equal to the whole.
year from the ownership of factors of production, or income rights, by persons or bodies resident, in Northern Ireland. It therefore includes income from work and income from investment no matter where situated: wages, salaries, profits, dividends, interest and rents obtained by persons or institutions in Northern Ireland, whether or not the source of that income is situated in Northern Ireland or out-side, and, in addition, an imputed share of other corporate income within the United Kingdom but not distributed. In this concept, no account it taken of the inflow or outflow of gifts or allowances, nor is any account taken of the earnings of Northern Irelanders tem-porarily absent from the province or of members of the armed forces whether stationed in Northern Ireland or not. No allowance is made for income arising as the result of blaekmarketing transactions or smuggling, or of any understatement of income for the purpose of tax evasion.
The most important single source of information are the annual Reports of His Majesty's Commissioners of Inland Revenue. These have been used to obtain the main data on wages, salaries, interest, rent, and profit from production, manufacture and services. For tax-ation purposes the United Kingdom is divided into three regions, England and Wales, Scotland and Northern Ireland, and a regional analysis of assessments is given for each schedule, except Schedule C which covers income from British, Dominion and Foreign Govern-ment securities taxed by deduction at sources. The statistics given in these reports, however, cannot generally be used directly but require to be supplemented from other sources and modified to fit into the definition of income which is being followed. As a rule, the Board of Inland Revenue are only interested in that income which is liable to tax, and they are not concerned with the place of residence of the ultimate receiver of the income. In consequence, little information is available on incomes below the exemption limit except in so far as they have come under the review of the Department, while the assign-ment of the income to any particular location is a matter of con-venience in the collection of tax and not always an indication of the place of residence of the income recipient.
Government securities, foreign Government securities, profits of com-panies located in Great Britain and even profits of comcom-panies located in Northern Ireland.
The Gainfully Occupied Population.
Before we can come to grips with the problem of estimating total wages and salaries, it is necessary to find out how many incomes are below the exemption limit for taxation and for this,,purpose to begin by estimating the number of gainfully occupied in Northern Ireland. For this number we have to rely on the Census reports of 1926, the last year in which an occupational analysis was made, suitably modified to take into account alterations in the age and sex distribu-tion of the populadistribu-tion and changes in the social structure which have since occurred. If we take the civilian population as estimated at December, 1945, and apply to each age and sex group the proportion of gainfully occupied in that group in 1926, then, omitting children under 14 years and young people receiving full-time education, we get a figure of 595,000 gainfully occupied persons at that date. The allocation of this total to broad categories has been based partly on the figures of the 1926 Census, partly on the Census of the Ministry of Agriculture taken at June, 1945, and partly on the national insur-ance statistics.
TABLE 1.
Estimated Gainfully Occupied Population in Northern Ireland, Mid 1945.
(thousands) Insured for Unemployment (General Scheme) .. .. .. .. 335 Agricultural Workers, including farmers, etc. .. .. .. .. 143 Excepted Workers (income below £420 per annum) .. .. .. 39 Workers over Age Limit for Unemployment Insurance .. .. 8 Non -manual Workers earning over £420 per annum .. .. .. 24 Employers and Workers on their own account .. .. .. 38 Family Workers (non-agricultural) .. . .. .. .. 8 Total 595
For the fiscal year ending April, 1947, a special analysis of the numbers of persons paying tax in Northern Ireland under Schedules D and E was made by the Board of Inland Eevenue.
Schedule
Schedule D
E
TABLE 2.
Number of Taxpayers in Northern Ireland, {Source : Inland Revenue)
i «
.. ! over £420 p.a. j under £420 p.a.
.. I over £420 p.a. I under £420 p.a.
1946-47.
Number
6,300 18,700
26,000 294,000
420
women separately and are, therefore, deficient. It is estimated that about 1,000 would be added to the number of taxpayers by their inclusion, making a total of 26,000.
In the employee class, by excluding agricultural workers, the total in Table 1 is 414,000 as compared with 320,000 taxpayers in Schedule E, of whom about 4.000 were pensioners, leaving 98,000 exempted from (or evading) tax. Of these 98,000, some 25,000-35,000^ came under the yeview of the Board of Inland Revenue, and 19,000 were domestics (excepted workers and non-taxpayers), leaving 44,000-54,000 not covered,2 i.e., earning less than £2 per week. The estimated number of occupied people under 20 years of age in 1945 is 88,000, of whom 10,000 are included in agriculture and domestic service. This leaves 78,000 workers under the age of 20 outside domestic service and agricultural work. Thus, the estimate of 49,000 (to take an average of 44,000-54,000) does not seem to be an excessive number to be earning less than £2 per week.
Amongst employers and workers on their own account, 26,000 out of an estimated 38,000 pay tax in Schedule D, leaving 12,000 for evasion or exemption.
Wages mid Salaries.
For 1945-46, wages and salaries coming under the review of the Board of Inland Revenue amounted to about £68 million. To this may be added £2 million for domestic servants if remuneration in kind be included, £0-3 million for United Kingdom civil servants taxed outside Northern Ireland, £3-25 million to cover those earning less than £2 per week (an average of £66 per annum).3 Allowing £0*15 million for agricultural labourers included in P.A.Y.B., we have a total of £73-4 million for wages and salaries (exclusive of agricultural wages). No allowance for pensions arising outside Northern Ireland is made.
Unemployment averaged 23,000 in 1945. There was, however, practically no long-duration unemployment and most of the unem-ployed, therefore, earned something during the year. Those earning more than £2 per week are included in the Board of Inland Revenue Statistics and the rest in the estimate for persons coming below the exemption limit.
For years prior to 1945-46, there are certain difficulties in making direct estimates of the total of wages and salaries. No details of the numbers of wage and salary earners in different industries are avail-able, and to try to estimate them from the 1926 Census of Population is subject to two criticisms : firstly, these figures are now over 20 years old; and, secondly, estimates of the population on which estimates of
1 See 91st Report of Commissioners of Inland Revenue. The published number of persons coming under the review of the Board is -35 million in schedule E. The number of persons paving tax in Northern Ireland in this Schedule was given as 320,000.
2 U.K. civil servants taxed at headquarters cancel the inclusion of less than one thousand agricultural workers taxed in schedule E.
421
the numbers of wage and salary earners would depend cannot take adequately into consideration inter-regional movements of workers' between Northern Ireland and other parts of the British Isles. These are believed to have been considerable throughout the period. In addition, sufficiently detailed statistics of average earnings in Northern Ireland are not available prior to 1948. Instead, salaries have been estimated for 1945-46, wages taken as a residual and the figures for earlier years obtained by the use of indicators. Estimates of salaries are based on the relationship of Schedule E assessments in Northern Ireland to those in the United Kingdom as a whole. On the assumption that the distribution of salaries above and below the income tax exemption limit is the same in the province as for the United Kingdom as a whole, the proportion so arrived at, applied to the total of salaries in the National Income White Papers, gives a total of salaries for Northern Ireland. This method can be used to carry the estimates back to 1938. For earlier years, back to 1935, no change in the exemption limit occurred and the amount of salaries entering Schedule E in Northern Ireland has been used as the indicator. To the total of salaries as thus estimated must be added the salaries of workers employed in Northern Ireland—in Inland Revenue, Customs and Excise, Post Office and the Judiciary—but subject to tax in Great Britain.4
TABLE 3.
Total Salaries Earned by Residents of Northern Ireland. £ million.
Year 1935-36 1936-37 1937-38 1938-39 1939-40 194(M:1 1941-42 1942-43 1943-44 1944-45 1945-46
Salaries taxable in N. Ireland
12-6 13-3 13-9 14-2 15-1 16-3 18-2 18-1 18-7 19-4 20-4
Salaries of U.K. Civil Servants resident
i n ' N . I . 0-8 0-8 0-9 0-9 0-9 1-1 1-4 1-4 1-5 1-5 1-6
Total 13-4 14-1 • 14-8 15-1 16-0 17*4 19-6 19-5 20-2 20-9 2 2 0
dearly differentiated from wages, and any under-estimation of the total is relatively unimportant. In so far as it occurs it will result in a somewhat higher total of wages all through the period but is unlikely to affect the total income of the region to any great extent. The possible effect is to cause a slightly greater variation in the year-to-year total income owing to the greater variability of total wages than of total salaries.5
For 1945-46 wages and salaries amounted to £73*4 million, of which £22 million may be taken as the total of salaries and the rest, £51-4 million, as wages. Most wage earners are covered by unemployment insurance, the bulk of them being in production and manufacturing industries. The index of employment for those classes of insured workers is, therefore, taken as the measure of growth of the number of wage earners, and used in conjunction with the percentage change in average earnings from year to year in the United Kingdom to form an index of the total wages bill (Table 4, column (c)). There are two main difficulties here. The first is that, due to movements between non-insured and insured employments within the wage-earning group, the index of employment may arise or fall more than in proportion to the changes in the total number of wage earners. The greatest sources of such movements are agriculture and domestic work. The former has been excluded by excluding agricultural wages, which will be included later with farming profits; the latter by deducting the esti-mated total of wages and remuneration in kind earned by domestic workers. The second main difficulty is that the rates of expansion and contraction in different industries in Northern Ireland have not been the same as in the United Kingdom. The consequence is that in using the percentage increase in average earnings in the United Kingdom a certain " bias " has been introduced into the figures.6 Average earn-ings per operative in the main industrial groups in Northern Ireland are available for 1935 only.7 Taking the number of insured workers employed in each industrial group in 1935 and 1945 and assuming that earnings in these groups changed in the same proportion as in the United Kingdom, a rough measure of the change in the total earning power of labour in Northern Ireland between 1935 and 1945 has been calculated. This shows that to eliminate the " bias " the index of total wages (Table 4, column (c)) has to be reduced by some 13-4 per cent, in 1935. The percentage reduction for other years is obtained by linear interpolation.8 For years prior to 1938 the index of weekly wage rates has been spliced to the earnings index, an interpolated figure for October of each year being used.
5 When tested against the index of salaries (see Bowley, Studies in National
Income, p. 84—Joan G. Marley and H. Campion, Salaries in the United Kingdom) and the growth in employment in Northern Ireland in the same period, the increase in total salaries between 1935 and 1939 shown in the table seems not unreasonable.
6 Cfr Clark : National Income and Outlay, p. 70.
7 Census of Production, Northern Ireland, 1935.
TABLE 4.
Estimated Total Wages Bill (excluding agriculture and domestic service).
{Sources: Earnings 1938-45, Ministry of Labour Gazette; Wages 1935-38, Statistical Abstract for U. K,, 1946; Employment, Average of April, July, October and January, base 1926).
Year 1935-36 1936-37 1937-38 1938-39 1939-40 1940-41 1941-42 1942-43 1943-44 1944-45 1945-46 (a) Index of Earnings 92 94 97 100 100 131 144 163 178 179 176 (b) Index of Employment in Produc-tion and Manufacture
1926 = 100 96-6 101-8 101-1 93-2 106-0 107-9 125-7 141-4 138-9 133-4 129-4 (c) Index of Total Wages before Adjustment 390 420 431 409 465 621 795 1012 1086 1048 1000 (d) Percentage Adjustment for " Bias "
-13-4 -12-1 - 1 0 - ^ - 9-4 - 8-1 - 6-7 - 5-4 — 4-0 - 2-7 - 1-3 (e) Corrected Index of Total Wages 338 369 384 371 427 579 752 972 1057 1034 1000 (/» Total Wages Bill £ million 16-7 18-2 19-0 18-3 211 28-6 37-2 48-0 52-2 51-1 49-4
To the figures shown in column (/) of Table 4 an addition of about £2 million each year has to be made on account of domestic servants. The total of £18*7 million thus obtained for wages in 1935 amounts to some 51 per cent, more than the total estimated in the Census of Production of 1935.9 This is not excessive when compared with similar calculations made for the United Kingdom. Mr. Colin Clark estimates that total wages in 1931 were about 67 per cent, above the total for the Census of Production Industries.10
It must be remembered in interpreting the figures of total earnings from wages and salaries that Inland Revenue estimates are made to the nearest million, so that even the most definite part of earnings is subject to error of plus or minus £J million; and that the Inland Eevenue Statistics are often revised as additional information becomes available.11 For years other than those for which P.A.Y.E. statistics are given, the estimates are much more doubtful. By applying to Northern Ireland the earnings index of the United Kingdom, there may be a tendency to overestimate the increase (and therefore to underestimate the total "Wages Bill in earlier years) in Northern Ireland due to heavier overtime working in Great Britain and because of the greater ease, especially among women, in moving from lower
9 Cf. Census of Production, Northern Ireland, 1935, p. 6. The estimated tota
of wages paid in industries coming within the scope of the Census and including firms exempt, on the grounds that not more than ten persons were employed on average, is given as £12-4 million.
10 National Income and Outlay, p. 68. In 1935, of the total insured labour force
in employment, 33 per cent, were employed in Services industries in Northern Ireland compared with 39 per cent, in Great Britain.
11 Cf. Estimates of Total Remuneration in Schedule E in Northern Ireland as
given in the 90th and 91st Reports. 90th
91st
1944-45 . . £68 mn. .. £68 ran.
424
[image:9.403.34.345.66.333.2]paid to higher paid jobs. On the other hand, the more rapid increase in weekly wage rates,12 coupled with the greater proportionate growth in male employment in Northern Ireland during the war, may go far towards compensating for this tendency.
TABLE 5.
Total Wages and Salaries of Northern Ireland Residents.
£ million. Year
1935-36 1936-37 1937-38 1938-39 1939-40 1940-41 1941-42 1942-43 1943-44 1944-45 1945-46 1946-47 1947-48
Wages 18-7 20-2 2 1 0 20-3 23-1 30-6 39-2 50-0 54-2 53-1 51-4
\ Not
{a) Salaries (6)
13-4 14-1 14-8 15-1 16-0 17-4 19-6 19-5 20-2 20-9 22-0 separately estimated <
Total 32-1 34-3 35-8 35-4 39-1 48-0 58-8 69-5 74-4 74-0 73-4 76-5 79-5 (a) Including Domestic Servants but excluding Agricultural Workers. (6) Including U.K. Government Officials resident in Northern Ireland.
Wages and salaries for 1946-47 and 1947-48 arising in Northern Ireland have been obtained by increasing the total found for 1945-46 by the increase in the total of remuneration coming under P.A.Y.E. since that year. To this, an estimate of the amount paid to United Kingdom civil servants employed in Northern Ireland has been added.
Business and Professional Profits a/nd Investment Income.
In the reports of the Board of Inland Revenue, Schedule D income is made up of profits from businesses, professional earnings and certain interest not taxed at source. This total is attributed to the various regions of the United Kingdom according to the place where the tax is paid, and this in turn is generally determined by the situation of the business (its registered office in the case of a company) or the place of residence of professional people or recipients of interest. If we consider the income from these, sources produced in Northern Ireland, there is an immediate complication in those cases where companies operating in Northern Ireland have their registered offices in some other part of the British Isles. Since, however, we are estimating income available to residents in Northern Ireland, the source of possible error is not very great, because the only part of the profit income of such companies that must be included is that part which flows to Northern Irelanders as income from their investments. In this way, such profit affects regional income as if it were entirely produced outside Northern Ireland and is lumped with other invest-ment flows from abroad.
425
In calculating the income of Northern Ireland from business, pro-fessions and interest, it has been assumed that all income taxed in Northern Ireland accruing to individuals and firms (in the income-tax sense) belongs to Northern Irelanders, and that in so far as there is an outflow, it is on account of investment by outsiders in companies or in local authority and Northern Ireland GoArernment securities. Two steps, therefore, are involved. The first is to estimate the total income from these sources, and the second is to find what proportion of this income belongs to investors living outside Northern Ireland. Until the publication of the 90th Report of His Majesty's Commis-sioners of Inland Revenue (referring to income earned in 1944-45), there was no separation of the income of companies and local authorities from other income under Schedule D. Since then, it has been given annually, and in the 92nd Report, the segregation was made for trading profits earned in the three years prior to the war. The actual income given in these reports closely conforms to what should be included in aggregate income.13 The bulk of Deduction and Discharges is due to over-assessment and allowances on appeal after the books of Inland Revenue have been made up.14 Wear and Tear allowances are considered equivalent to actual depreciation and should be deducted at any rate, both in estimating the net income of Northern Ireland and in estimating the amount available for distri-bution. When an adjustment has been made for the proportion of these allowances made to companies, we have the estimate of the actual income of companies and local authorities. The adjustment cannot be made very accurately, for the proportions given for the first time in the 91st Report of His Majesty's Commissioners of Inland Revenue have to be used not only for that year, but for earlier years as well. Income of charities and income below the exemption limit are added back to give the net true income. These items are not a deduction in the sense of a charge against profits but merely an administrative device to indicate claims for repayment of tax on income which, though statutorily exempt from taxation, has been taxed at source and, in fact, may not have arisen from investment in the area in which it is reclaimed. These data enable us to calculate factors showing the relationship of the income of companies and local authorities to the total Schedule D income in the pre-war period and in 1944-45. , For the former, the income of companies and local authorities averaged 44*3 per cent, of that total, and for the latter it was 41*4 per cent.15 The reduction is probably due to the heavier
13 Cf. Bpwley and Stamp: National Income of U.K. for 1924, p. 16. 14 Cf. Stamp : British Income and Property, p. 256.
15 The factor for the income year 1944-45 was derived as follows :
Gross Income Less Wear and Tear
Less Other Reductions and Discharges
Net True Income
Percentaqe of Total Net True Income
Individuals
and Firms Companiesand Local Authorities £ million 15-6
0-4 12-6 58-6
incidence of excess profits tax on companies' profits during war years-For that reason, the lower factor has been used for the years after 1939-40 and the higher one for the earlier years. The income of companies and local authorities thus calculated, less the amounts received by charities from investment in Northern Ireland, plus the income of companies from Schedule C, has to be apportioned between residents of Northern Ireland and outsiders. But charities' income from this source is unknown. In 1945-46, tax repayment was made on £200,000, of which probably half was from annuities contracted for through Deeds of Covenant—a transfer element which should be neglected—while a portion of the rest is likely to have been repayment of tax deducted from investments outside Northern Ireland. The effective deduction for income arising in Northern Ireland is not likely to be more than about £50,000.
Similarly, in order to calculate the inflow of investment income, it is necessary to find the proportion of net true income accruing to companies and local authorities in Great Britain. After making an allowance for income from Dominion and Foreign securities belonging to persons resident outside the United Kingdom, this worked out at 58*1 per cent, for 1944-45. For the pre-war years, it averaged 65-5 per cent.16
Some of the income distributed by companies and local authorities in Northern Ireland is due to investors resident elsewhere. On the other hand, some of the income distributed by companies and local authorities in Great Britain is due to residents in Northern Ireland. There is no direct method of ascertaining these amounts, and it ha& been necessary to resort to an indirect approach through Estate Duty Office Statistics of gross capital values of personalty passing at death and an analysis of the place of residence of shareholders in Northern Ireland companies. In Northern Ireland, Estate Duty Statistics are kept in much the same form as in Great Britain, except that there i& a special anaylsis of the holdings of Northern Ireland securities. Thus it is possible to make some analysis of the investment position in the province. Working on certain broad assumptions, the capital value of estates of residents of Northern Ireland can be segregated accord-ing to the location of the estates, and an estimate can be made of the percentage of the income accruing to companies and local authorities in Great Britain which belongs to residents of Northern Ireland.
for one reason or another, the settlement is subject to Northern Ireland law. Broadly speaking, investments outside Northern Ireland will only find their way into the Northern Ireland statistics where they belong to Northern Ireland residents.17 The total value passing at death of investments in Municipal Securities, Railways, Public Utilities Securities, Proprietary Shares and Insurance held in Great Britain was obtained for each year in the period 1927-28 to 1938-39. In the same way, a figure was found for Great Britain showing the amounts passing at death in these same categories of investment for the same years. The proportion of the total belonging to deceased Northern Irelanders, taking the average for the 12 years, was 1*06 per cent.18
Before this figure of 1-06 per cent can be used in estimating Northern Ireland's share of total investment income, it is necessary to make a correction. For investments in Great Britain passing at death are liable to duty regardless of whether the domicile of the deceased is in Great Britain, Northern Ireland or Elsewhere. Hence, on the assumption that the distribution of Schedule D income between these three classes of persons is proportionate to their relative shares in capital values passing at death, 1*06 per cent, can be taken as Northern Ireland's share of the total income arising under Schedule JD in so far as it goes to persons and not companies. There is, therefore, no need to make any special estimate of the amount of income under Schedule D which is paid to persons (as distinct from companies) resident outside the United Kingdom before estimating the amount flowing to Northern Irelanders. Inter-company holdings of shares, in so far as the companies are situated in Great Britain, do not affect the position since they ultimately belong to individuals. But dividends due to companies registered outside Great Britain must be subtracted from Schedule D before the apportionment is made between residents of Great Britain and Northern Ireland. It is fairly certain that there is some outflow but that it is unimportant for the present calculations. For 1938, it is reckoned that the total payment abroad for interest, dividends and rent was £37 million and for 1947, £120 million.19 Part of these sums consists of income from investment in Government securities not entering Schedule D, part from Government securities expressly exempt from tax,20 part is due to personal holdings of muni-cipal securities and proprietary shares. The remaining part is what has to be deducted. Our best course is to assume that it all came out of Great Britain's Schedule D. As will be seen later, one result of doing so is to leave more Schedule C income to be attributed to
com-17 This is a slight overstatement, but over the twelve years 1927-28 to 1938-39
an analysis of the total personalty liable to duty in Northern Ireland, classified according to the property's situation for the purpose of levying estate duty and to the residence of the deceased, showed that on average 96-8 per cent, of the total personalty situated in Great Britain belonged to residents of Northern Ireland. The other 3 per cent, to 4 per cent, covers cases where there was double residence or for any other reason duty was payable in Northern Ireland.
18 In view of the smallness of the population of Northern Ireland, the small number
of large estates and therefore the liability for this figure to fluctuate due to the random selection of Death, it showed a marked degree of stability. The standard deviation was 0-15.
19 National Income and Expenditure of the United Kingdom 1946 to 1948, Cmd. 7649.
20 This part will have become an increasing proportion of the total during the
panies. The'net effect, however, is to underestimate Northern Ireland's share in the total by just over 1 per cent, of the combined sum of income from Government securities going abroad free of tax, plus the amount paid to persons resident abroad out of Schedule D income.
There are two other ways in which Northern Ireland's share may have been slightly underestimated. In the first place, it has been assumed in making the calculations that investment in companies registered in Great Britain by Northern Ireland companies is negligible.21 In the second place, some companies registered in Great Britain have holdings in companies registered in Northern Ireland. While the whole of the income from these holdings has been attributed to Great Britain, part, in fact, returns to Northern Irelanders as dividends on their investments in Great Britain. The first cause of underestimation is known to be small,22 while the second cannot, at the outside, be more than about 1 per cent, of the total amount of income involved.
In allocating the total Schedule D income from companies and local authorities in Northern Ireland, a different procedure has been followed so as to make allowance for investment by outside companies! Here the proportion flowing out of Northern Ireland was found by analysing separately the holdings of shares in private and public joint stock companies in Northern Ireland in 1938. As regards private companies, a random sample was taken of 42 out of the 1,625 private companies then existing. An examination of the lists of shareholders revealed that about 10 per cent of the total subscribed capital was held by persons or companies outside Northern Ireland. As regards public companies, an examination was made of the share lists of the 13 largest public companies with paid-up capital of over £200,000, , representing in total over 75 per* cent, of the paid-up capital of all public companies registered in Northern Ireland. Of the total sub-scribed capital of these companies, 72 per cent, was held by outsiders. On the assumption that these proportions for private and public companies apply also to paid-up capital, and that the proportion found for private companies also holds for the smaller public com-panies, then 30*7 per cent, of the paid-up capital of all Northern Ireland companies can be attributed to outside holdings. In view of the difference in the proportion of outside investment found in private and in public companies, it is unlikely that this is an overestimate. Hence, this percentage has been applied to the estimated Schedule D income of companies and local authorities throughout the period. In so far as it is an underestimate, it will help to correct the under-estimated inflow from Great Britain mentioned in the last paragraph. Before applying the factors representing Northern Ireland's share of the distributable income of companies and local, authorities, it is necessary to make an estimate of the amount of company income arising under Schedule jC. This amount must be added and charities* income deducted. The results are given in Tables 6 and 7.
21 Such income does not appear in any schedule referring to Northern Ireland
but forms part of Schedule D in Great Britain.
22 In so far as there are reserves for investment these seem to be held mainly in
429
TABLE 6.
Income from Companies, Local Authorities and Northern Ireland Government Securities due to persons or companies outside Northern Ireland.
Year 1935-36 1936-37 1937-38 1938-39 1939-40 1940-41 1941-42 1942-43 1943-44 1944-45 1945-46 1946-47 1947-48 Net True Income Schedule D (a) 10-699 11093 10-952 10-573 12-895 16-685 18-674 18-659 20-674 21-523 23-4 25-9 34-1 Income of Companies and Local Authorities 4-740 4-914 4-852 4-684 5-339 6-908 7-731 7-725 8-559 8-911 9-4 (a) 10-2 (a) 17-1 (a) £ Plus Companies' Schedule C Income 0-22 0-20 0-21 0-20 0-19 0 19 0-24 0-32 0-38 0-41 0-46 0-45 0-54
m i l l i o n .
Less Charities' Income arising m Schedule D Northern Ireland
0 0 5 0-05 0-05 0-05 0-05 0 0 5 0-05 0 0 5 0 0 5 0-05 0-05 0-05 0-05 Total Distribut-able Income of Companys, etc. 4-91 5-06 5-01 4-83 5-48 7-04 7-93 8-00 8-90 9-38 9-8 10-6 17-6
Outflow of Income To Great Britain 1-35 1-39 1-38 1-33 1-51 1-94 2-18 2-20 2-45 2-58 2-70 2-92 4-84 To other(6) places 0-12 0-12 0-12 0-10 0-10 0-12 0-13 0 1 3 0-14 0-15 0-16 0-19 0-31 Total 1-47 1-51 1-50 1-43 1-61 2-06 2-31 2-33 2-59 2-73 2-86 3 1 1 51-5
(a) From Reports of the Commissioners of Inland Revenue.
{b) Of the 30-7 per cent, of Schedule D income of companies and local authorities due to non-rcsidonts it is estimated that 3-2 per cent, is attributable to persons and companies outside the United Kingdom and 27-5 per cent, to persons and companies in Great Britain. That part which is attributable abroad is however paid less income tax. It is the net figure which is given in the table.
TABLE 7.
Income from Companies and Local Authorities in Great Britain due to residents of Northern Ireland. £ million. Year 1935-36 1936-37 1937-38 1938-39 1939-40 1940-41 1941-42 1942-43 1943-44 1944-45 1945-46 1946-47 1947-48 Estimated Net True Income {a) 962 1,049 1,090 1,027 1,114 1,231 1,378 1,503 1,551 1,616 1,726 1,937 2,332 Income of Compames and Local Authorities 630 687 714 673 647 715 801 873 901 938 967 {a) 1,051 (a) 1,398 (a) Plus Companies' Schedule C Income « 74 66 68 67 62 61 76 94 109 117 128 130 152 Less Charity Income 20 21 21 22 22 22 22 23 24 24 24 22 20 Less Income of Foreigners (b) 36 37 38 37 41 45 50 55 63 65 70 • 97 120 Total Distribution between G.B. and N.I. 648 695 723 681 646 709 805 889 923 966 1,001 1,062 1,410 Inflow to Northern Ireland (=1-06%) 6-87 7-37 7-66 7-22 6-85 7-51 8-53 9-42 9-78 10-24 10-61 11-26 14-95
(a) From Reports of the Commissioners of Inland Revenue.
430
As was pointed out in a previous paragraph, some 12,000 of those estimated as having been working on their own account are exempt from or evade tax. There is no guide to the total earnings of these people, but a nominal £1 million per annum—an average of £83-£84 each per annum—is added throughout. The total income below exemption limit given in Schedule D represents claims for repayment of tax deducted at source from dividends and interest.
Income from Government Securities.
Income taxed under Schedule C is the most difficult portion to divide between Great Britain and Northern Ireland. In the Reports of the Commissioners of Inland Revenue, it is dealt with for the Kingdom as a whole. But the Reports distinguish between income from British Government securities and interest on Dominion and Foreign Government securities. These two parts of the total can, therefore, be treated separately. The aim is to determine how much goes to individuals and companies in Great Britain and in Northern Ireland, respectively. The share attributable to companies must be added to their income before calculating the flow of income to and from Northern Ireland.
A considerable amount of interest on the national debt does not find its way into Schedule C at all. Firstly, there are those securities on which income is expressly paid without tax deduction, such as 3 | per cent. War Loan, National Savings Certificates and 3 per cent. Defence Bonds. Secondly, interest paid on short-term loans—such as Treasury Bills and Ways and Means Advances, which in practice are taken up by finance houses—is not taxed at source but forms part of the profits of these undertakings and is taxed under Schedule D. Thirdly, interest on Government securities held by Government Funds or by charities, or where the interest is less than £5 per annum, is paid without deduction of tax. The same happens in many cases where securities are held by foreigners. This applies particularly to specific issues made during the war.23
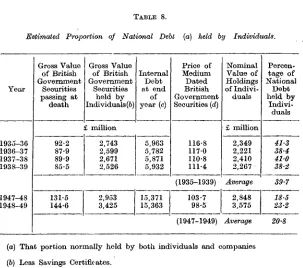
The method employed in estimating the income of Northern Irelanders from British Government securities is necessarily some-what roundabout and is open to numerous objections. It consisted in making a rough estimate of the proportion of Government issues held by individuals. This was done by applying a " multiplier " to the amount of certain Government securities (those classes which are commonly held by both individuals and companies) passing at death in the United Kingdom in both pre-war and post-war years.24 The multiplier for 1924 was calculated as 34, and this was used through-out.25 The following table shows the method employed.
23 Prior to the war it was estimated that not more than 2-3 per cent, of British
Government securities assessed, under schedule C was held by persons resident outside Great Britain. Cf. H. Campion, Public and Private Property.
24 Cf. Mallet and Strutt, J.S.S.R., 1915, p. 555.
25 Cf. Wedgwood, Economics of Inheritance. For the early thirties Campion
431
[image:16.407.55.358.47.315.2]TABLE 8.
Estimated Proportion of National Debt (a) held by Individuals.
Year
1935-36 1936-37 1937-38 1938-39
1947-48 1948-49
Gross Value of British Government
Securities passing at
death
92-2 87-9 89-9 85-5
Gross Value of British Government
Securities held by Individuals (b) £ million
2,743 2,599 2,671 2,526
Internal Debt at end
of year (c)
5,963 5,782 5,871 5,932
Price of Medium Dated, British Government Securities (d)
116-8 117-0 110-8 111-4
Nominal Value of Holdings of
Indivi-duals
£ million 2,349 2,221 2,410 2,267 (1935-1939) Average 131-5
144-6
2,953
3,425 15,36315,371
103-7
98-5 2,8483,575
Percen-tage of National Debt held by
Indivi-duals
41-3 38-4 41-0 38-2
39-7
18-5 23-2
(1947-1949) Average 20-8 {a) That portion normally held by both individuals and companies
(6) Less Savings Certificates.
(c) Excluding Treasury Bills, Treasury deposits by Banks, Ways and Means Advances, Debts owed to the Banks of England and Ireland, and National Savings Certificates. (Source: Finance Accounts of the United Kingdom).
(d) Monthly Digest of Statistics.
According to this table, an average of some 40 per cent, of the internal national debt26 subject to income-tax was held by individuals liable to death duties in the United Kingdom in pre-war years, and about 20 per cent, in the post-war period.
For want of better information, it is assumed that those proportions apply equally to all investment in those classes of Government securi-ties commonly held by individuals, those taxed in Schedule C, and those not taxed at source but assessed under Schedule D.27 For the years 1935-36 to 1938-39, the proportion of 40 per cent, has been applied to the total interest on those national debt securities that come into Schedule C.28 For the year 1947-48, the post-war proportion of 20 per cent, was used instead. As thus estimated, the total amount paid in interest to individuals in 1938-39 was £54*1 million and in 1947-48 it was £70*7 million. The amount in the intermediate years has been estimated on a linear trend. The results are as follows:—
26 After allowing for the items enumerated in note (c), Table 8.
"Mainly Defence Bonds and War Stock.
28 Total National Debt Interest less interest on Ways and Means Advances,
432
TABLE 9.
Allocation of Schedule G Income from British Government Securities betiveert Individuals and Companies.
Year Total Interest on the National Debt Securities taxable under Schedule C £ million 1935-36 1936-37 1937-38 1938-39 1939-40 1940-41 1941-42 1942-43 1943-44 1944-45 1945-46 1946-47 1947-48 121-9 129-3 133-8 135-2 — — — — — — _ — 353-7 Proportion , to Individuals (b)
( 40?/o
— — — — — — — — 20% Total Amount Paid to Individuals (A) (c) 48-8 51-7 53-5 54-1 55-9 57-8 59^6 61-5 63-3 65-2 67-0 68-9 70-7
Schedule C ' Interest on British , Government Securities id) £ 1000 96-7 101-3 100-2 98-2 99-7 119-0 141-5 159-9 171-1 184-6 188-8 . 213-4 To Com-panies (d)-(c) («) million 51-2 4 5 0 47-8 4 6 1 42-3 41-9 59-4 80-0 96-6 105-9 117-6 119-9 142-7 To Indivi-duals in N.L 1-35% of (c) (/) 0-66 0-70 0-72 0-73 0-75 0-78 0-80 ' 0-83 0-85 0-88 0-90 0-93 0-95 To Com-panies in N.I. 0-37% of (e) (g) 0-19 0-17 0-18 0-17 0-16 0-16 0-22 0-30 0 3 6 0-39 0-44 0-44 0-53 To Com-panies in G.B. (e)~(g) (h) 51-0 44-8 47-6 45-9 42-1 41-7 59-2 79-7 96-2 105-5 117-2 119-5 142-2
(A) Estimated Actual Income. The reductions and discharges in Schedule C are allowed against gross^ income in proportion to the gross incomes of British Government securities and Foreign and Dominion Govern-ment securities respectively.
Of the total of British Government securities passing at death in the United Kingdom during the twelve fiscal years preceding the war, the proportion belonging to Northern Irelariders averaged 1*35 per cent. That same proportion of the total interest going to individuals has been attributed to Northern Irelanders throughout. In order to estimate the portion of Schedule C income going to companies, it has been necessary to fall back on the proportions obtained from Case V, Schedule D, as given in the 90th Report. This covers interest on Government securities not taxed at source, bank deposit interest, etc., and it is assumed that, in investing their surpluses, companies are guided'by much the same principles in Great Britain and in Northern Ireland. The income of Northern Ireland companies formed 0*37 per cent, of the total income of United Kingdom companies under this heading, and this proportion has been used to divide the Schedule C income of companies.
The total income attributed to companies and individuals in Northern Ireland by this method is £1*37 million for 1946-47. An analysis of the registers in Dublin and Belfast for that year shows that, after allowing for exemptions (charities, Government and foreign holdings), about £7$4,000 was liable under Schedule C. The bulk of this was on account of securities held in Northern Ireland, but in addition there was probably a considerable amount held on the London register. Even in the case of Northern Ireland Government securities, about 18 per cent, of Northern Ireland holdings were
433
registered in London; with British Government securities, the pro- • portion is lively to have been much higher.29
Interest on Foreign and Dominion Government securities in Schedule C is comparatively small, and the method of apportionment has been to use the distribution given for Dominion and Foreign securities in Schedule D as indicating Northern Ireland's share accurately enough. The proportion for 1944-45 was 1 per cent., and, the resulting amount has been attributed to individuals and companies in the ratio of 0-932 to 0-068. In the same way, Great Britain's share has been attributed to individuals and companies in the ratio of 0-48 to 0-52.
Other Income.
Profits taxes raised in Great Britain and in Northern Ireland are attributed to the two regions in proportion to their respective shares* of the Schedule D profits of companies as previously calculated, Th# total attributable to Northern Ireland on this basis is rather less than the amount actually attributed by the Joint Exchequer Board, hut the deficit is never more than £300,000 (1942-43). In view of the heavier incidence of profits taxes on larger companies (which are the companies in which inter-regional investment is likely to be greatest), it is not improbable that Northern Ireland's share on either reckoning is underestimated. For the purpose of the calculation, the total amount attributed by the Joint Exchequer Board is taken, but in determining the region in which the profits taxes arise the proportions found in the above calculation are used.
Income from Northern Ireland Government securities is included in Schedule D. But part of the interest payment is made through the Belfast agents and part through the London agents where the stock is registered in London. Interest payments to outsiders whose stock is registered in Belfast are more than taken care of by the use of a fairly high proportion for companies (30*7 per cent.).30 It is necessary, however, to add to the resulting figure that part of interest on Northern Ireland Government stock which is paid in Great Britain and, in so far as it is paid to non-residents, to reckon it as part of the outflow.
Other interest payments which should be reckoned as part of aggregate income include bank deposit interest, co-operative society share and loan interest, and building society interest. Much of this is in small amounts and does not find its way into income-tax returns. To cover all these cases, it has been assumed that the understatement is equivalent to half the Trustee Savings Bank and Post Office Savings1 Bank interest accruing to Northern Irelanders each year. Interest on Savings Certificates is expressly exempted from tax, and the imputed amount has been included in full. It is assumed that, since National' Savings Certificates were not on general sale in Northern Ireland till
29 Since no allowance is made for taxed income in schedule C belonging to foreigners,
Northern Ireland's share is somewhat over-estimated. On the other hand, as was pointed out earlier, all foreign income arising in the United Kingdom was allowed1
off schedule D, resulting in an underestimate of Northern Ireland's share in that' schedule.
30 The proportion of the total entering schedule D for Northern Ireland (i.e.
the middle of the war, any amounts held by Northern Irelanders prior: to that were equivalent to the holdings of Ulster Savings Certificates by non-residents. That part of the interest due to the reinvestment of Ulster Savings Certificates with the United Kingdom Exchequer has been treated as arising outside Northern Ireland.
Charities' income is taxed at source in so far as it enters Schedule D, but is only partially taxed under Schedule C.01 No information exists as to the amount of interest under Schedule C paid without deduction of tax, but an examination32 of the income of securities held by the Official Trustees of Charities Funds in 1926-28 and 1932-34 showed that about two-thirds of the interest received was from British Government securities. Assuming that the same proportion holds for Northern Ireland, an amount equal to twice the income of charities under Schedule D has been added to allow for this. All these elements of the provincial income are brought together in Table 10.
Income from Farming for the years 1939-40 onwards has been obtained directly from the Ministry of Agriculture. The estimate consists of the value of produce sold off farms or consumed in farm households, plus subsidies directly paid to farmers, less farm expenses on feeding stuffs, fertilisers, rent, etc. It is thus equivalent to farm-ing profits and wages. In calculatfarm-ing farmfarm-ing profits no allowance has been made for changes in stock. Moreover, rent has been deducted at the full Schedule A valuation less allowances. This exceeds the interest part of land annuity payments (£0*4 million) by a constant amount of approximately £1-3 million per annum. The effect of this has been to split farmers' income into two parts, the first being the profit part which is included with agricultural wages to give " Income from Farming 7', and the second, the rent part which farmers pay to themselves and which is included in Table II as part of the item Rent in the first column. For years prior to the war, farming expenses were calculated by running back the Ministry of Agriculture's estimates on indicators.
Transfer income includes unemployment benefit and unemployment assistance, health and maternity benefit, family allowances, outdoor relief, old age pensions, and the value of free issues of vitamins and milk. Income of Government and local authorities consists of0 the interest element in income derived by the Government from land annuities, interest on advances to industry, dividends and income derived from investments outside Northern Ireland, the trading profits of local authorities and income from property.
Rent is given as the net true income under Schedule A: that is, the annual valuation of all property less the repairs allowance. It includes, therefore, the imputed rent of agricultural land, as well as property belonging to charities and persons below the exemption limit. Only a small proportion of real property situated in Northern Ireland belongs to non-residents, 33 and, for want of better informa-tion, it is, therefore, assumed that the outflow and inflow of income
31 Cf. Stamp : British Incomes and Property, p. 165. In a note on deductions made under schedule C it is stated : " This also forms only a part of the whole of schedule C income belonging to charitable bodies, some of it not being charged at all, and excluded from Gross Income." See also H. Catapion, Public and Private Property, pp. 47-49.
82 See H. Campion, ibid., p. 49, footnote.
Income from Trade, Professions and Investments, including Interest and Dividends from Outside Northern Ireland.
£ million. Source of Income
Income arising outside Northern Ireland :
Excess Profits Tax & Profits Tax arising in G.B. ...
Schedule D Income of Coys. & Local Authorities in G.B.
Schedule C Income (British Govern-ment Securities) ...
Schedule C Income (Foreign & Dominion Govt. Securities) National Savings Certificates Trustee Savings Bank & P.O.
Savings Bank (a) Charities' Income ...
N.I. Government Investment in G.B Total
Income arising in Northern Ireland :
Excess Profits Tax and Profits Tax Schedule D Income plus Income
under exemption limit (b) Profits of Co-operative Societies ... Local Authorities' Trading Profits Interest of N.I. Govt. Debt not
entering Schedule D in N.I. (c) Total
Grand Total Income due to Outsiders (d) Govt. & Local Authority Income(e) Deadweight Debt Interest of N.I. Government & Local Authorities Employers' Contribution to Social
Insurance (/) 1935-6 — 6-9 0-9 0-4 — 0-4 0-3 0-2 9 1 .
— 0-1 0-1 0-3 1 2 0 21-1 2 0 0-7 1-2 0-9 1936-7 — 7-4 0-9 0-4 — 0-4 0-3 0-2 9-6 — 11-9 0-1 — 0-3 12-3 21-9 2-0 0-6 1-2 1 0 1937-8 —. 7-7 0-9 0-4 — 0-5 0-3 0-3 10-1 — 11-7 0 1 0 1 0-3 12-2 22-3 2-0 0-7 1-2 1-0 1938-9 0 1 7-2 0-9 0-4 — 0-5 0-3 0-3 9-7 0-1 11-3 0-1 0-1 0-3 11-9 21-6 1-9 0-7 1-1 1-0 1939-40 0-2 6-8 0-9 0-4 —. 0-5 0-3 0-3 9-4 0-2 13-7 0-2 0-1 0-3 14-5 23-9 2-2 0-8 1-1 1-0 1940-1 0-7 7-5 0-9 0-4 0-1 0-6 0-3 0-3 10-8 0-9 17-4 0-2 0-2 0-3 19-0 29-8 2-7 0-9 1-2 1-2 1941-2 1-7 8-5 1-0 0-3 0-2 0-7 0-3 0-3 13-0 2-8 19-4 0-2 0-1 0-3 22-8 35-8 3 1 0-9 1 1 1-3 1942-3 2-4 9-4 1 1 0-3 0-3 0-8 0-3 0-4 15-0 5-3 19-3 0-3 0-4 0-3 25-6 40-6 3-3 1-3 1-1 1 5 1943-4 3 1 9-8 L-2 0-2 0-4 1 0 0-3 0-5 16-5 7-2 21-2 0-3 0-3 0-3 29-3 45-8 3-8 1-3 1-0 1-5 1944-5 3-2 10-2 1-3 0-2 0-5 1-2 0-3 0-5 17-4 7-3 21-9 0-4 0-3 0-3 30-2 47-6 4 0 1-3 1-0 1-5 1945-6 2-9 10-6 1-3 0-2 0-5 1-3 0-3 0-7 17-8 6-8 23-8 0-4 0-2 0-3 31-4 49-2 4-0 1-3 1-1 1-5 1946-7 2-2 11-3 1-4 0-2 0-6 1-4 0-3 0-7 181 4-5 26-2 0-5 0-2 0-3 31-7 49-8 4 1 1-4 1-0 1-8 1947-8 1-8 1 5 0 1-5 0-2 0-5 1-6 0-3 0-9 21-8 4 1 34-3 0-5 0d 0-4 39-4 61-2 6 1 1-5 1 0 2-5
(«) Half of this amount is assessed under Schedule D.
{b) Schedule D income has been reduced by half of the income arising from Trustee and Post Office Savings Bank deposits. Part of the interest income in Schedule D arises outside Northern Ireland but it is partly compensated by attributing all income from Trustee Savings Banks to investment outside Northern Ireland.
c) Includes interest on Treasury Bills and Savings Certificates.
d) Includes profits taxes on investment income of residents of Great Britain, interest on land annuities, local loans and N.I. Government Debt. e) Includes investment income of N.I. Government arising outside Northern Ireland.
-436
under this heading are about equal.34 The results of the calculation are brought together in Tables 11 and 12.
TABUS 11.
Private Civilian Income, Northern Ireland. £ million. Year 1935-36 1936-37 l§37-38 1938-39 1939-40 1940-41 1941-42 1942-43 1943-44 1944-45 1945-46 1946-47 1947-48 Rent 4-3 5-4 5-6 5-7 5-8 5-9 5-9 5-7 5-6 5-8 5-9 8-0 . 6-3 Business and Professional Profits and Interest (a) 19-1 19-9 20 3 19-7 21-7 2 7 1 32-7 3 7 3 42-0 43-0 45-2 45-7 5 5 1
Wages and Salaries (non-atrricultural) 32-1 34-3 35-8 35-4 39-1 48-0 58-8 69-5 74-4 74-0 73-4 76-5 79-5 Income from Farrnuig (including Wages) 7-7 GO 6 4 6-8 11-1 17-9 2 1 1 22-6 22-9 24-3 21-9 30-5 3 2 1
Transfer Income 5-6 5-8 6-5 7'J 6-4 6-8 5-5 5-6 6 0 6-5 7-3 9-6 11-1 Less Trading Profits of Government and Local Authorities(fe) 0-7 0-fi 0-7 0-7 0-8 0-9 0-9 1-3 1-3 1-3 1-3 1-4 1-5 Private Income before Tax 68-1 71-7 73-9 7 4 0 83-3 104-8 1231 139-4 149-6 152-9 152-4 166 9 182-6
(«) Including interest on Northern Ireland government investments outside the province, but excluding income due to outsiders.
(b) including interest on Northern Ireland government investments outside the province.
TABJLE 12.
" Regional " Income Northern Ireland. £ million. Year 1935-36 1936-37 1937-38 1938-39 1939-40 1940-41 1941-42 1942-43 1943-44 1944-45 1945-46 1946-47 1947-48 Private Income before / Tax 68-1 71-7 73-9 740 83-3 104-8 123-1 139-4 149-6 152-9 152-4 166-9 182-6 Less Transfer Income and Deadweight Debt Interest 6-8 ' 7-0 7-7 8-2 7-5 8-0 6-6 6-7 7-0 7-5 8-4 10-6 1 2 1
Plus Local Authority and Government Trading Profits and Income from Property
and Interest 0-7 0-6 0-7 0-7 0-8 0-9 1-3 1-3 • 1-3 1-3 1-3 1-4 1-5 " Regional" Income (a) 62-0 85-3 66-9 66-5 76-6 97-7 1174 1340 143-9 146-7 145-3 157-7 172-0 (a) Includes Undistributed Profits, Profits Tax, Excess Profits Tax and Income Tax attributed to Investments in Great Britain.
34 The purchase of property in the centre of Belfast by companies registered
It need hardly be emphasised that these calculations of the aggregate income of Northern Ireland are necessarily of a rough and tentative nature. Firstly, there is a considerable amount of overlap in the periods to which the data refer. In general, the part of income derived from Schedule D may be taken to refer to the particular calendar year first mentioned,35 while the bulk of interest payments , and wages and salaries refers to the financial year ending in March. On the other hand, the agricultural year is from June to May. No attempt has been made to adjust the figures to fit calendar years. Secondly, profits assessed under Schedule D may, for taxation pur-poses, be offset against losses incurred in previous years. Thus, In times of rising income, the rise tends to be understated, especially in the earlier part, of the upward movement, while in times of low income. there is no allowance for current losses. Thirdly, no allowance lias been made for changes in stock valuations. For these reasons, (among others), no strict comparison can be made between Northern Ireland and the United Kingdom.
The concept of income to which the principal figures relate is Private Civilian Income. But an estimate of the income of the province regarded as a region is also given. This roughly corresponds to what is usually taken as national income—net national product at factor cost plus net income from abroad—valued in such a way as to maintain the distinction between a region as part of a larger economy and a region which is functioning independently as a national entity. It is not, therefore, an estimate of what the provincial income would be in the hypothetical ease of Northern Ireland being completely separate from Great Britain, but what the income is, things being as they are. For the purpose of comparison with the national income of the United Kingdom, it is necessary to add to national income as given in the United Kingdom White Papers the- total of internal interest payments on the national debt since, from the point of view of the region taken in isolation, this must be included.
Private Civilian Income, as calculated for Northern Ireland, differs from Private Income as given in the annual White Papers relating to the United Kingdom in that certain elements of Transfer Payments, and Pay and Allowances of members of the Armed Forces which are
there included cannot readily be calculated for Northern Ireland.
The figures for the United Kingdom have been adjusted to allow for these items so as to make possible a broad comparison. This is given in the following table :—
438
[image:23.402.45.362.95.317.2]TABLE 13.
Private Civilian Income {Adjusted) United Kingdom and Northern Ireland, 1938-47.
SOURCES : National Income and Expenditure of the United Kingdom, 1947. Cmd. 7371.
United Nations : National Incotne Statistics 1938-1947.
Year
1938 1939 1940 1941 1942 1943 1944 1945 1946 1947
Total Iiuome
United Kingdom £ million {a)
5,024 5,303 5,987 6,717 7,251 7,618 . 7,723 7,814 8,395 9.322
Northern Ireland £ million
74-0 83-3 104-8 1231 139-4 149-6 152-9 152-4 166-9 182-6
Index Numbers
United Kingdom
100 106 119 134 144 152 154 156 167 186
Northern Ireland
100 113 142 166 188 202 207 206 226 247
(a) Less Pay and Allowances of Armed Forces, less Miscellaneous Transfer Payments.
430
TABLE 14.
Private Civilian Income per Head of Civilian Population, United Kingdom and Northern Ireland, 1938-47.
Year 1938 1939 1940 1941 1942 1943 1944 1945 1946 1947
Income U.K.
£ 106-4 111-0 130-2 149-9 163-7 173-5 175-9 177-6 177-9 193-1
N.I. £ 57-5 64-3 81-8 95-6 107-6 114-9 116-2 115-7 125-2 136-4
Index Numbers U.K.
100 104 122 141 154 163 165 167 167 181
N.I. 100 112 142 166 187 200 202 201 218 237
Northern Ireland as Percentage of United Kingdom
54-0 57-9 62-8 63-8 65-7 66-2 66-1 65-1 704 70-6
The table indicates that, notwithstanding the faster rate of growth in total income and in the average income per head since 1938, the average income per head in Northern Ireland was substantially lower than in the United Kingdom, both at the beginning and at the end of the period. In 1938 it was about 54 per cent, of the United King-dom figure, and even in 1947 it was only about 71 per cent. The main factors responsible for this appear to be, the lower average earnings (as distinct from wage rates) obtained by employed workers, the high degree of specialisation on manufacturing industries in which the value of net output per head is low,36 the higher unemployment rate both before, during and since the war, the larger proportion of the total gainfully occupied population engaged in agriculture, and the smaller proportion of the total population falling within the main working age group.37 But it must be remembered in all these com-parisons that 1938 was a year of heavy unemployment in Northern Ireland. In July the unemployment figure was the highest ever recorded in the province and the average for the year was about 28 per cent. It was therefore far from being a normal year against which to make comparisons. It is indeed unwise to compare very closely the income of any one year with that of any other particular year. This applies more especially to the early part of the period. Nevertheless the inaccuracies are unlikely to be so great as to invali-date the two broad and important inferences that have been drawn, namely, that income per head in Northern Ireland has been substan-tially lower than the average for the United Kingdom, but that throughout the period it has been showing a consistent tendency to catch up.
DISCUSSION
Dr. R. C. Geary.—It is a great pleasure to welcome this paper and
this lecturer in the forum of the Society. It is rather a pity that we could not have arranged a meeting of the Society in Belfast for this
36 Average value of net output per head in 1935 was about 66 per cent, of that of
the United Kingdom. (Census of Production Reports 1935).
37 Males 15—64, females 15-59. Estimates for mid-1948 : 61 per cent, in Northern
440
paper. We have very pleasant recollections of our Belfast meeting of some years ago when Mr. Williams lectured.
Mr. Cuthbert and Northern Ireland are the latest recruits to the growing company of compilers of national income statistics. Like all of us he presents his figures in a proper spirit of Socratic humility. He makes no extravagant claims for their accuracy or their compre-hensiveness but he knows, as we all know, that he is on the right track. His paper: is a model of clarity for the manner in which he describes the statistical methods which he has used and the definition of private income which he has adopted. The title shows that he has limited his estimation to civilian income whereas normally private income includes the income of the armed forces. Mr. Cuthbert has no doubt found, as we all have found—it was a point 1 stressed in a paper I read before the Society some years ago—that for the statis-tician the national income scheme and outlook is of paramount impor-tance in revealing the deficiencies in the national statistics. The national income and social account schemes are all-embracing as regards economic statistics. Every major economic statistics has its place in the national income scheme. If the statistics are not avail-able they must be ascertained. If as estimates they are imperfect their statistical quality must be improved. In the South, all the statistical inquiries on which we have recently embarked or on which we are about to embark, the Household Budget Inquiry, the Farm Survey, the Inquiry into Distribution, various accretions to the annual Census of Production, find their main justification in national income requirements. Even the two most recent Censuses of Popula-tion, those of 1946 and the present year, have questions which have a direct bearing on national income. For instance, the rent question in the 1946 Census gave data which was used in our latest national income publication.
It is," of course, a pity that a paper of this kind could not be cir-culated well in advance so that it could be properly discussed. The secretaries were quite right to take the paper at very short notice because otherwise it would have had to be held over until next session. I personally had the advantage, through the courtesy of the hon. secretaries, of seeing the typescript; in fact wild horses would not have kept me away from the paper when I heard of it. I made a few notes at the firslt reading which I have been comparing with the final text of the paper.
, 1. Pre-war agricultural income statistics seem much too low as aver-aging only 17/- per head per week in 1938/9, using the numbers given in Table 1 (1945) for the number of agriculturists. This average is much below the corresponding figure for ithe Twrenty-six Counties at the same period which at over £1 per head was low enough in all conscience. The Northern Ireland average is, for example, much below the rate for agricultural labourers. While the more recent estimate of agricultural income seems reasonable, the rise since pre-war seems to be steep even by reference 'to the British figures. In the
Economist of February ,4, 1950, page 248, it is stated that farm
441
in Table 11 of the paper is given as £6-1 million. The difference of at least £8-7 million for farm expenses, feeding stuffs, fertilisers, seeds, rents, etc., seems unduly high. Reading from the chart facing page 74 of the Yearbook, the corresponding total for gross output of farms in 1947/8 appears to be about £44-5 million, and for this year the Agricultural Income is given as £32*1 million. The difference of £12-3 million for farm costs in this year seems to indicate that the corresponding figure for 1938/9 is too high.
2. Also connected with the previous point, one has the impression that the average private income per head in Northern Ireland at £58 is too low. It is round about the Twenty-six Counties figure of £57 per head, and this seems doubtful in view, in particular, of the rela-tively low agricultural population in the North, though, of course, the high industrial unemployment may be the explanation. The com-parison for 1947, namely £138 per head as compared with £113 for the Twenty-six Counties, seems much more reasonable. Upward adjustment of the pre-war agricultural income estimates would, of course, bring the trend since more into line with the British and the Twenty-six Counties trends. See also the following paragraph.
3. While the reasons for the author's choice are clear in taking the figures he does in column (b) of Table 4, it is suggested (diffidently) that it might be more suitable to take as an indicator the estimated numbers of persons (in non-agricultural occupations) insured under the Unemployment Insurance Acts, and to deduct the estimated num-bers unemployed. This method would include the large numnum-bers of wage-earners in distribution and transport which have probably not increased as much as those in production and manufacture.
The lecturer has made a good start in the task of endowing the North with a series of national income tables. He must now persevere with the good work. His present figures relate only to private civil income. The next stage will be to produce tables of national income in its various broad economic sectors, tables of national expenditure also categorised, tables of capital formation and savings and esti-mated expenditure at constant prices whereby the trend in the stan-dard of living of the community can be established and tables for the public authorities sector. The programme is a formidable one and no denying. The problem of producing statistics for regions is far more complicated than for administrative units as a whole. We in the South will in due course tackle the regional problems but we cannot begin to do so until the results of the Household Budget Inquiry, the Farm Survey and the Census of Distribution plus a further notable contribution from our good statistical friends, the Revenue Commission, to prepare data on a regional basis. A major difficulty in the South, which is exacerbated in the North, is the enormous traffic without let or hindrance of persons and commercial transactions into and out of the areas. Controls are irksome but they make for good statistics.
442
especially risky without formidable qualifications, the principal of which is perhaps the difference in the rates of direct taxation and the difference incidence of transfer payments of which social security payments are the most important. I will give a simple example by way of caution. Suppose that there are two communities, each con-sisting of two persons, the one concon-sisting of Mr. Ebenezer Scrooge in his more interesting pre-reformation phase with an income of £5,000, and an aged and decrepid neighbour with an income of £50, barely enough to keep body and soul together. The other community consists of Mr. Cheeryble also with an income' of £5,000 and also with a decrepid neighbour with £50. The two communities differ, however, in that Mr. Scrooge is unmindful of his charitable obligations where-as Mr. Cheeryble gives every year £1,000 to his unfortunate neigh-bour. The average private income per head in Mr. Scrooge's domain would be £2,525 and in Mr. Cheeryble's it would be £3,025, while the true income in the two domains is. of course, identical. This kind of objection admittedly vanishes if you compare the national income (which does not include transfer payments) but formidable differences obtrude themselves. You cannot usefully compare, for instance, the national income per head of the U.S.A. with that of this country by using the rate of exchange of $2.80 to the £. The true conversion factor is nearer to $7 than to $3. There is also the problem of com-paring two communities, one of which has a higher proportion in agriculture than the other. As a fact, whatever be the equity,- in every country agricultural income per head is far lower than non-agricultural income per head. It would be far better to dispense altogether with international comparisons of national income statistics. The statistics are recognised to have an essential impor-tance for the formulation and criticism of public policy within each economy.
The President considered that the statistical aspect of Northern
Ireland affairs made an attractive showing. Like Dr. Geary he deprecated statistical comparisons between Northern Ireland and Eire. Economic conditions and political policies, e.g., in the matter of social services and agricultural prices, were so different that such compari-sons were apt to be misleading.
A great deal, in fact nearly all, the increase in " regional " income in both areas was an affair of higher monetary valuations, and there had been little increase in the real income though doubtless a redis-tribution of real income in favour of the underprivileged classes.
We could not accept as convincing the estimate of £6*1 millions in Table 11 as the income from Farming (including wages) in 1938/39. According to the Northern Ministry of Agriculture (Monthly Report, November, 1948, p. 196), the gross output of Northern agriculture averaged £15,183,000 between 1937/38 and 1938/39. Farm income is normally a much higher proportion of gross output than that sug-gested by Mr. Cuthbert's estimate in this case. Mr. Cuthbert's esti-mate for 1946/47, £30*5 millions, corresponds more appropriately to the Ministry's estimate of gross output in that year—£39,740,000— and is probably near the mark.
Mr. Guthbert: I should like to thank those who have taken part in
the discussion for their very important and constructive comments. I myself do not feel at all happy about the estimates of income from agriculture in the pre-war period. It should, however, be explained that the definition of farming income is somewhat different from that used in the official estimates for Eire. Rent has been deducted at the Schedule A valuation which is in total greater than the interest element of land annuities that, in fact, farmers pay. The result is that, as in the estimates of National Income and Expenditure of the United Kingdom, part of farming income (about £1-3 million per annum) is included in the item rent. If we are to make a rough test of the adequacy of the figures for farming income by comparing it with the income from farming in Eire then £1*3 million should be added to the amounts given for each year in Table 11. At the same time the numbers engaged in farming as given in the return of the Ministry of Agriculture were a good deal lower in the pre-war years than in 1945. The labour force had been declining steadily from 1924 and reached its lowest point in 1938. Thereafter it began to increase, reaching a maximum in 1945, the increase being of the order of 18,000 workers. Allowing for these two factors, the income per head in 1938 averages about 23/- per week, but I agree with Dr. Geary that it still seems low and before this paper appears in the Journal of the Society I hope to be able to revise the estimates.1
1 The estimates of Income from Farming for pre-war years have been revised