Khushboo et al. World Journal of Pharmaceutical and Life Sciences
DEVELOPMENT AND VALIDATION OF HPLC METHOD FOR SIMULTANEOUS
ESTIMATION OF CURCUMIN AND ELLAGIC ACID IN HERBAL FORMULATION
Soni Khushboo* and Rathore Anuradha
Department of Pharmaceutical Chemistry, Swami Vivekanand College of Pharmacy, Indore (M.P) India.
Article Received on 21/10/2019 Article Revised on 11/11/2019 Article Accepted on 01/12/2019
INTRODUCTION
Analytical method development and validation shows crucial role in the discovery, development and manufacture of pharmaceuticals. These methods used to ensure the identity, purity, potency and performance of drug products. There are many factors to consider when developing methods. The initially accumulate the information concerning the analyte’s physiochemical properties (pKa, logP, solubility) and determining which mode of detection would be convenient for analysis. The many of the analytical development effort goes into validating a stability indicating HPLC method. The pursuit of the HPLC method is to attempt and separate quantify the main active drug, any reaction impurities, all available synthetic interlude and degradants.
Different types of quantitative analytical techniques are there, for eg: HPLC, Gas chromatography, TLC, Ion chromatography and Column chromatography, UV/Visible spectroscopy, FT-IR, LC-MS, GC-MS, MASS and NMR.
Some steps involve in method development which is : Physicochemical properties of drug
Set up HPLC conditions Sample preparation Method optimization
Validation of developed method
MATERIAL AND METHOD Material
Composition of Dihar manufactured by Rajsha Pharmaceuticals, Ahmedabad Antidiabetic herbal formulation (Tablet 100 mg).
Common Name Botanical Name Part Used Family Composition (%)
Black Berry Syzygium Cumini Seed Myrtaceae 10
Bitter Ground Momordica Charantia Fruit Cucurbitaceae 10 Indian Gooseberry Embelica Officinalis Fruit Euphorbiaceae 20 Rams Horn Gymnema Sylvestre Leaves Asclepiadaceae 10 Nagajivha Enicostemma littorale Entire Plant Gentianaceae 10
Neem Azadirachta Indica Leaves Meliaceae 10
Gulancha tinospora Tinospora cordifolia Root Menispermaceae 10
Turmeric Curcuma longa Rhizome Zingiberaceae 18
World Journal of Pharmaceutical and Life Sciences
WJPLS
www.wjpls.org
SJIF Impact Factor: 6.129*Corresponding Author: Soni Khushboo
Department of Pharmaceutical Chemistry, Swami Vivekanand College of Pharmacy, Indore (M.P) India.
ABSTRACT
We aimed to ‘‘Development and validation of HPLC method for simultaneous estimation of curcumin and ellagic acid in herbal formulation’’ The developed simultaneous shim-pack HPLC C18 column (250 X 4.6 mm, 5 μm) method is simple, sensitive, specific and rapid for qualitative and quantitative estimation of Curcumin and Ellagic acid either individually or in combination in Dihar Tablet products, herbal antidiabetic medicines as per the regulatory needs. On the other side, estimation in Herbal formulation and impurities estimation are possible by the help of chromatography methods. The presented information is useful for the researchers especially those involved in the Method development and quality control of Ellagic acid and Curcumin.
2 Methods
2.1 Selection of wavelength
Suitable wavelength for the HPLC analysis was determined by recording UV spectrums in the range of 200-400 nm for individual drug solutions of ellagic acid (ELA) and curcumin (CUR) then overlapped. UV overlain spectra of these two markers showed that the drugs absorb appreciably at 366 nm and hence 366nm was taken as a detection wavelength for HPLC analysis (Fig. 1).
2.2 Chromatographic conditions
The method was developed using reverse phase, shim-pack HPLC C18 column (250 X 4.6 mm, 5 μm). The run time was of 10 min. The mobile phase used was 0.02 M potassium dihydrogen orthophosphate buffer (pH adjusted to 3.5 with orthophosphoric acid) and acetonitrile in the ratio 60:40 at a flow rate of 1.2 ml/min, column temperature maintained at 35 °C and a detection wavelength of 255 nm using a UV-visible detector.
2.3 Preparation of 0.02 M phosphate buffer (pH 3.5) About 2.72 g of potassium dihydrogen orthophosphate was accurately weighed and dissolved in 950 ml of
water. The pH was adjusted to 3.5 with orthophosphoric acid and the volume was made up to 1000 ml in volumetric flask. The solution was then filtered using 0.45 μ membrane filter.
2.4 Preparation of standard solution
100 mg of ellagic acid (ELA) and curcumin (CUR) standard were accurately weighed and transferred into 100 ml volumetric flask respectively. About 70 ml solvent (Methanol) was added, sonicated to dissolve and diluted up to the mark using solvent (1000 ppm). Final concentration of ellagic acid (ELA) and curcumin (CUR) were made to 10 ppm and 7 ppm respectively by suitable dilutions.
2.5 Sample preparation
Accurately about 100 mg of tablet powder was extracted with 100 ml methanol. The sample solution was filtered to obtain a clear solution. The stock solution after suitable dilutions was used for further analysis.
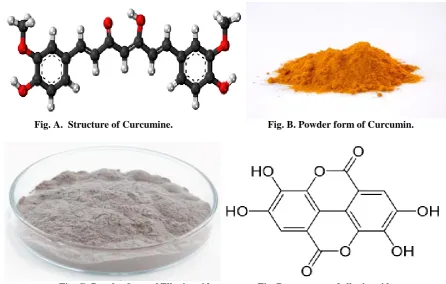
Fig. A. Structure of Curcumine. Fig. B. Powder form of Curcumin.
Fig. C: Powder form of Ellagic acid. Fig. D: structure of ellagic acid.
2.6 RESULTS
Suitable wavelength for the HPLC analysis was determined by recording UV spectrums in the range of 200-400 nm for individual drug solutions of ellagic acid (ELA) and curcumin (CUR) then overlapped. UV overlain spectra of these two markers showed that the drugs absorb appreciably at 366 nm and hence 366nm
Overlapped wavelength 366 nm
Fig. 1: UV Spectra of ELA and CUR.
A reverse phase HPLC method was developed keeping in mind the system suitability framwork i.e. resolution factor between peaks, tailing factor, number of theoretical plates, runtime and the cost effectiveness. The developed optimized method resulted in the elution of
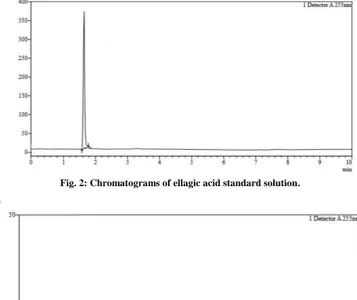
ellagic acid at 1.65 min and curcumin at 2.94 min. Fig. 2 and 3 represent chromatograms of ellagic acid and curcumin standard solution respectively. The total run time was 10 min.
Fig. 2: Chromatograms of ellagic acid standard solution.
System suitability tests are an integral part of method development and are accustomed to ensure tolerable performance of the chromatographic system. Retention time, number of theoretical plates, peak resolution and
peak tailing circumustance were evaluated replicate injections of the standard working concentration.
The results given in table 1 were within the acceptable limits.
Table 1: System suitability studies results.
S/No. Parameters Acceptance Limit Ellagic acid (ELA Curcumin (CUR)
1. Retention time - 1.68 2.98
2. Resolution factor NLT 2 - 8.14
3. No. of theoretical plate NLT 2000 3618 3889
4. Tailing factor NMT 2 1.05 1.31
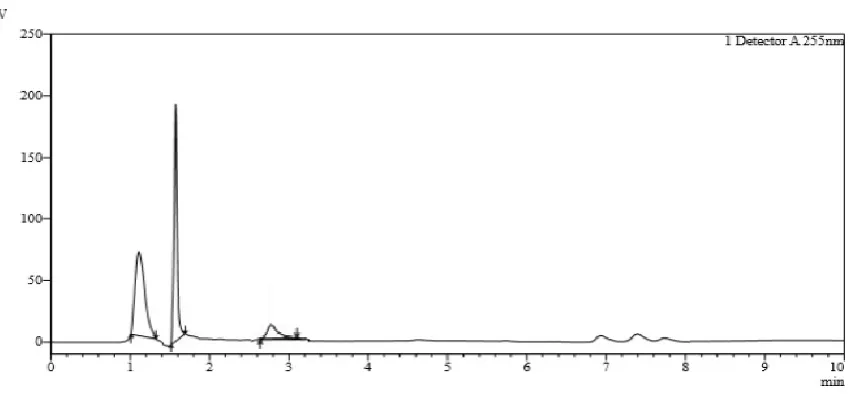
In order to test the applicability of the developed method to an herbal formulation, tablet powder extracts were chromatographed and it is shown in fig. 4.
Fig. 4: Chromatograms of herbal formulation.
The sample peaks were identified by comparing the relative retention times with standard markers (fig. 2,3). System suitability parameters were within the acceptance limits, ideal for the chromatographed sample. Integration of separated peak area was done and each marker concentration was determined by using the peak area concentration relationship obtained in the standardization
step. For the analysis of sample, extract of 100 ppm of tablet powder was injected in triplicate and quantified for two active markers using linear regression equation.
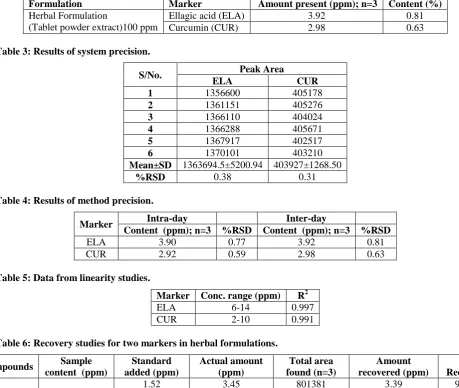
The results of tablet powder extract analysis are reported in table 2.
Table 2: Analysis of herbal tablet powder extract.
Formulation Marker Amount present (ppm); n=3 Content (%)
Herbal Formulation
(Tablet powder extract) 100 pm
Ellagic acid (ELA) 3.92 0.81
Curcumin (CUR) 2.98 0.63
1. Method validation
Validation of the analytical method is the method that confirmed along laboratory studies in which the performance characteristics of the method meet the stipulations for the intended analytical application. The developed HPLC method was validated according to ICH guidelines for validation of analytical procedures. The method was validated for the parameters like linearity, accuracy, system precision, method precision, robustness, limit of detection and limit of quantitation.
3.1 Specificity
3.2 Precision
3.2.1 System precision
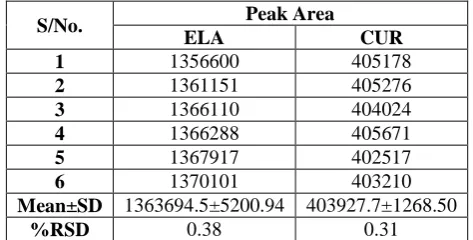
Six replicate injections of the standard solutions at working concentration demonstrated percent relative standard deviation (% RSD) less than 2 relating peak area for each marker, which indicates the tolerable reproducibility and thereby the precision of the system. System precision results are tabulated in table 3.
3.2.2 Method precision
Method precision was determined by performing the analysis of the sample under the test of repeatability at working concentration. Three injections of the sample from the same homogeneous mixture at working concentration showed % RSD less than 2 concerning content of two markers indicate that the method developed is precise by the test of repeatability and
hence can be understood that the method gives consistently reproducible results (table 4).
3.3 Linearity
Standard solutions of ellagic acid and curcumin at different concentrations level were prepared in triplicates. Calibration curves were constructed by plotting the concentration level versus corresponding peak areas for each marker. The results show an excellent correlation between peak areas and concentrations level within the tested concentration range of 6-14 ppm for ellagic acid and as that of 2-10 ppm for curcumin (table 5). The correlation coefficients were greater than 0.99 for each marker, which meet the method validation acceptance criteria and hence the method is said to be linear.
Table 3: Results of system precision.
S/No. Peak Area
ELA CUR
1 1356600 405178
2 1361151 405276
3 1366110 404024
4 1366288 405671
5 1367917 402517
6 1370101 403210
Mean±SD 1363694.5±5200.94 403927.7±1268.50
%RSD 0.38 0.31
Note: Results are expressed as Mean±SD; n=6; SD: Standard deviation; %RSD: Percent Relative Standard deviation
Table 4: Results of method precision results.
Marker Intra-day Inter-day
Content (ppm); n=3 %RSD Content (ppm); n=3 %RSD
ELA 3.90 0.77 3.92 0.81
CUR 2.92 0.59 2.98 0.63
Abbr.: n: number of injections (n=3), %RSD: Percent relative standard deviation
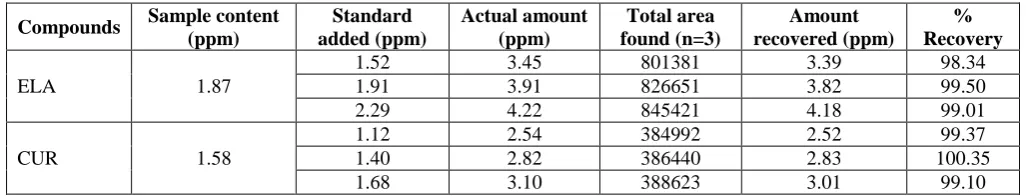
3.4 Accuracy
Accuracy was determined by means of recovery experiments, by the determination of % mean recovery of each compounds in the formulation at three different levels (80%, 100% and 120%). At each level, three determinations were performed. Percent mean recovery was deliberated as demonstrated in table 6. The conventional limits of mean recovery are 98%-102% and fully observed data were within the required range, which indicates good recovery values, okay the accuracy of the method developed.
3.5 Robustness
To determine the robustness of the developed method, experimental conditions were deliberately altered, and the system suitability parameter tailing factor and peak area were evaluated. The solution was prepared as per the test method described earlier and injected at different variable conditions like column temperature (33 °C and
37 °C), flow rate (1.1 ml/min and 1.3 ml/min) and detection at specific wavelength. Robustness data clearly shows that the proposed method is robust at small but deliberate change. Robustness data are given in table 7.
3.6 Sensitivity
The sensitivity of measurement of ellagic acid and curcumin by use of the proposed method were estimated in terms of the limit of quantitation (LOQ) and limit of detection (LOD). LOQ and LOD were calculated by the use of the equations LOD = 3.3σ/S and LOQ = 10σ/S where σ is the standard deviation of intercepts of calibration plots and S is the average of the slopes of the corresponding calibration plot (table 8).
Table 5: Data from linearity studies.
Marker Conc. range (ppm) R2
ELA 6-14 0.997
Table 6: Recovery studies for two markers in herbal formulations.
Compounds Sample content
(ppm)
Standard added (ppm)
Actual amount (ppm)
Total area found (n=3)
Amount recovered (ppm)
% Recovery
ELA 1.87
1.52 3.45 801381 3.39 98.34
1.91 3.91 826651 3.82 99.50
2.29 4.22 845421 4.18 99.01
CUR 1.58
1.12 2.54 384992 2.52 99.37
1.40 2.82 386440 2.83 100.35
1.68 3.10 388623 3.01 99.10
Table 7: Robustness data for two markers in herbal formulations.
Parameters ELA (10 ppm) CUR (10 ppm)
Peak area Tailing factor Peak area Tailing factor
Minus temp (330C) 1356600 1.1 405178 1.28
Plus temp (370C) 1361151 1.02 405276 1.34
Minus flow rate (1.1 ml/min) 1366110 1.01 404024 1.35 Plus flow rate (1.3 ml/min) 1366288 0.99 405671 1.32 Minus wavelength (365 nm) 1367917 1.1 402517 1.24 Plus wavelength (367 nm) 1370101 1.1 403210 1.28
Table 8: LOD and LOQ for two markers in herbal formulations.
Marker LOD (ppm) LOQ (ppm)
ELA 0.63 1.89
CUR 0.15 0.46
RESULTS AND DISCUSSION
Results
Suitable wavelength for the HPLC analysis was determined by recording UV spectrums in the range of 200-400 nm for individual drug solutions of ellagic acid (ELA) and curcumin (CUR) then overlapped. UV overlain spectra of these two markers showed that the drugs absorb appreciably at 366 nm and hence 366nm was taken as a detection wavelength for HPLC analysis (Fig. 1) Overlapped wavelength 366 nm.
A reverse phase HPLC method was developed keeping in mind the system suitability framework i.e. resolution factor between peaks, tailing factor, number of theoretical plates, runtime and the cost effectiveness. The developed optimized method resulted in the elution of ellagic acid at 1.65 min and curcumin at 2.94 min. Fig. 2 and 3 represent chromatograms of ellagic acid and curcumin standard solution respectively. The total run time was 10 min.
System suitability tests are an integral part of method development and are accustomed to ensure tolerable performance of the chromatographic system. Retention time, number of theoretical plates, peak resolution and peak tailing circumstance were evaluated replicate injections of the standard working concentration. The results given in table 1 were within the acceptable limits.
Table 1: System suitability studies results.
S/No. Parameters Acceptance Limit Ellagic acid (ELA Curcumin (CUR)
1. Retention time - 1.68 2.98
2. Resolution factor NLT 2 - 8.14
3. No. of theoretical plate NLT 2000 3618 3889
4. Tailing factor NMT 2 1.05 1.31
In order to test the applicability of the developed method to an herbal formulation, tablet powder extracts were chromatographed and it is shown in fig. 4.
The sample peaks were identified by comparing the relative retention times with standard markers (fig. 2,3). System suitability parameters were within the acceptance limits, ideal for the chromatographed sample. Integration of separated peak area was done and each marker concentration was determined by using the peak area concentration relationship obtained in the standardization step. For the analysis of sample, extract of 100 ppm of
Table 2: Analysis of herbal tablet powder extract.
Formulation Marker Amount present (ppm); n=3 Content (%)
Herbal Formulation
(Tablet powder extract)100 ppm
Ellagic acid (ELA) 3.92 0.81
Curcumin (CUR) 2.98 0.63
Table 3: Results of system precision.
S/No. Peak Area
ELA CUR
1 1356600 405178
2 1361151 405276
3 1366110 404024
4 1366288 405671
5 1367917 402517
6 1370101 403210
Mean±SD 1363694.5±5200.94 403927±1268.50
%RSD 0.38 0.31
Table 4: Results of method precision.
Marker Intra-day Inter-day
Content (ppm); n=3 %RSD Content (ppm); n=3 %RSD
ELA 3.90 0.77 3.92 0.81
CUR 2.92 0.59 2.98 0.63
Table 5: Data from linearity studies.
Marker Conc. range (ppm) R2
ELA 6-14 0.997
CUR 2-10 0.991
Table 6: Recovery studies for two markers in herbal formulations.
Compounds Sample
content (ppm)
Standard added (ppm)
Actual amount (ppm)
Total area found (n=3)
Amount recovered (ppm)
% Recovery
ELA 1.87
1.52 3.45 801381 3.39 98.34
1.91 3.91 826651 3.82 99.50
2.29 4.22 845421 4.18 99.01
CUR 1.58
1.12 2.54 384992 2.52 99.37
1.40 2.82 386440 2.83 100.35
1.68 3.10 388623 3.01 99.10
Table 7: Robustness data for two markers in herbal formulations.
Parameters ELA (10 ppm) CUR (10 ppm)
Peak area Tailing factor Peak area Tailing factor
Minus temp (330C) 1356600 1.1 405178 1.28
Plus temp (370C) 1361151 1.02 405276 1.34
Minus flow rate (1.1ml/min) 1366110 1.01 404024 1.35 Plus flow rate (1.3 ml/min) 1366288 0.99 405671 1.32 Minus wavelength (365 nm) 1367917 1.1 402517 1.24 Plus wavelength (367 nm) 1370101 1.1 403210 1.28
Table 8: LOD and LOQ for two markers in herbal formulations.
Marker LOD (ppm) LOQ (ppm)
ELA 0.63 1.89
DISCUSSION
Method optimization Simultaneous method development is focused on simple, sensitive and rapid determination of the compounds. Suitable wavelength for the HPLC analysis was resolute by recording UV spectrums in the range of 200-400 nm for individual drug solutions of ellagic acid (ELA) and curcumin (CUR) then overlapped. The optimized chromatographic conditions are tuned by changing the organic phase (0.02 M potassium dihydrogen orthophosphate buffer), pH, flow rate and mobile phase concentration. The optimized chromatographic conditions revealed good separation of curcumin and ellagic acid using a mobile phase 0.02 M potassium dihydrogen orthophosphate buffer (pH adjusted to 3.5 with orthophosphoric acid) and acetonitrile in the ratio 60:40 at a flow rate of 1.2 ml/min, column temperature maintained at 35 °C and a detection wavelength of 255 nm using a UV-visible detector. Curcumin and ellagic acid retention times are found to be 1.68 min and 2.98 min respectively (Table 1). Calibration curves were constructed by plotting the concentration level versus corresponding peak areas for each marker. The results show an excellent correlation between peak areas and concentrations level within the tested concentration range of 6-14 ppm for ellagic acid and as that of 2-10 ppm for curcumin (table 5). The correlation coefficients were greater than 0.99 for each marker, which meet the method validation acceptance criteria and hence the method is said to be linear. Analytical method development was carried out as per ICH guidelines. The developed method was evaluated for validation parameters such as precision, specificity, accuracy, linearity, robustness and sensitivity. Specificity of the method shows drugs as blank has no peak at the retention time of ellagic acid and curcumin accordingly, it can be concluded that the method developed is said to be specific. Precision of the method was carried out in two different days with System precision and Method precision. InSystem precisionSix replicate injections of the standard solutions at working concentration demonstrated percent relative standard deviation (% RSD) less than 2 relating peak area for each marker, which indicates the acceptable reproducibility and thereby the precision of the system. System precision results are tabulated in table 3. And Method precision was determined by performing the analysis of the sample under the test of repeatability at working concentration in table 4. Good linearity and range were achieved with a concentration range of 6-14 ppm for ellagic acid and as that of 2-10 ppm for curcumin (table 5). Accuracy was determined by means of recovery experiments, by the determination of % mean recovery of each compounds in the formulation at three different levels (80%, 100% and120%). The accepted limits of mean recovery are 98%-102% and fully observed data were within the required range, which indicates good recovery values, okay the accuracy of the method developed Robustness data clearly shows that the proposed method is robust at small but deliberate change. Robustness data are given in table 7. The sensitivity of measurement of ellagic acid
and curcumin by use of the proposed method were estimated in terms of the limit of quantitation (LOQ) and limit of detection (LOD). LOQ and LOD were calculated by the use of the equations LOD = 3.3σ/S and LOQ = 10σ/S where σ is the standard deviation of intercepts of calibration plots and S is the average of the slopes of the corresponding calibration plot (table 8).
CONCLUSION
The developed simultaneous shim-pack HPLC C18 column (250 X 4.6 mm, 5 μm) method is simple, sensitive, specific and rapid for qualitative and quantitative estimation of Curcumin and Ellagic acid either individually or in combination in Dihar Tablet products, herbal antidiabetic medicines as per the regulatory needs.
ACKNOWLEDGEMENT
The author is thankful to the management of Swami Vivekananda College of pharmacy Indore. For providing necessary facilities to carry out the research work and heartily thankful to my guide Ms. Anuradha Rathore for providing all the support and encouragement to carry out this studies.
REFERENCES
1. Sethi P.D; HPLC: Quantitative Analysis of pharmaceutical formulation; CBS Publisher and distributors; New Delhi, 1996; 113.
2. Davidson A.G.; Becket A.H. and stenlake J.B.; Practical Pharmaceutical chemistry; 4th edition; CBS Publisher and distributors; New Delhi, 1989; 276-99.
3. Jeffery G.H. Bassett J.; Mendham J. and Denrey R.C.; Vogels textbook of Quantitative Chemical Analysis; 5th edition; Longman Group UK Ltd, England, 1989; 6-14.
4. http./wwwyoungincom/application/AN-0608-0115ENpdf.
5. Swarbrick; James B. and James. C.; Encyclopedia of Pharmaceutical Technology.
6. Volume 1; Marcel Dekker Inc; New York, 1998; 217-227.
7. Sahu R. Nagar P. and Jain D.; Indian J. Pharm. Science, 2006; 68(4): 503-506.
8. Jain N.; Jain R.; Swami H. and Pandey S.; Indian Journal of pharmacy and pharmaceutical science, 2009; 1(1): 189-191.
9. Khan M.R. and Jain D.; Indian Journal of pharmaceutical science, 2006; 64(6): 546-548. 10. Meyer Veronica R.; Practical High performance
Liquid Chromatography; 2th edition; John wiley and sons; London, 1993; 56-58.
11. Braumann T.; Weber G. and Grimme L.H.; J. Chromatogr, 1983; 48-65.
13. Aitzemuller K.; Practice of High Performance Liquid Chromatography; springer-Verlag, 1986; 301.
14. SGE International Pty. Ltd TA-0010-H; 2001. 15. Guidence for Indusrty; stability testing of drug
substance and drug product (FDA, Rockville, MD, June) glossary, 1998.
16. ICH; Guidance for industry; Q1A(R2); stability testing of new drug substance and product, Nov. 2003; 1-17.
17. European Council Directive 93/42/EEC of 14 June, 1993.
18. European Council Directive 90/385/EEC of 20 June 1990 on active implantable medical device, 1990. 19. Dan W.; Reynolds kevin L.; Facchine June F. and
Mullaney; Conducting Forced Degradation studies; Pharmaceutical Technology, 2002.
20. FDA; ICH Guideline on the validation of Analysis Procedure; Methodology, Availability, Notice; Federal Register, 19 May 1997; 62(96): 27463-27467.
21. Conner K.A.; G.L.; Amidon; and stella, V.L.; Chemical stability of pharmaceutical; Wiley and Sons; New York; 2nd edition, 1986; 375-384. 22. FDA; ICH; Guideline for the Photostability testing
of New Drug substance and new drug product; ICH Q1B; Federal Register, 16 May 1997; 62(95): 27115-27122.
23. FDA; Centre for Drug Evaluation and Research; Submitting Documentation for the Stability of Human Drug and Biology; Rockville, MD, February 1987; 38.