Malaysian Migration to Australia
Graeme Hugo* The University of Adelaide
Abstract: While there is increasing interest in harnessing the diaspora to assist in development in Southeast Asian countries, there is little known about the actual size and composition of that diaspora. This paper makes innovative use of destination-end data to examine Malaysia’s second largest overseas community in Australia, and its characteristics and linkages maintained with Malaysia. The potential role that the Malaysian diaspora in Australia could play in Malaysian development is then explored.
Keywords: Australia, brain drain, diaspora, Malaysia, migration JEL classification: F22, I24, J15, O15
1. Introduction
Malaysia is one of the world’s quintessential migration countries. Over recent centuries waves of migrants from Indonesia, China and India have added to its Malay and indigenous populations to render it one of the most multicultural of nations. Moreover, as many as a quarter of its contemporary workforce is made up of migrants and migrant workers (Hugo 2009). However, one dimension of Malaysia’s international migration which has important implications for its development remains little explored – emigration. Malaysia has a diaspora of more than a million people, perhaps equivalent to over 5 per cent of the resident Malaysian population. A recent estimate of Malaysia’s Ministry of Human Resources indicates that there are 350,000 Malaysians working abroad, over half of which had tertiary education, while the Malaysian Employers Federation says there are 785,000 Malaysians working in overseas countries (Arbee 2010; Malaysiakini 2010). Malaysia rightly is seen as one of the major immigration nations in the Asian region and its development is inextricably related to that migration, but in a globalising world, transnational migration is not unidirectional. It is more appropriately seen as a system involving both in- and out-migration which are a part of a range of linkages of various types and strengths between both origin and destination. Moreover, regarding the impacts of migration on economic development and social change, migration in both directions is important.
The present paper focuses on one important element in the outflow of emigrants from Malaysia – that directed to Australia. It analyses the pattern of emigration focusing especially on the last two decades, and demonstrates the increasing complexity of the population flows between the two countries with the increasing significance of non-permanent movements and return migration from Australia. It then turns to an examination of some of the characteristics of the contemporary Malaysian diaspora in Australia. The paper concludes with a discussion of some of the implications of emigration and diaspora for development and change in Malaysia.
*
2. Emigration and Development
The last decade has seen increasing academic and policy interest in the relationship between migration and development (World Bank 2006; UNDP 2009). The complexity of this relationship needs to be stressed. Migration can and does have both positive and negative impacts on origin and destination communities; it can support or undermine economic development and social change in the areas of origin. Migration can play a positive role in origin communities, and this provides scope for policy intervention which can, on the one hand, facilitate and enhance those elements of migration which have positive effects, and on the other hand, reduce or ameliorate those which have negative impacts. The design and operationalisation of such interventions requires a deep understanding of the complex interrelationship between migration, development and poverty alleviation.
The discourses on the effects of migration on development are polarised around two schools of thought. On the one hand the ‘brain drain’ perspective sees the impact on origin areas being negative because emigration is selective of the ‘best and the brightest’, resulting in a diminution of human capital and developmental constraints. Alternatively, others point to the inflow of finance, information and ways of doing things which result from emigration as being positive for development. In fact both perspectives have relevance in contemporary migration out of Malaysia.
A ‘brain drain’ involving a net loss of skilled persons from less developed economies in Asia, and a net gain in the more developed economies of the Organisation for Economic Cooperation and Development (OECD), was recognised as long ago as the 1960s (Adams 1968). More recent analyses (Carrington and Detragiache 1998; Dumont and Lemaitre 2005) have confirmed that emigration rates in low income countries are higher for skilled groups and that several economies experience a significant brain drain. Unsurprisingly, in an increasingly competitive global market, OECD countries have placed greater emphasis on the capture of highly skilled and talented workers (Abella 2005). Dumont and Lemaitre’s (2005) comprehensive analysis draws on data collected from 227 sending nations and 29 OECD receiving economies and calculates emigration rates of all highly qualified persons (with a university education) for non-OECD nations. The rates were low for large nations such as Indonesia (1.9 per cent), Thailand (1.9 per cent) and China (3.2 per cent) but much higher for small nations. For Malaysia it was 7.9 per cent.
Staying with positive effects, the diaspora can be both a direct source of foreign direct investment (FDI) and an effective ‘middleman’ to channel FDI towards the home economy. In China and Chinese Taipei, the spectacular economic growth of recent years has been heavily influenced by investment from a diaspora of perhaps 30 million overseas Chinese (Lucas 2003). There has been considerable discussion of how Chinese business and social networks have overcome barriers to international trade. Rauch and Trindade (2002) found that ethnic Chinese have a quantitatively important impact on bilateral trade. The diaspora can also be a bridgehead into expansion of the economic linkages of the home nation. Korean Americans were the bridgeheads for the successful penetration of the United States market by Korean car, electronics and white good manufacturers. Canadian-based studies have shown that a doubling of skilled migration from Asia saw a 74 per cent increase in Asian imports to Canada (Head and Reis 1998; Lucas 2001). Moreover, diaspora networks have become important in transmitting information both formally and informally. This dimension is largely confined to skilled migrants. Lucas (2001: 22) has shown how professionals in origin and destination economies have maintained strong linkages so that ideas flow freely in both directions. Finally, many expatriates return to their homeland country and contribute to development (Conway and Potter 2009).
3. The Malaysian Context
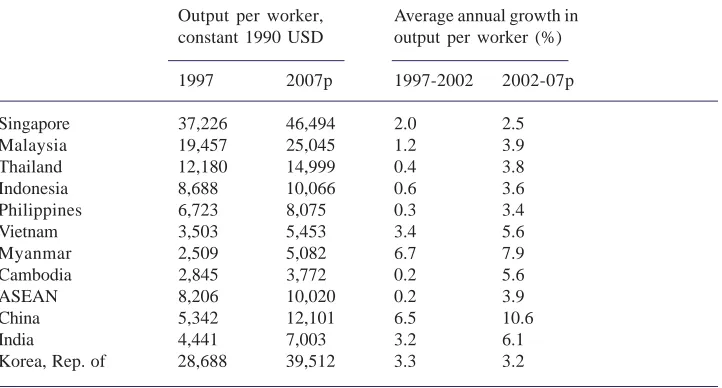
Malaysia has experienced relatively consistent economic growth over four decades which has seen significant improvements in the welfare of its population. Like other Association of Southeast Asian Nation (ASEAN) economies, Malaysia has ‘pursued a growth strategy based on high savings rates, fixed investment, abundant labour supplies and export promotion’ (ILO 2008: 2). An important element in this has been an influx of largely unskilled foreign workers which have not only filled labour shortages in construction, plantations, forestry, manufacturing and services but kept costs down to keep Malaysian exports competitive (Hugo 2011). There is, however, some concern in Malaysia that economic growth has stalled and that in order to take the next step to become an advanced economy there is an urgent need to increase productivity (Schuman 2010). As the ILO (2008: 2) has pointed out, an approach to development based on cheap labour is unsustainable in the long term and the only way to sustain economic growth and social development is through innovation in products, processes and technologies using well educated workers and progressive workplace practices.
but they made up only 2 per cent of the total intake (ILO 2008: 68). The ILO workplace survey found that 52 per cent of companies employed at least one highly skilled foreigner and 17 per cent had at least twenty. There was also a clear relationship between employment of foreign workers and revenue growth.
Although Malaysia is emphatically a net immigration country, it has a substantial emigration which also impinges significantly on its economy and it is that outflow which is the focus of this paper (World Bank 2011). The emigration outflow, while substantially smaller than the inflow, is quite selective of particular groups. On the one hand it is highly skilled and well qualified while on the other it is highly selective of non-bumiputera (non-Malay) ethnic groups. For more than four decades, there has been government intervention in the Malaysian economy in the form of preferential treatment for Malays in order to achieve a more equitable distribution of wealth between ethnic groups. This has led to Malays being given preferential access to education and training as well as employment opportunities. One of the responses to this has been a significant outflow of non-bumiputera (Chinese and Indian Malaysian) groups, especially the well qualified who can gain access to settlement in OECD countries. This emigration has definitely contributed to the shortage of skilled and well qualified workers in Malaysia.
Despite the undoubted benefits of immigration to the Malaysian economy, there has been some opposition based on what are seen as disadvantages of migrants making up Table 1. Output per worker (1997 and 2007) and growth in output per worker (1997-2002 and
2002-07), selected economies
Output per worker, Average annual growth in constant 1990 USD output per worker (%)
1997 2007p 1997-2002 2002-07p
Singapore 37,226 46,494 2.0 2.5
Malaysia 19,457 25,045 1.2 3.9
Thailand 12,180 14,999 0.4 3.8
Indonesia 8,688 10,066 0.6 3.6
Philippines 6,723 8,075 0.3 3.4
Vietnam 3,503 5,453 3.4 5.6
Myanmar 2,509 5,082 6.7 7.9
Cambodia 2,845 3,772 0.2 5.6
ASEAN 8,206 10,020 0.2 3.9
China 5,342 12,101 6.5 10.6
India 4,441 7,003 3.2 6.1
Korea, Rep. of 28,688 39,512 3.3 3.2
Source: ILO (2008: 31)
such a large share of the workforce. One of the major negative arguments is that because migrant workers have low levels of education and occupy low paid positions, they lower Malaysia’s overall productivity and detract from its international competitiveness. It is also suggested that because migrant workers are willing to accept depressed wages, they are delaying necessary technological innovation and progress in the sectors of the economy where they are employed. Aside from deterring local workers from entering specific sectors, low skilled migrants prevent mechanisation and labour saving technology being introduced and hence are a barrier to competitiveness. It is estimated that remittance outflows from migrant workers increased from 2.47 billion Malaysian ringgit (MYR) in 2004 to MYR3.43 billion in 2007, with a negative impact on Malaysia’s balance of payments. These figures are only those which pass through the Malaysian National Bank (Bank Negara) and are much lower than the MYR16 billion estimates found in other studies.While Malaysia’s economy has been growing rapidly, it has been argued that nearly half of the jobs being created are low wage jobs for foreigners. Hence, of the estimated annual creation of 252,600 jobs, some 45 per cent went to migrant workers in 2007.
These arguments have led to the government initiating a number of strategies to reduce the over-reliance on foreign labour. For instance, the Malaysian government has placed a levy on employers who employ foreign workers and this has been increased. Special training programmes have been introduced which train local workers to take over jobs currently occupied by foreigners, and efforts have been made to attract some Malaysians currently excluded from the workforce into the paid workforce, especially women. Subsidies have also been introduced to encourage employers of foreign workers to introduce new labour saving capital intensive technologies to replace foreign workers. It is recognised that such strategies have limited potential in agriculture and some sectors of manufacturing (e.g. rubber gloves, furniture) but in construction, services and some areas of manufacturing there have been initiatives to facilitate labour substitution.
4. Emigration from Malaysia
It is unfortunate that increasing efforts to improve international migration data collection have focused entirely on improving immigration statistics (Tomas and Summers 2009). Like most countries, Malaysia does not collect data on emigration. Accordingly it is not possible to gain an accurate picture of either the trends in the flow of Malaysians leaving the country on a more or less permanent basis, nor of the changing stock of Malaysians living in foreign countries. The Global Migrant Origin Database (2007) puts the stock of Malaysia-born people living in other countries at 784,900. However, these figures significantly underestimate the size of the Malaysian diaspora because the database does not include all countries in which Malaysians are living. Moreover, the database does not include second and later generations born to expatriate Malaysia-born parents, nor does it include many Malaysians who are temporary residents (foreign workers, students etc.). Census data which are the main basis for the database often systematically exclude migrant groups, and there has been substantial emigration since 2000 but most data refers to the 2000 round of population censuses.
diaspora. Nevertheless, the table gives some indication of the major destinations of Malaysian emigrants. By far the largest single Malaysia-born expatriate community is in Singapore, numbering 303,828 in 2000, although the 1.06 million figure for 2010 seems excessive. After gaining independence from the British, Malaysia and Singapore initially constituted a single country, so many older people born in Singapore were born in Malaysia as it was then defined and hence may be included in the 2010 figure. There remains a high degree of interaction ‘across the causeway’ between Malaysia and Singapore. Indeed, each day more than 200,000 Malaysians commute to Singapore to work. There is also a substantial Malaysian community in Brunei (57,346 in 2000 and 81,576 in 2010 – the third largest expatriate group) which also shares international borders with Malaysia and is an oil-rich country with significant labour shortages.
It is noticeable in Table 2, however, that Australia has the second largest overseas Malaysian community and looms as a major part of the contemporary Malaysian diaspora. Moreover, the stock and flow migration data in Australia is more comprehensive than in most countries so there is a real opportunity to examine the nature and potential of the diaspora.
Table 2. Numbers of Malaysians living in foreign countries in global migrant origin
data base
2007 Version 2010 Version
Singapore 303,828 1,060,628
Australia 78,858 119,197
Brunei Darussalam 57,346 81,576
Philippines 56,343 394
USA 51,669 55,007
UK 50,061 65,571
Indonesia 46,850
Canada 21,721 25,477
Germany 16,602 5,431
India 14,932 12,945
Pakistan 13,646
New Zealand 11,460 15,912
Japan 5,849 8,043
Ireland 2,197 4,988
Hong Kong 4,609
Kuwait 3,840
China 2,861
Netherlands 2,784 3,358
Thailand 1,290 3,429
Other
Total 784,900 1,481,202
4.1. Malaysian Migration to Australia
There is a long history of migration between Malaysia and Australia. As indicated in Figure 1 below, however, the Australian Malaysia-born population remained very small up to the 1960s. Although there were strong linkages prior to this due to their common British colonial heritage, the White Australia Policy meant that non-Europeans were effectively excluded from Australia (Price 1974). Indeed, most of the Malaysia-born in Australia until the 1970s were the Malaysia-born children of English and other Europeans working in the Malayan colony. Accordingly, the Malaysia-born population in Australia was only 1,768 in 1947. In the early postwar decades it grew steadily to 2,279 in 1954 and doubled to 5,893 in 1961.1
These numbers include many English-origin groups leaving Malaysia before and after independence was achieved, along with other Malaysians who travelled to Australia under the Colombo Plan of 1950, some of whom married Australians and remained. Accordingly, by 1971 the number of Malaysia-born had almost trebled, numbering 14,945.
The 1970s saw the removal of the last vestiges of the White Australia Policy and opened up Australia to the migration of non-Europeans, albeit those who were able to meet the Skills and Family requirements of the selection system. Hence Figure 1 shows an upturn in the Malaysia-born population in the 1970s, so that by 1981 they had more than doubled to 32,916, making them the third largest Asia-born group in Australia after the India- and Vietnam-born.
1 From 1954 onward it is possible to separate Singapore from the Malaysian population. All data of
earlier years includes Singapore. The earliest figure is from 1861 when there were 150 persons born in the British Malaya Region (Price et al. 1984).
Subsequent inter-censal periods have seen continued growth in the Malaysia-born category. The most recent estimate of the Malaysia-born population in Australia was made on 30 June 2010, numbering135,607 – the ninth largest overseas-born group in Australia. It is interesting to note in Figure 2, however, that there has been considerable annual variation in the flow of Malaysian settlers to Australia. The period of peak inflow was in the 1980s with a downturn during the period of low economic growth in the 1990s but recovering in the last decade.
2 This ‘other’ element predominantly consists of New Zealand residents who have relatively free access
to Australia under the Trans Tasman agreement. The number of Malaysians who migrate to Indonesia and then subsequently move to Australia is relatively small (DIAC 2011a: 44).
Figure 2: Australia: Settler arrivals from Malaysia, 1959-60 to 2010-11
Source: DIMIA Australian Immigration: Consolidated Statistics, various issues and DIAC unpublished data
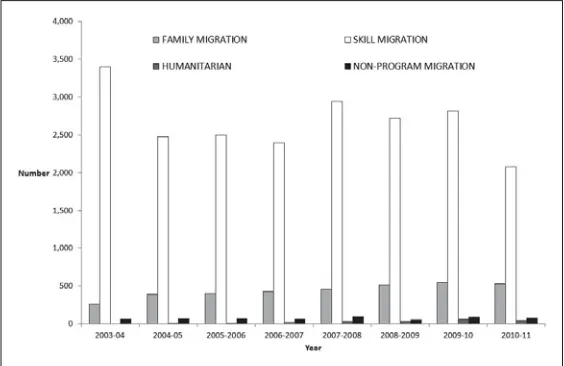
One of the defining characteristics of permanent immigration to Australia since the mid-1990s has been the increasing focus of immigrant selection based on skills, and a reduction of the importance of family migration (Hugo 1999). This has certainly been the case in Malaysian immigration to Australia. Figure 3 shows how highly skilled migration has dominated Malaysian immigration in recent years. To qualify as skilled migrants, applicants are assessed and received points on characteristics such as qualification, language, work experience and age. Only highly skilled people are able to enter under this migration stream.
Figure 3: Australia: Malaysia-born by visa category, 2003-04 to 2010-11 Source: DIAC unpublished data
Until the mid-1990s Australia’s immigration policy focused almost entirely on permanent settlement and temporary labour migration was eschewed. However, this has changed dramatically with the introduction of a skilled temporary worker visa as well as student and working holiday maker visas (Khoo et al. 2009). This has prompted a paradigmatic shift in Australian migration and has also reshaped Malaysian migration to Australia. Accordingly, Figure 4 shows how long-term arrivals (persons entering Australia on a temporary residence visa but intending to leave after more than one year in Australia) shows a strikingly different pattern to permanent migration flows in Figure 2. There has been a rapid increase in the temporary migrant inflow from Malaysia, especially in the last decade when it has doubled, reaching 20,238 in 2010-2011 (or 4.4 per cent of the total inflow of long term migrants). It is clear that to some extent temporary migration is being used by some highly skilled Malaysians who hitherto would have used the permanent migration avenue to Australia.
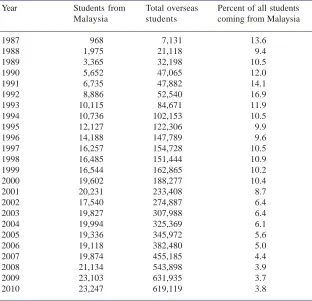
Table 3 shows the numbers of Malaysian students arriving in Australia over the last two decades. The increase in the 1990s, when the Australian government actively began to encourage student migration, is readily apparent. Although the proportion of all Malaysian student migrants coming to Australia has decreased, the overall numbers have increased, reaching a peak of 23,247 in 2010.
While the substantial temporary emigration of students has the potential to enhance Malaysia’s human resources and contribute to development through return migration, this potential has been diluted by an increasing number remaining in OECD nations after completing their studies and seeking permanent residence. In Australia this has been facilitated by applicants for migration getting added points in the assessment for skilled migration for having an Australian qualification. Table 4 shows the balance between ‘onshore’ and ‘offshore’ settlers from Malaysia added to the Australian population between 2001 and 2010. It should be noted that there is a strong pattern of ‘onshore’ settlement involving Malaysians changing their status from temporary to permanent. There is, therefore, a pattern of Malaysians travelling to Australia as students and then, upon completion of their studies, converting to permanent residence. From 2008-2009, for example, there were 2,072 Malaysians who changed status from student to permanent resident visas in Australia, while there were 3,324 Malaysians who arrived with a settler visa.
Temporary skilled migrant workers (officially classified as 457s) are also an increasingly important part of the migrant flow from Malaysia to Australia. The 457 Program is similar to the HB1 visa in the United States and is entirely demand driven, while the number of permanent immigrants is capped by government. Employers can apply to bring in workers for a period of up to four years and there are minimum skill and salary levels which apply (Khoo et al. 2009). The 457 Program is only available to highly skilled workers, in particular
Figure 4: Long-term arrivals from Malaysia, 1959-60 to 2010-11
Table 3. Australia: Overseas students from Malaysia, 1987-2010
Year Students from Total overseas Percent of all students
Malaysia students coming from Malaysia
1987 968 7,131 13.6
1988 1,975 21,118 9.4
1989 3,365 32,198 10.5
1990 5,652 47,065 12.0
1991 6,735 47,882 14.1
1992 8,886 52,540 16.9
1993 10,115 84,671 11.9
1994 10,736 102,153 10.5
1995 12,127 122,306 9.9
1996 14,188 147,789 9.6
1997 16,257 154,728 10.5
1998 16,485 151,444 10.9
1999 16,544 162,865 10.2
2000 19,602 188,277 10.4
2001 20,231 233,408 8.7
2002 17,540 274,887 6.4
2003 19,827 307,988 6.4
2004 19,994 325,369 6.1
2005 19,336 345,972 5.6
2006 19,118 382,480 5.0
2007 19,874 455,185 4.4
2008 21,134 543,898 3.9
2009 23,103 631,935 3.7
2010 23,247 619,119 3.8
Source: DEST Overseas Student Statistics, various issues and Australian Education International (1987-2001 Birthplace, 2002-10 Nationality)
Table 4. Australia: Permanent additions of Malaysia-born, 2001-02 to 2009-10
Onshore Offshore Total Percent
Onshore
2001-02 720 1,939 2,659 27.1
2002-03 1,221 2,686 3,907 31.3
2003-04 1,383 3,718 5,101 37.2
2004-05 1,860 2,936 4,796 38.7
2005-06 1,850 2,967 4,817 38.4
2006-07 1,938 2,899 4,837 40.1
2007-08 1,617 3,522 5,139 45.9
2008-09 2,072 3,324 5,396 38.4
2009-10 1,544 3,507 5,051 44.0
occupational categories with a minimum salary level. Hence, as with the permanent settlement and student categories, there is a high degree of selectivity on the basis of skill. Table 5 below shows that the number of 457s from Malaysia has increased rapidly up to 2007. Thereafter the impact of the global financial crisis (or Great Recession) and an official review of the 457 System saw a reduction in national numbers and in those from Malaysia. In contrast, data from June to August 2011 shows an increase of more than a quarter over the previous years and that Malaysia is the fourth largest Asian provider of 457s (DIAC 2011b). As is the case with students, many 457s from Malaysia apply for, and are granted, permanent residence in Australia. Temporary migration, like permanent migration, from Malaysia to Australia is selective of the highly skilled.
Table 5. Malaysia: Stock of temporary residents in Australia (minus students)
Year Visitors Temporary residents 457s
(at 30 June) present present minus students
2011 5,894 3,086 1,145
2010 5,831 3,378 2,258
2009 8,227 3,116 2,612
2008 8,020 2,858 2,392
2007 7,279 2,298 1,818
2006 6,848 1,871 1,353
2005 6,552 1,678 1,070
2004 5,973 1,532
2003 6,153 1,392
2002 6,119 1,230
2001 5,641 1,115
2000 6,176 817
1999 5,597 628
1998 402
Source: DIAC Immigration Update, various issues; Khoo et al. 2009
4.2 Characteristics of Malaysian Immigrants to Australia
An important element in the emigration out of Malaysia is the dominance of ethnic Chinese in that movement. In the 2006 Australian census almost two-thirds (62.7 per cent) of the Malaysia-born population indicated that they had Chinese ancestry, 11.7 per cent Malay, 5.7 per cent Indian and 4.7 per cent English.3 This is also reflected in the languages spoken at home among the Malaysia-born population reported at the 2006 population census. Almost half the Malaysia-born population in Australia spoke Mandarin (20.2 per cent) or Cantonese (26.4 per cent) at home, while only 5.8 per cent spoke Malay.
It is significant that there has been consistency in the ethnic composition of Malaysian migration to Australia. According to Table 6 below, the proportion of ethnic Chinese Malaysians was similar at both the 1986 and 2006 Australian censuses. It is interesting to note that the proportion considering themselves ‘English’ declined, reflecting the decreasing significance of the Malaysia-born children of English colonial functionaries by 2006. Clearly, emigration from Malaysia is highly skewed towards ethnic Chinese, who made up less than a quarter of the population of Malaysia in 2007 but accounted for two thirds of emigrants to Australia. Domestic bumiputera quotas and preferences in education institutions and specific sectors of the labour market in Malaysia are clearly an important factor in this selectivity.
3 This compares with proportions within Malaysia of 22.9 per cent ethnic Chinese and 6.9 per cent
Indian.
Table 6. Ancestry, Malaysia-born persons resident in 1986 and 2006
Ancestry Response 1986 2006
Number Percent Number1 Percent
Chinese 29,816 62.4 64,855 63.0
Malay 4,857 10.2 12,057 11.7
English 4,404 9.2 4,816 4.7
Indian 2,877 6.0 5,848 5.7
Australian 2,569 5.4 4,126 4.0
Other and not stated 3,282 9.2 11,186 10.9
Total 47,805 102.4 102,888 100.0
Source: ABS 1986 and 2006 Censuses
1 Note that numbers in this table refer to responses and not persons. Up to 2 responses per person
are permitted in answering the ancestry question at the Census.
relevance given the skilled labour shortages that Malaysia is experiencing. This educational selectivity appears to be higher in migration of Malaysians to Australia than the average for OECD countries. The OECD database on the educational level of Malaysia-born in OECD countries shows that the proportion of Malaysians with high levels of education in Australia (57.7 per cent) is higher than the OECD average (52.9 per cent) and higher than in any country other than South Korea.
Figure 5: Australia: Level of qualification of total Australia- and Malaysia-born population, 2006 Source: ABS 2006 Census
The educational selectivity of the emigration to Australia is even more evident when the characteristics of the Malaysia-born with Chinese and Indian ancestry are considered. Table 7 shows 49.9 per cent of adult Chinese and 49.7 per cent of Indians had university level educational qualifications.
Table 7. Australia: Malaysia-born with Chinese and Indian ancestry by post-school education (aged
15+ years), 2006
Non school qualification: Chinese ancestry Indian ancestry
level of education
Number Per cent Number Per cent
Postgraduate Degree Level 4,860 8.4 507 12.0
Graduate Diploma and Graduate Certificate Level 1,340 2.3 111 2.6
Bachelor Degree Level 22,684 39.2 1,481 35.1
Advanced Diploma and Diploma Level 6,570 11.4 575 13.6
Certificate Level 3,093 5.3 287 6.8
No Post School Education 19,312 33.4 1,260 29.9
Total 57,859 100.0 4,221 100.0
This selectivity of migration is also reflected in the occupations which Malaysian immigrants hold in Australia. The Malaysia-born have a higher level of labour force participation than the total Australian adult population (67.3 compared with 64.6 per cent). The unemployment rate (5.7 per cent) was slightly higher than that of the total Australian adult population (5.2 per cent). It is apparent that the Malaysia-born are concentrated in more skilled occupational categories. In fact, 49.5 per cent of the Malaysia-born who were employed worked in a Skill Level 1 occupation, compared with only 28.7 per cent of the total Australian workforce. There is a strong concentration in professional occupations which employ 4 out of every 10 Malaysia-born worker, compared with 2 out of 10 in the total workforce. Emigration of Malaysians to Australia clearly represents a significant loss of human capital to Malaysia. Table 8 below shows the occupations of Malaysia-born who are of Chinese and Indian ancestry. Managers and professionals make up 56.8 per cent of the Chinese and 57.5 per cent of Indian Malaysia-born workers. This compares with only 33.7 per cent in the total Australian workforce.
Table 8. Australia: Malaysia-born with Chinese and Indian ancestry by occupation, 2006
Occupation 06 (ANZSCO) Chinese ancestry Indian ancestry
Number Per cent Number Per cent
Managers 4,270 11.2 372 12.2
Professionals 17,342 45.3 1,381 45.3
Technicians and Trades Workers 3,003 7.8 151 5.0
Community and Personal Service Workers 2,290 6.0 278 9.1 Clerical and Administrative Workers 5,825 15.2 464 15.2
Sales Workers 2,462 6.4 172 5.6
Machinery Operators And Drivers 894 2.3 71 2.3
Labourers 2,188 5.7 157 5.2
Total 38,274 100.0 3,046 100.0
Source: ABS 2006 Census
The very high skill level of Malaysian migration to Australia is evident in the immigration flow data as well as census stock information. Table 9 shows the occupational distribution of not only settler arrivals but also those coming to Australia on a long term or short term basis. There is a startling concentration in the professional categories among both permanent and long term arrivals. To some extent this reflects the increasing focus on skill in the Australian immigration programme, which saw the proportion of the immigration intake made up of economic migrants increasing from 11 per cent in 1984-1985 to 52 per cent in 2008-2009. Moreover, the student and category 457 temporary migration programmes are restricted to highly skilled groups.
The high skill level of the Malaysian diaspora in Australia is part of the development of a ‘multicultural middle class’ which has resulted from the strong skill focus of the immigration programme (Colic-Peisker 2011). One way of demonstrating this is to analyse the geographic concentrations of Malaysians (the areas where Malaysians live). In 2006, 91.9 per cent of the Malaysia-born lived in major cities (those with more than 100,000 inhabitants) compared with 25.1 per cent of the Australia-born. However, it is the concentration of Malaysians within subareas of large Australian cities that is more indicative of their socio-economic positions. Table 10 shows the correlation between the percentage of the Malaysian population living in individual statistical local areas in 2006 and the socio-economic status of those areas in the three Australian cities with the largest Malaysia-born population. It is apparent that there is a strong correlation between the percentage of a city’s Malaysia-born population and its socio-economic status.4
Table 9. Australia: Malaysia-born arrivals by occupation, 1997-98 to 2008-09 Source: DIAC, unpublished data
Occupation Settler arrivals Long term Short term
visitor visitor
Managers and Administrators 2,808 3,212 8,575
Professionals 10,370 10,389 19,136
Assoc Professionals 1,583 1,932 5,963
Tradespersons 352 751 1,641
Advanced Clerical and Service 352 253 857 Intermediate Clerical Sales Service 795 902 2,021 Intermediate Production and Transport Workers 50 61 610 Elementary Clerical Sales Service 132 172 479
Labourers 46 51 103
Total 16,488 17,723 39,385
Per cent
Managers and Administrators 17.0 18.1 21.8
Professionals 62.9 58.6 48.6
Assoc Professionals 9.6 10.9 15.1
Tradespersons 2.1 4.2 4.2
Advanced Clerical and Service 2.1 1.4 2.2 Intermediate Clerical Sales Service 4.8 5.1 5.1 Intermediate Production and Transport Workers 0.3 0.3 1.5 Elementary Clerical Sales Service 0.8 1.0 1.2
Labourers 0.3 0.3 0.3
Total 100.0 100.0 100.0
Source: ABS 2006 Census
Note: Short term not available in 2001-02
4 This is measured by Socio-Economic Indexes for Areas (SEIFA), a suite of four summary measures that
The Malaysia-born population in Australia is strongly concentrated in the economically active age groups. This is evident in Figure 6, which shows the age-sex composition of the Malaysia-born in Australia at the 2006 population census. It shows very small numbers in the dependent older and younger age groups. The importance of students in the population is evident in the large numbers in the teenage and twenties years.
Table 10. Australian capital cities: Pearson correlation coefficient between percent of Malaysian
population and SEIFA Index in Statistical Local Areas, 2006
City Pearson correlation coefficient Number of SLAs
Sydney 0.319** 64 Melbourne 0.243* 79 Brisbane 0.256* 215
Source: Calculated from ABS data * Significant at 0.05 level ** Significant at 0.10 level
In sum, this section has demonstrated that the Malaysian diaspora in Australia has a distinctive composition. It is dominated by non-bumiputera groups, especially ethnic Chinese Malaysians of working age, who are highly educated, highly skilled and located within higher income groups. They clearly represent a group that has the potential to meet the shortage of highly skilled workers in Malaysia. This paper will now proceed to consider the extent to which they are currently interacting with their homeland to explore their potential contribution to development in Malaysia.
5. Return and Reciprocal Migration
One of the planks of the argument that emigration can deliver positive impacts in origin areas is that associated with emigrants returning to their homeland. Their development contribution accrues not just from the human capital which they emigrated with but the enhanced skills, experience and contacts that they accumulated while abroad. The extent to which return migration occurs, however, remains largely unknown. Very few countries collect data on emigration, while immigration data systems rarely are able to identify return migrants as a separate category. Australia is one of the few countries where the international migration flow data collection system enables return migration to be measured (Hugo 1994; Hugo et al. 2001).
Thus far, this paper has focused on the flows of Malaysians moving to Australia, but it is important to appreciate that there are also significant reciprocal and circular flows between Australia and Malaysia. Indeed, it has been argued that it is more appropriate to view Asian-Australian migration as a complex interactive system rather than a unidirectional permanent relocation of population and this certainly applies to the migration relationship with Malaysia (Hugo 2008a; 2008b). It is important to establish the extent and nature of these reciprocal moves since they potentially can influence development in Malaysia. Because Australia collects detailed information on all persons moving into and out of the country, it is possible to examine the full pattern of movement from Malaysia to Australia and vice versa.
Focusing first on permanent movements, Australia is one of the few countries to collect information on residents leaving permanently. Between 1991 and 2006, there were 7,377 Australian residents who left Australia to live permanently in Malaysia, compared with 35,715 persons who moved permanently from Malaysia to Australia over the same period. There has been one permanent migration from Australia to Malaysia for every five moves in the opposite direction. Moreover, as Figure 7 shows, there is a clear pattern of permanent
Figure 7: Australia: Departures to Malaysia, former settlers, 1962-63 to 1986-87 and total
departures to Malaysia by birthplace, 1987-88 to 2008-09
relocation from Australia to Malaysia increasing substantially in recent years. Figure 7 differentiates between Australian residents leaving for Malaysia who are Australia-born and those who are overseas-born, and it is apparent that the outflow is split more or less equally between the two groups. The striking feature of the diagram, however, is the upsurge in return migration in recent years.
Table 11 compares permanent departures from Australia to Malaysia between 1991 and 2009 with the numbers of permanent arrivals. It also provides some information on the persons leaving Australia to move to Malaysia and it is noticeable that the Malaysia-born are a minority, accounting for 10,184 persons (or 25.2 per cent of all departures between1991 and 2009). It should be noted, however, that a significant proportion of the Australia-born part of the flow are the children born to Malaysian returnees while they were in Australia. Nevertheless, it is apparent that there is significant permanent migration to Malaysia from Australia which is not return migration. This partly reflects the significant flow of Australian ‘expatriates’ to work as skilled migrants in Malaysia.
An important feature of Table 11 is that over a quarter of those leaving Australia permanently to go to Malaysia were born in a third country. This points to an increasingly significant factor in global migration whereby selected groups move away from their birthplace to another country, but then subsequently move to one or more other countries. The largest numbers of those ‘third country’ migrants moving between Australia and
Table 11. Australia: Permanent arrivals and departures from/to Malaysia by birthplace, 1991-92
to 2008-09
Year Settler Permanent departures
Arrivals
Total Australia-born Malaysia-born Other-born
1991-92 3,158 381 149 158 74
1992-93 1,798 415 174 173 68
1993-94 1,545 309 124 103 82
1994-95 1,401 262 135 88 39
1995-96 1,299 320 157 89 74
1996-97 1,167 348 186 93 69
1997-98 802 367 206 77 84
1998-99 1,548 413 228 102 83
1999-2000 2,006 483 272 106 105
2000-01 2,155 542 282 145 115
2001-02 2,357 534 284 136 114
2002-03 3,044 587 310 136 141
2003-04 3,822 792 348 215 229
2004-05 3,448 825 399 212 214
2005-06 6,165 799 380 178 241
2006-07 na 766 384 162 220
2007-08 na 934 462 171 301
2008-09 na 1,107 545 227 335
Malaysia were born in United Kingdom (21.3 per cent), New Zealand (8.8 per cent), China (8.0 per cent), Vietnam (6.0 per cent) and Singapore (3.4 per cent).
This increasingly complex pattern of moving permanently to several countries is also evident in the fact that there has been a significant permanent migration of the Malaysia-born in Australia to third countries. In fact, of the 6,858 Malaysia-Malaysia-born Australian residents who moved permanently out of Australia between 1993-1994 and 2008-2009, only one third (32.7 per cent) moved back to Malaysia. The main third country destinations of Malaysians relocating from Australia were Singapore, which accounted for 1,301(or 19 per cent), and Hong Kong, which accounted for 701 persons (or 10.4 per cent). Other important Asian destinations were China (208), Japan (87), Brunei (75), Thailand (64), Indonesia (59) and Taiwan (47). Hence much of the third country migration was ‘back to’ Asia, although not to Malaysia. Another component of the movement was toward other OECD nations, among which the most important were UK-Ireland (573 persons), New Zealand (457), USA (330) and Canada (75). Thus the Malaysian diaspora in individual countries changes not only due to migration to and from Malaysia but also significant migration between different diaspora countries.
The flow from Australia to Malaysia, like the permanent flow in the other direction, is highly skilled. It is interesting to note in Table 12, however, that while professionals are the dominant skilled group in the inflow to Australia, it is managers who are largest in the outflow. The age structure of the outflow shown in Figure 8 indicates that established families of adults with dependent children are an important component in the backflow from Australia to Malaysia. There are also significant numbers in the younger and middle workforce ages. Conway and Potter (2009: 1) have shown that‘scholarship on international return migration has commonly focused on elderly, first generation retirees’ who return to their homeland after spending their working lives at their destination. The impact of such ‘retiree returnees’ is hence limited. However, it is clear that in the Australia to Malaysia flow the dominant groups are those in the economically active age groups and their children. Hence their potential for having a positive impact on development in Malaysia is considerable. This is especially important given the shortage of skill which is seen to be constraining development in Malaysia (Malaysiakini 2010).
Table 12. Australia: Permanent movement to and from Malaysia by occupation, 2002-03 to
2006-07
Occupation – Major Group Number Percent
Settler Permanent Settler Permanent arrivals departures arrivals departures
Managers/Admin 1024 613 14.2 27.7
Professionals 4399 930 61.1 42.0
Associate Professionals 747 280 10.4 12.6
Tradespersons and Related Workers 344 92 4.8 4.2 Advanced Clerical and Service Workers 126 24 1.7 1.1 Intermediate Clerical, Sales and Service Workers 318 183 4.4 8.3 Intermediate Production and Transport Workers 21 19 0.3 0.9 Elementary Clerical, Sales and Service Workers 56 46 0.8 2.1 Labourers and Related Workers 167 28 2.3 1.3
Total 7202 2215 100.0 100.0
Source: DIAC, unpublished data
Figure 8: Australia: Age-sex composition of permanent departures to Malaysia, 1993-94 to
2008-09
Source: DIAC, unpublished data
Table 13. Australia: Number of Malaysia-born individual persons travelling into and out of Australia
temporarily according to their resident status, 1998-2006
Malaysia-born persons’ resident status Number travelling
Into Australia Out of Australia
New Settlers 1998-2006 18,116 1,322
Visitors 1998-2006 162,184 146,187
Australian Residents Who Settled Prior to 1998 83,136 83,946
The first type is settlers arriving between 1998 and 2006. These are people who arrived in Australia as settler arrivals during the survey period, 1998-2006. The data indicates that virtually all of them have made at least one temporary move out of Australia since moving. The second type is visitors from Malaysia. These are Malaysia-born people who are not residents of Australia and are entering the country under a Visitor visa. The numbers are substantial, with 162,184 separate Malaysia-born individual non-residents making at least one visit to Australia between 1998 and 2006. It is interesting, however, to observe that only 146,187 individual Malaysia-born visitors left Australia. Clearly there is a strong pattern of Malaysia-born visitors changing their status from visitor to resident while being in Australia, as well as some visitors having extended stays in Australia.The third category is particularly interesting. This represents the temporary movement of Malaysia-born people who arrived in Australia before 1998 and are permanent Australian residents. Over the 1998-2006 period there were 83,946 separate individual Malaysia-born Australian residents who made a temporary move out of Australia. To put this in perspective, this is actually more than the 76,255 Malaysia-born people counted in the 1996 census. It is clear then that there are many Malaysia-born people with Australian residence status who are actually domiciled in Malaysia but return to Australia to visit. It is interesting that there are less Malaysia-born Australian residents who returned to Australia after a ‘temporary visit’ between 1998 and 2006 than actually left Australia. This would suggest that there have been a number of Malaysia-born Australian residents who left Australia, indicating they were leaving temporarily but have remained out of Australia, many in Malaysia.
What is apparent, then, is that most Malaysia-born people settling in Australia have made several temporary moves out of Australia since arriving. It is useful to examine the number of moves made by individual Malaysia-born people to and from Australia. Indeed, Table 14 shows a high level of ‘comings and goings’ among the Malaysia-born in Australia. Among those settling permanently in Australia between 1998 and 2006, over a quarter have made 10 or more temporary trips out of Australia (27 per cent), and over half have made five or more trips out of Australia. For the 162,184 Malaysia-born people who are not Australian residents but had visited Australia during the survey period, 48 per cent had visited Australia 10 times or more in that period. Clearly there is a great deal of circularity with a significant number of Malaysia people regularly moving between Malaysia and Australia.
Resident Status Percent of Individuals Total
1-4 moves 5-9 moves 10+ moves Total
New settlers 1998-2006 44 29 27 100 18,116
Visitors 1998-2006 20 32 48 100 162,184
Australian residents who 8 25 66 100 83,136 settled before 1998
Australian residents settling 18 32 50 100 1,322 before 1998 and who have
permanently left Australia between 1998-2006
Table 14. Australia: Number of temporary moves into and out of Australia made by Malaysia-born
persons according to their resident status, 1998-2006
The final two categories in Table 14 are especially interesting since they shed some light on the mobility of Malaysia-born persons who had settled in Australia prior to 1998. The largest group are the 83,136 Malaysia-born residents of Australia that made trips out of Australia between 1998 and 2006. Of these, two thirds made 10 or more temporary visits, reflecting a high degree of mobility. The other group of 1,322 Malaysia-born were former residents of Australia but had moved permanently out of the country during the reference period. The fact that they maintained strong connections with Australia is reflected in the fact that half of them entered Australia temporarily on 10 or more occasions during the survey period.
The pattern of short term permanent movement (moves involving an absence of less than one year away from home) between Australia and Malaysia also has implications for development in Malaysia. Figure 9 shows that there has been a strong increase both in Malaysians visiting Australia and in Australians visiting Malaysia. It also shows that, whereas prior to 2005-2006, the number of Malaysians visiting Australia was larger than the number of Australians visiting Malaysia, this pattern has been reversed in recent years. This is of interest not only from the perspective of the Malaysian tourist industry. This short term visiting also has a potential developmental impact. In the period since 2005-2006 some 15,602 short term visits of Australian residents to Malaysia (2.2 per cent) were for employment and 109,134 (15.5 per cent) were for business. The previous section has shown that the Malaysian diaspora are an important element in this flow.
In 2008-2009 there were 208,031 short term visits from Malaysia to Australia. Holidays and visiting family and friends accounted for three quarters of movement, but 7.3 per cent of the visits were associated with business and 8.9 per cent for education. If we turn to the 205,190 short term departures of Australian residents to Malaysia, again three quarters were associated with holidays and visiting family. However, a full 15.5 per cent were associated with business, indicating that the Malaysian community in Australia is active in business
activities in their homeland. It would appear that there is potential to build upon these strong business related interactions. In sum, there is a pattern among the Malaysia-born in Australia of hyper-mobility, much of it involving movements between Malaysia and Australia. This provides considerable potential for fostering knowledge transfer between the two countries as well as fostering economic linkages.
5.1 Remittances
One of the main arguments in the case for emigration having positive impacts on origin communities relates to the money sent and brought back from expatriates to their homeland (World Bank 2006). One of the criticisms of Malaysia’s reliance on foreign workers is the outflow of remittances. It is apparent too that the outflow of students to study in OECD countries like Australia is associated with a significant outflow of funding for their fees and living costs. It is interesting, therefore, to examine the flows of remittances between Malaysia and Australia. The World Bank (2010) dataset estimates that the annual flow of remittances from Malaysia to Australia is USD67 million, and undoubtedly a large part of this is to support students. However, the figures of the Australia to Malaysia flow are more than twice as large, at USD133 million. While we have no knowledge of how the remittances are used in Malaysia, it remains a significant amount.
6. Conclusion: Policy Debates
International migration has played an important role in Malaysia’s rapid economic and social development over the last two decades and there is little indication that its role will diminish in the future. Malaysia, unlike the other major net immigration countries in ASEAN (Thailand and Singapore), has above replacement level fertility and there will continue to be larger numbers of young Malaysians entering the workforce ages than older Malaysians retiring from the workforce for the next two decades. While Malaysia will not be totally reliant upon migration to maintain the size of its workforce or increase it as is the case in Singapore and Thailand, migration will continue to play a major role in filling labour and skill shortages. However, there is evidence that a shortage of high productivity, high skilled workers is a barrier to Malaysia’s further development and that this is not being fully satisfied by internal training or migration initiatives which are predominantly of low skilled workers. In this context the substantial outflow of highly skilled, productive native Malaysians must be an issue of concern. Key questions arise as to how such an outflow can be stemmed in the first place, but also as to whether and how the diaspora can be engaged to make up these skill deficits and contribute to development in other ways.
has made some efforts to encourage return migration of its skilled expatriates in foreign countries (Kanapathy 2003: 3, 2004: 9). Specific incentives include (i) promises that two cars and all personal effects brought into Malaysia are exempted from tax, (ii) spouse and children are eligible for permanent residential status, (iii) returnees are allowed to bring in cars from a third country if currently in a country using left-hand drive, (iv) children are given leniency to attend international schools, and (v) foreign spouses can apply for an employment pass (Lucas 2008: 10). Only Malaysian citizens working overseas in specific occupations are eligible, although the list of occupations is detailed and extensive.
It has been demonstrated in the Australian case that in fact there is a small but significant backflow of Malaysians to their home country. However, a permanent return migration strategy is unlikely to attract a large number of non-bumiputera expatriates while they and their children are denied equal access to job and educational opportunities. In the absence of such a major change in Malaysia’s political economy, it may be more productive to concentrate on diaspora strategies other than return migration. Indeed, the Australian data presented here would give some optimism for the success of such a strategy.
It may be useful for the Malaysian government to consider a diaspora policy which seeks to engage Malaysian expatriates living in foreign countries without necessarily bringing them permanently back to Malaysia. In recent years the development of electronic forms of communication and reduction of the time and costs of travel have meant that it is possible for the diaspora to be more closely involved in the affairs of their home country than ever before. China has become very active in using its skilled diaspora as a source of expertise to assist in its development efforts and in effect encouraging not only temporary but also ‘virtual return migration’ among its diaspora (Wescott 2005; Biao 2006). In the 1980s and 1990s, China’s main policy direction toward its skilled expatriates who had remained overseas after graduation was ‘huiguofuwu’ or exhorting them to return and serve the motherland (Zweig 2006). This is the concept encapsulated in the commonly used analogy of ‘turtles eventually returning to their birthplace’. At the turn of the century, however, there was an important change in policy direction, which is articulated in the term ‘weiguofuwu’ which encourages ‘flexible mobility’ rather than permanent return (Wescott 2005: 272; Biao 2006: 3). Chinese government and other agencies now do not necessarily advocate that skilled Chinese return home but that they maintain and develop a range of affiliations, linkages and relationships with counterparts and relevant institutions in China from their base in a foreign country. Moreover, it involves regular moving back and forth between China and the destination country in a pattern of flexible mobility. There is a double benefit for China in that its expatriates maintain their affiliations in the destination and hence are at the forefront of innovation and change and they also immediately transmit that into practice in China.
policies because of the substantial size of the diaspora, its highly skilled nature, and the shortage of skills in Malaysia.
Return migration is only one of the ways in which diaspora can be engaged in development, and Malaysia could consider other potential initiatives such as following the Chinese and Indian models of encouraging the diaspora to invest in development related activities in Malaysia, either as individuals or in the roles they have in foreign based companies. A range of incentives can be used. Moreover, concerned government officials and managers from Talent Corporation, for instance, can consider the development of ‘knowledge networks’ with Malaysians in business, and support research positions in foreign nations to encourage knowledge transfer and regular interaction with counterparts living in Malaysia. It may be worth encouraging key skilled Malaysians overseas to hold joint positions in Malaysia which involve frequent visits and working with counterparts in Malaysia. This would involve the introduction of dual citizenship. Finally, it is suggested here that concerned parties use Malaysian connections overseas as bridgeheads for Malaysian expatriates and enhanced trade.
References
Abella, M.I. 2005. Global competition for skilled workers and their consequences. Paper presented at the Conference on Competing for Global Talent, Singapore Management University, Singapore, 13–14 January 2005.
Adams, W. 1968. The Brain Drain. New York: Macmillan.
Arbee, A. R. 2010. Malaysian Emigration – The Malays are leaving too. Berita Harian, 8 March 2010.
Australian Bureau of Statistics (ABS). 1986. Raw Census Tables. Canberra: ABS, unpublished. Australian Bureau of Statistics (ABS). 2006. Raw Census Tables. Canberra: ABS, unpublished. Australian Bureau of Statistics (ABS). 2011. Migration Australia 2009-10. Catalogue No. 3412.0,
Canberra: ABS.
Biao, X. 2006. Towards sustainable ‘brain circulation’: what India and China can learn from each other. Paper presented at the International Conference on Population and Development in Asia: Critical Issues for a Sustainable Future, Phuket, Thailand, 20–22 March 2006.
Carrington, W.J. and E. Detragiache. 1998. How Big Is the Brain Drain? IMF Working Paper WP/98/ 102, Washington, DC: International Monetary Fund.
Colic-Peisker, V. 2011. A new era in Australian multiculturalism? From working-class ‘ethnics’ to a ‘multicultural middle-class’. International Migration Review 45(3): 562–587.
Conway, D. and R.B. Potter. (eds). 2009. Return Migration of the Next Generations: 21st Century Transnational Mobility. Farnham: Ashgate.
Department of Education, Science and Training (DEST). (n.d.) Overseas Student Statistics, various issues, Canberra: Australian Government Publishing Service.
Department of Immigration and Citizenship (DIAC). (n.d.) Immigration Update, various issues, Canberra: Australian Government Publishing Service.
Department of Immigration and Citizenship (DIAC). 2011a. Population Flows: Immigration Aspects 2009-2010 Edition. Canberra: Department of Immigration and Citizenship.
Department of Immigration and Citizenship (DIAC). 2011b. Subclass 457 Current Trends Report: 2011-12 to 31 August 2011. Canberra: Department of Immigration and Citizenship. Department of Immigration and Multicultural and Indigenous Affairs (DIMIA). (n.d.) Australian
Dumont, J.-C. and G. Lemaitre. 2005. Counting immigrants and expatriates in OECD countries: a new perspective. Conference on Competing for Global Talent, Singapore Management University, Singapore, 13–14 January 2005.
Global Migrant Origin Database. 2007. Available at: http://www.migrationdrc.org/research/ typesofmigration/global_migrant_origin_database.html
Head, K. and J. Reis. 1998. Immigration and trade creation: econometric evidence from Canada. Canadian Journal of Economics 31(1): 47–62.
House of Commons. 2004. Migration and Development: How to Make Migration Work for Poverty Reduction. London: The Stationery Office.
Hugo, G. J. 1994.The Economic Implications of Emigration from Australia. Canberra: Australian Government Publishing Service.
Hugo, G. J. 1999. A new paradigm of international migration in Australia. New Zealand Population Review 25(1-2): 1–39.
Hugo, G.J. 2008a. In and out of Australia: rethinking Indian and Chinese skilled migration to Australia. Asian Population Studies 3(4):267–291.
Hugo, G. J. 2008b. Quantifying transnationalism: Asian migration to Australia. In Migration, Development and Environment: Migration Processes from the Perspective of Environmental Change and Development Approach at the Beginning of the 21st Century, ed. R. Stojanov and J.
Novosak, pp. 172–208. Newcastle: Cambridge Scholars Publishing.
Hugo, G. J. 2009. International Migration and Malaysia’s Development. Draft Chapter for Malaysian Population Strategic Plan Study, LPPKN.
Hugo, G. J. 2011. Migration and development in Malaysia: an emigration perspective. Asian Population
Studies 7(3): 219–241.
Hugo, G. J., D. Rudd and K. Harris. 2001. Emigration from Australia: Economic Implications. Second Report on an ARC SPIRT Grant, CEDA Information Paper No. 77.
International Labour Organization (ILO). 2008. Labour and Social Trends in ASEAN 2008 – Driving Competitiveness and Prosperity with Decent Work. Bangkok: International Labour Organization. Johnson, B. and S. Sedaca. 2004. Diasporas, Emigrés and Development: Economic Linkages and
Programmatic Responses. Washington, DC: USAID.
Kanapathy, V . 2003. Recent trends in migration movement and policies in Malaysia. Paper presented at the Japan Institute of Labour Workshop on International Migration and Labour Markets in Asia, Tokyo, Japan, 6–7 February 2003.
Kanapathy, V. 2004. International migration and labour market developments in Asia: economic recovery, the labour market and migrant workers in Malaysia. Paper prepared for the 2004 Workshop on International Migration and Labour Markets in Asia organized by the Japan Institute of Labour (JIL) supported by the Government of Japan, Organisation for Economic Cooperation and Development (OECD) and the International Labour Office (ILO), held at the Japan Institute of Labour, Tokyo, Japan, 5–6 February 2004.
Khoo, S-E., G.J. Hugo and P. McDonald 2009. Skilled temporary migration from Asia-Pacific countries to Australia. Asian and Pacific Migration Journal 18(2): 255–281.
Lucas, R.E.B. 2001. Diaspora and Development: Highly Skilled Migrants from East Asia. Report prepared for the World Bank, Boston University, November 2001.
Lucas, R.E.B. 2003. The economic well-being of movers and stayers: assimilation, impacts, links and proximity. Paper prepared for the Conference on African Migration in Comparative Perspective, Johannesburg, South Africa, 4–7 June 2003.
Lucas, R.E.B. 2008. The Malaysian Diaspora. Mimeo. Massachusetts: Boston University. Malaysiakini. 2010. Exodus of M’sians: 350,000 work overseas, Malaysiakini 30 March 2010. Martin, P. L. 2004. Migration and Development: Toward Sustainable Solutions. Geneva: International
Mohapatra, S., D. Ratha and A. Silwal. 2011. Outlook for Remittance Flows, 2011-13, Migration and Development Brief 16.Washington, DC: World Bank Migration and Remittances Unit. Price, C. A. 1974. The Great White Walls Are Built. Canberra: Australian National University Press. Price, C. A. 1984. Birthplaces of the Australian Population 1861-1981. Working Papers in Demography, Vol. 13. Canberra: Department of Demography, Research School of Social Sciences, Australian National University.
Rauch, J. E. and V. Trindade. 2002. Ethnic Chinese networks in international trade. The Review of Economics and Statistics 84(1): 116–130.
Schuman, M. 2010. To modernize, can Malaysia move beyond race? Time Magazine 5 September 2010.
Tomas, P. A.S. and L.H. Summers. 2009. Migrants Count: Five Steps Toward Better Migration Data. Washington, DC: Centre for Global Development.
United Nations Development Programme (UNDP). 2009. Human Development Report 2009. New York: UNDP.
Wescott, C. 2005. Promoting Exchanges Through Diaspora. G-20 Workshop on Demographic
Challenges and Migration, Sydney, 27–28 August 2005.
World Bank. 2006. Global Economic Prospects 2006: Economic Implications of Remittances and Migration. Washington, DC: World Bank.
World Bank. 2010. Remittances Dataset. Washington, DC: World Bank.
World Bank. 2011. Migration and Remittances Factbook 2011,2nd ed.Washington, DC: World Bank. Zweig, D. 2006. Learning to compete: China’s efforts to encourage a reverse brain drain. International