Development and evaluation of sustained release tablet containing antidiabetic agent
14
0
0
Full text
(2) 134. Rajat S Kharche et al., Int. Journal of Pharmacy & Industrial Research Vol – 02 Issue – 02 Apr – Jun 2012. Metformin is short i.e. 2-6 hours.2 So due to. absorbance. For the drug sample preparation,. frequent administration of Metformin, there. Metformin. are number of side effect due to fluctuation in. accurately weighed and dissolved in 100ml of. drug. patient. distilled water taken in a volumetric flask.. compliance. Sustain release dosage form. Then, 1ml of sample solution was withdrawn. release drug for extended period so the drug in. and dissolved in distilled water (10ml). The. plasma for longer duration result in reduce in. resultant solution was then scanned by using. frequency of administration of doses. It leads. double beam ultra-violet spectrophotometer.. plasma. level. and. poor. hydrochloride. (10. mg). was. to increase the time interval required between doses. Side effects were abolished due to. Preparation of Calibration curve for. reduce in drug plasma level.. Metformin Hydrochloride3 100 mg of Metfomin Hydrochloride was. In this study, development and evaluation of. weighed. sustained release tablet Containing Metformin. volumetric flask. Add 100 ml diluent into it. hydrochloride was done. Main objective of this. and sonicate for 5 minutes. Pipette out 2 ml. present study is to increase the time interval. from the above solution and transferred into. required between doses of Metformin. This. the empty 100 ml volumetric flask, dilute it. provides a reduction in the total number of. upto the mark with the diluent and again. doses. in. sonicate for 5 minutes. From the above stock. fluctuation of drug blood levels about the. solution, standard solutions were prepared in. Metformin.. the range of 50 mcg/ml, 75 mcg/ml, 100. required. per. day.. Reduction. and. transferred. into. 100. ml. mcg/ml, 125 mcg/ml and 150 mcg/ml. The. Materials and Methods. absorbance of each standard solution was. Materials. determined spectrophotometrically at 232 nm.. Metformin HCl was obtained as a gift sample. The plot of absorbance vs. concentration was. from Twilight Litaka Pharma Ltd., Vadgaon. plotted. Data in this range was further. Maval,. subjected to linear regression analysis.. Pune.. Microcrystalline. Cellulose. (MCC Ph 101), HPMC K100M, Xanthan gum, Magnesium stearate, Colloidal silicon dioxide. Drug Interaction Studies (Compatibility study). (Aerosil) was obtained as gift sample from. The compatibility study or interaction study. Twilight Litaka Pharma Ltd., Pune. All other. was done using Fourier transformed infrared. chemicals used were of analytical grade.. spectroscopy. IR spectra of pure Metformin hydrochloride and polymers viz. hypromellose. Methods. K100M, xanthum gum were taken separately.. Identification by Ultraviolet absorption. Then to know if there is any interaction. spectroscopy. between drug and polymer, IR spectra of. A. solution. containing. of. 10µg/ml. Metformin. concentration. hydrochloride. was. metformin hydrochloride and other polymers were taken in combination.. prepared in distilled water and was scanned between 400 to 200nm for getting the. www.ijpir.com.
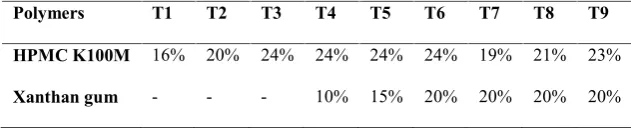
(3) Rajat S Kharche et al., Int. Journal of Pharmacy & Industrial Research Vol – 02 Issue – 02 Apr – Jun 2012. 135. Formulation of Matrix Tablet The release retarding agents play a central role. xanthan. gum. was. used. in. different. in the formulation of sustained release matrix. concentrations. The cut weight of the tablet, in. tablet. The objective of present study was to. all the 9 trials was kept same i.e. 945 mg. The. develop matrix sustained-release tablets of. concentration of polymer among the 9 trials,. Metformin hydrochloride using xanthan gum. who will give the results as per the USP 32 for. and hydroxypropylmethyl cellulose K 100M. 10 hours dosing of Metformin hydrochloride,. (HPMC K100M) as release retarding agents.. will be selected and utilized for further studies.. Thus, in the present study, 9 different trial batches of tablets were prepared. In the first 3. The percentage composition of both the. trials, only HPMC K100M was used, then. polymers used in all the 9 trials were shown in. from trial 4 to trial 9, both HPMC K100M and. Table no.1. Table No. 1: Percentage Composition of Polymers used in 9 Trials Polymers. T1. T2. T3. T4. T5. T6. T7. T8. T9. HPMC K100M. 16%. 20%. 24%. 24%. 24%. 24%. 19%. 21%. 23%. Xanthan gum. -. -. -. 10%. 15%. 20%. 20%. 20%. 20%. Procedure for formulation of T1 to T3. Aerosil was sifted through 40# sieve and. a). mixed well to obtain the lubricated blend.. Microcrystalline cellulose pH 101 (MCC Ph 101) was sifted through 40 # sieve.. i). b) Metformin hydrochloride BP was sifted. x 8.5 mm capsule shaped punches plain on both sides.. through 30# sieve. c). Compressed the lubricated blend using 19. Step 2 and Step 3 was mixed in polybag for 10 minutes.. d) 10 ml purified water was added in. Procedure for formulation of T4 to T9 a). planetary mixer to obtain wet mass. e). sifted through 40# sieve.. Wet mass was passed through 8# sieve. Dry at 400 – 450C in tray dryer.. f). MCC Ph 101 and xanthan gum was. b) Metformin hydrochloride BP was sifted through 30# sieve.. LOD (loss on drying) was checked at 0. c). 105 C for 10 minutes. LOD must be in the range of 1%-2%.. Step 2 and step 3 was mixed in planetary mixer for 10 minutes.. d) Added 10 ml of purified water in. g) Sift dried granules through 16# sieve.. planetary mixer to obtain the wet. h) Lubrication step. mass.. HPMC K100M was sifted through 40#. e). sieve. Magnesium stearate was sifted through 60# sieve, then mixed along with the dried granules for 2 minutes.. Wet mass was passed through 8# sieve. Dry at 400 – 450C in tray dryer.. f). LOD was checked at 1050C for 10 minutes. LOD must be in the range of 1% - 2%.. www.ijpir.com.
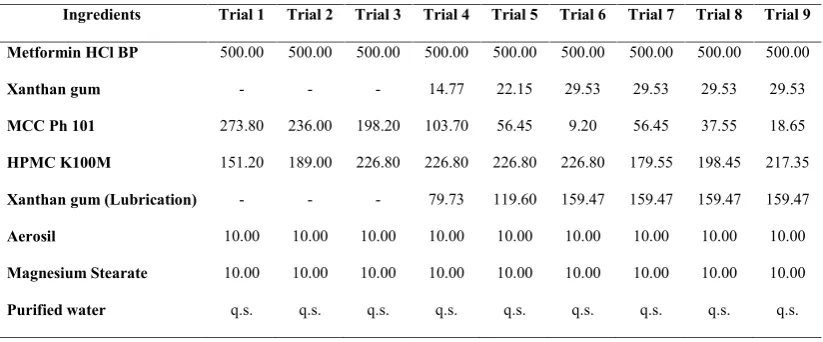
(4) 136. Rajat S Kharche et al., Int. Journal of Pharmacy & Industrial Research Vol – 02 Issue – 02 Apr – Jun 2012. g) Sifted dried granules through 16#. Magnesium. sieve.. stearate. was. sifted. through 60# sieve in the above mixture. Again it was mixed for 2. h) Lubrication HPMC K100M was sifted through. minutes.. 40# sieve. Xanthan gum was sifted. i). Aerosil was sifted through 40# sieve. through 10# sieve. Both were mixed. and then mixed properly to obtain the. along with the dried granules for 5. lubricated blend.. minutes in a polybag.. j). The lubricated blend was compressed by using 19 x 8.5 mm capsule shaped punches,. plain. on. both. sides.. Table No. 2: Formulation Chart of Trial 1 to 9 Ingredients. Trial 1. Trial 2. Trial 3. Trial 4. Trial 5. Trial 6. Trial 7. Trial 8. Trial 9. Metformin HCl BP. 500.00. 500.00. 500.00. 500.00. 500.00. 500.00. 500.00. 500.00. 500.00. Xanthan gum. -. -. -. 14.77. 22.15. 29.53. 29.53. 29.53. 29.53. MCC Ph 101. 273.80. 236.00. 198.20. 103.70. 56.45. 9.20. 56.45. 37.55. 18.65. HPMC K100M. 151.20. 189.00. 226.80. 226.80. 226.80. 226.80. 179.55. 198.45. 217.35. -. -. -. 79.73. 119.60. 159.47. 159.47. 159.47. 159.47. Aerosil. 10.00. 10.00. 10.00. 10.00. 10.00. 10.00. 10.00. 10.00. 10.00. Magnesium Stearate. 10.00. 10.00. 10.00. 10.00. 10.00. 10.00. 10.00. 10.00. 10.00. q.s.. q.s.. q.s.. q.s.. q.s.. q.s.. q.s.. q.s.. q.s.. Xanthan gum (Lubrication). Purified water. * Weight in mg Evaluation of Tablet Weight variation. Hardness 5. 4. Tablets require a certain amount strength or. The variation weight testing was carried out as. hardness. per. withstand mechanical shock of handling in. the. method. described. in. the. US. and. resistance packaging. to. friability to. Pharmacopoeia-32 NF27, 2009. Twenty tablets. manufacturing,. were randomly selected from each batch and. Hardness was measured using Monsanto. individually weighed. The average weight and. hardness tester. It is the pressure required to. standard deviation of 20 tablets was calculated.. fracture. The batch passes the test for weight variation. applying the force. Mean of three values with. test if not more than two of the individual. standard deviation for each formulation was. tablet weight deviates from the average weight. taken.. diametrically. and. placed. shipping.. tablets. by. by more than the percentage shown in officials and none deviate by more than twice the. Thickness Measurement 6. percentage shown. Then the resultants weights. Three samples were selected randomly from. were compared to the average dose USP. each batch and thickness was measured using. weight variation test.. www.ijpir.com.
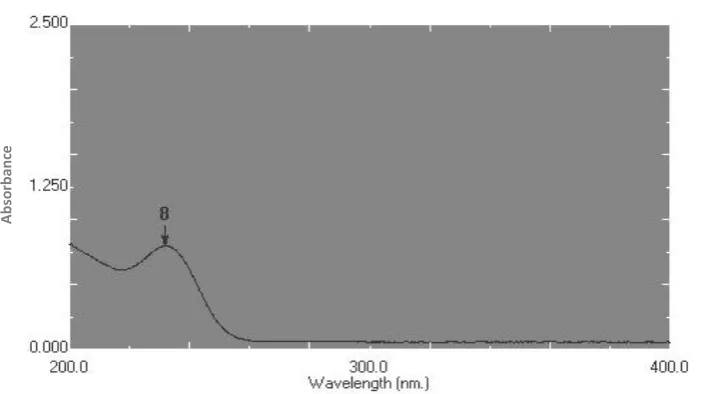
(5) Rajat S Kharche et al., Int. Journal of Pharmacy & Industrial Research Vol – 02 Issue – 02 Apr – Jun 2012. 137. Vernier caliper. The mean of three readings. bowl was withdrawn, filtered and dilute 2 ml. were taken.. of filtrate to 100 ml with the dissolution medium in the volumetric flask. Sink condition. Tablet Friability 7, 8. was maintained by adding 10 ml of fresh. For tablets with a unit weight of more than 650. dissolution medium in each of the six flask.. mg, take a sample of 10 whole tablets. The tablets should be carefully dedusted prior to. Procedure. testing. Accurately weigh the tablet sample,. Measure the absorbance of the standard and. and place the tablets in the drum. Rotate the. sample preparations in 1 cm cell at the. drum 100 times, and remove the tablets.. wavelength of maximum absorbance 232 nm. Remove any loose dust from the tablets as. with the suitable spectrophotometer using. before, and accurately weigh.. phosphate buffer 6.8 as a blank preparation.. The percentage friability was measured using. Calculate. the formula,. Metformin hydrochloride in the portion of. percentage. drug. release. of. tablet taken by the formula.. %F = {(W-Wo)/Wo} x 100 Where, % F is friability in percentage, Wo is initial weight of tablet and W is weight of. Where, Spl abs is sample absorbance, Std abs. tablet after test.. is standard absorbance, Std wt is standard In-vitro Release Profile Study of Formulated Tablets. 9, 10. weight and % P is percentage purity. According to USP 32, the drug release profile. Preparations. in 1 hr, 3 hr and 10 hr for 500 mg drug is. Standard Preparation:. shown in table below:-. 50.2 mg of Metformin Hydrochloride working standard. was. accurately. weighed. and. transferred in to 100 ml volumetric flask. About 50 ml dissolution medium was added. Table No. 3: Test 2 - Drug Release Acceptance Table [USP32 NF27 2009]10 Time (Hours). and sonicate for 5 minutes to dissolve. Dilute it up to the mark with the dissolution medium. 2 ml from the above solution was pipetted out. 500 mg tablet, amount dissolved. 1. Between 20% and 40%. 3. Between 45% and 65%. 10. not less than 85%. and diluted this to 100 ml with the dissolution. Result and Discussion. medium in the volumetric flask.. Identification by UV Spectroscopy Sample Preparation. Wavelength of maximum absorbance. One tablet was placed in each of the six. (max) in different solvents.. dissolution flask, from each trial, containing 1000 ml of dissolution medium previously maintained at 370C ± 0.50C. Operate the apparatus for 10 hours. After completion of each time point, 10 ml of aliquot from each. www.ijpir.com. Table No. 4: λmax of water and phosphate buffer 6.8 Solvent. max (nm). Water. 232.60. pH 6.8. 232.00. phosphate buffer.
(6) 138. Absorbance. Rajat S Kharche et al., Int. Journal of Pharmacy & Industrial Research Vol – 02 Issue – 02 Apr – Jun 2012. Fig No. 1: Chromatogram of maximum absorbance in distilled water. Preparation of linearity curve for Metformin hydrochloride Table No. 5: Linearity of Metformin Hydrochloride Concentration (µg/ml) 0 50 75 100 125 150. Absorbance 0 0.1957 0.2927 0.3944 0.4876 0.5867. Fig No. 2: Linearity curve of Metformin hydrochloride. Compatibility Study Table No. 6: FTIR peaks of various functional groups of Metformin Hydrochloride Functional groups. Wave number (cm-1) observed. Wave number (cm-1) Reported. C-N stretching. 1041. 1075. C=N bending. 1624. 1620. C-Hstretching. 3298. 3339. Fig. No. 3: FTIR Spectrum of mixture of Metformin hydrochloride and HPMC K100M www.ijpir.com.
(7) Rajat S Kharche et al., Int. Journal of Pharmacy & Industrial Research Vol – 02 Issue – 02 Apr – Jun 2012. Fig. No. 4: FTIR spectrum of Metformin Hydrochloride. Fig. No. 5: FTIR Spectrum of mixture of Metformin hydrochloride and xanthan gum. Fig. No. 6: FTIR Spectra of pure Metformin hydrochloride and mixtures of Metformin hydrochloride with HPMC K100M and with xanthan gum.. www.ijpir.com. 139.
(8) 140. Rajat S Kharche et al., Int. Journal of Pharmacy & Industrial Research Vol – 02 Issue – 02 Apr – Jun 2012. Study of physical interaction between drug. due. and polymer:. characteristics bands at 1626 and 1567 cm–1. FTIR. studies. revealed. N-H. secondary. stretching,. and. metformin. assigned to C=N stretching. No significant. hydrochloride showed two typical bands at. shifts of reduction in intensity of the FTIR. –1. 3369 and 3296 cm. that. to. due to N-H primary. stretching vibration and a band at 3170 cm. –1. bands. of. metformin. hydrochloride. were. observed.. In vitro dissolution study as per USP 32 NF27 2009 Table No. 7: Dissolution study of Trial batch 1 Time (hr). 1. 3. 10. Dissolution sample 1 2 3 4 5 6 1 2 3 4 5 6 1 2 3 4 5 6. % Drug Release 35.56 38.22 41.04 41.90 45.81 50.61 70.66 69.25 75.04 80.13 85.40 88.17 86.13 90.59 94.56 98.48 104.74 102.41. The results obtained from Trial batch 1, it is clear that there is initial burst release during 1. st. Average % Drug Release. 42.19. 78.11. 96.15. concentration. of. HPMC. K100. increased so as to reduce the burst release.. hour. Therefore, to overcome this problem,. Table No. 8: Dissolution study of Trial batch 2 Time (hr). 1. 3. 10. Dissolution sample 1 2 3 4 5 6 1 2 3 4 5 6 1 2 3 4 5 6. M. % Drug Release 32.20 34.54 38.24 43.23 45.49 36.51 60.27 66.21 78.52 72.40 84.19 90.45 83.15 87.11 91.04 95.22 103.14 99.46. www.ijpir.com. Average % Drug Release. 38.37. 75.34. 93.19. was.
(9) Rajat S Kharche et al., Int. Journal of Pharmacy & Industrial Research Vol – 02 Issue – 02 Apr – Jun 2012. 141. By taking the 20% HPMC, the burst release was sustained to some extent and further increased the concentration of polymer. Table No. 9: Dissolution study of Trial batch 3 Time (hr). 1. 3. 10. Dissolution sample 1 2 3 4 5 6 1 2 3 4 5 6 1 2 3 4 5 6. % Drug Release 32.19 35.22 20.25 24.03 28.25 16.17 58.33 62.15 70.25 66.31 73.94 79.33 84.26 88.09 91.76 95.93 100.18 80.22. Average % Drug Release. 26.02. 68.38. 90.07. In this trial batch 24% HPMC was used. The initial burst release was sustained during 1st hour and follows the parameter mentioned in Table No. 09 but fails during 3rd hour. Table No. 10: Dissolution study of Trial batch 4 Time (hr). 1. 3. 10. Dissolution sample 1 2 3 4 5 6 1 2 3 4 5 6 1 2 3 4 5 6. % Drug Release 18.14 22.18 20.23 24.00 25.97 16.15 59.95 62.09 70.17 66.24 64.30 68.08 83.30 87.23 91.04 93.38 89.33 85.52. Average % Drug Release. 21.11. 65.14. 88.30. From Trial 4, Xanthan gum was used, as. The results found that the drug release was. release retarding agent, alongwith HPMC. sustained to some greater extent. The value of. K100 M. 10% Xanthan gum was used in this. % drug release was out of acceptance criteria,. trial keeping the concentration of HPMC same. mentioned in the Table No. 10.. as that of the trial 3.. www.ijpir.com.
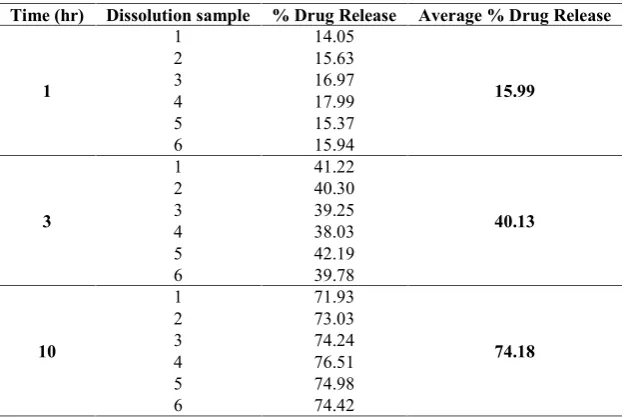
(10) 142. Rajat S Kharche et al., Int. Journal of Pharmacy & Industrial Research Vol – 02 Issue – 02 Apr – Jun 2012. Table No. 11: Dissolution study of Trial batch 5 Time (hr). 1. 3. 10. Dissolution sample 1 2 3 4 5 6 1 2 3 4 5 6 1 2 3 4 5 6. % Drug Release 19.36 23.17 21.30 13.30 15.92 17.19 56.52 58.17 54.13 52.26 49.74 48.35 83.39 87.33 91.15 80.76 89.43 85.38. Average % Drug Release. 18.37. 53.19. 86.24. The concentration of xanthan gum was. of % drug release study. In both Trial 4 and 5,. increased from 10% to 15%. The more. same initial release was observed.. sustained release was observed from the results Table No. 12: Dissolution study of Trial batch 6 Time (hr). 1. 3. 10. Dissolution sample 1 2 3 4 5 6 1 2 3 4 5 6 1 2 3 4 5 6. % Drug Release 14.05 15.63 16.97 17.99 15.37 15.94 41.22 40.30 39.25 38.03 42.19 39.78 71.93 73.03 74.24 76.51 74.98 74.42. Average % Drug Release. 15.99. 40.13. 74.18. In trial 6, 20% xanthan gum was used and even. best, therefore, xanthan gum 20% was. more sustained release was obtained. In Trial. optimized. Release in later hours is more. 4, 5 and 6 initial release was controlled and got. sustained or insufficient release, therefore,. good sustained release initially with the use of. needs to adjust the quantity of HPMC, keeping. xanthan gum but in trial 6 initial release was. the xanthan gum 20% fixed in next three trials.. www.ijpir.com.
(11) Rajat S Kharche et al., Int. Journal of Pharmacy & Industrial Research Vol – 02 Issue – 02 Apr – Jun 2012. 143. Table No. 13: Dissolution study of Trial batch 7 Time (hr). 1. 3. 10. Dissolution sample 1 2 3 4 5 6 1 2 3 4 5 6 1 2 3 4 5 6. % Drug Release 33.11 34.34 35.28 36.98 36.33 35.60 68.29 70.13 72.23 69.11 70.21 70.97 98.46 100.01 101.98 99.12 101.05 100.14. Average % Drug Release. 35.27. 70.16. 100.13. In this trial 19% HPMC was used and the. hour. Therefore, needs to control the release by. release obtained is slightly higher during 10th. increasing the concentration of HPMC.. Table No. 14: Dissolution study of Trial batch 8 Time (hr). 1. 3. 10. Dissolution sample 1 2 3 4 5 6 1 2 3 4 5 6 1 2 3 4 5 6. % Drug Release 21.43 24.19 24.48 23.93 22.74 22.09 52.75 51.54 51.43 53.05 50.75 49.43 96.32 95.05 94.31 94.62 93.56 92.11. Average % Drug Release. 23.14. 51.49. 94.33. HPMC 21% was used in this trial and the. trials. This trial meets the acceptance criteria. release obtained is good as compared to other. mentioned in the Table No. 10.. www.ijpir.com.
(12) 144. Rajat S Kharche et al., Int. Journal of Pharmacy & Industrial Research Vol – 02 Issue – 02 Apr – Jun 2012. Table No. 15: Dissolution study of Trial batch 9 Time (hr). 1. 3. 10. Dissolution sample 1 2 3 4 5 6 1 2 3 4 5 6 1 2 3 4 5 6. % Drug Release 17.47 19.49 18.23 20.93 20.06 19.04 43.13 45.25 44.33 47.37 44.86 46.43 78.66 79.36 80.10 81.00 82.10 79.84. Average % Drug Release. 19.20. 45.23. 80.18. 23% concentration of HPMC was used in Trial. Therefore from all the nine trials, Trial 8 gives. 9. The results show that the drug release does. the best results and follows the USP 32 NF27. not fulfill the criteria mentioned in Table No.. effectively. Thus Trial 8 was found the. 10.. optimized batch.. In Vitro Drug Release Profile. Fig. No. 8: Fig. No. 7:. Drug Release Profile of Trial 3 and Trial 4. Drug Release Profile of Trial 1 and Trial 2. www.ijpir.com.
(13) Rajat S Kharche et al., Int. Journal of Pharmacy & Industrial Research Vol – 02 Issue – 02 Apr – Jun 2012. 145. Optimized batch From the result of dissolution study, in the first 3 trial batches initial burst release was seen. Then from the 4th trial, xanthan gum was used alonwith HPMC K100M. Hence initial burst release was sustained to some extent. In the 6th trial the xanthan gum 20% was optimized, as the initial burst release was sustained but fails in the 3rd hour and 10th hour. Then in the subsequent trials, the concentration of HPMC K100M was varied keeping the concentration Fig. No. 9:. of xanthan gum same.. Drug Release Profile of Trial 5 and Trial 6 The optimized batch obtained is the 8th trial which follows the dissolution parameter as per the USP 32. Precompression Parameters of Trial 8 Bulk density. = 0.6657 g/ml. Tapped density = 0.834 g/ml Carr’s index. = 18.49%. Hausners ratio = 1.237 Angle of repose = 23054’. Fig. No. 10: Drug Release Profile of Trial 7 and Trial 9. Post compression parameters Trial 8 was found the optimized batch. Uniformity of weight Weight of 20 tablets. = 19.55 g. Average weight of tablet = 0.9775 g As per USP 32, average weight of tablet is more than 324 mg, therefore the percentage difference is 5%. Fig. No. 11: Drug Release Profile of Trial 8. www.ijpir.com.
(14) 146. Rajat S Kharche et al., Int. Journal of Pharmacy & Industrial Research Vol – 02 Issue – 02 Apr – Jun 2012. Table No. 16: Post compression parameters of 9 Trials Formulation Trial 1 Trial 2 Trial 3 Trial 4 Trial 5 Trial 6 Trial 7 Trial 8 Trial 9. Weight of tablet (g) 0.9908 0.9601 0.9828 0.9760 0.9841 0.9782 0.9772 0.9762 0.9559. Length (mm) 19.45 19.47 19.45 19.35 19.46 19.37 19.36 19.46 19.47. Breadth (mm) 9.53 9.52 9.54 9.45 9.46 9.52 9.45 9.52 9.53. Thickness (mm) 6.34 6.53 6.57 6.57 6.59 6.54 6.45 6.55 6.46. Hardness (kg/cm2) 18 19 17 18 16 18.5 19.5 17.5 18. Friability (%) 0.16 0.19 0.15 0.18 0.17 0.14 0.16 0.18 0.15. Kinetic Study of Optimized Batch Table No. 17: Kinetic Study of Optimized batch Formulation Trial 8. First order 0.998. Zero order 0.932. Coefficient of Correlation Higuchi Hixon-Crowel Cube Model Root Law 0.995 0.997. From the kinetic study point of view the in. 4.. Korsmeyer-Peppas Model -. Weight Variation Test, The United States. vitro release profile of trial batch 8 was fitted. Pharmacopoeia 32 National Formulary 27,. in all the five models. The ‘R’ value is greater. United States Pharmacopoeia convention, Inc.,. for first order kinetics. Therefore, Trial batch 8 followed the first order kinetics.. Rockville, MD, 2009, 785. 5.. Lachman L., Liberman H.A., Kanig J.L., The Theory and Practice of Industrial Pharmacy, 3rd Edn., 3rd Indian Reprint, Varghese. Acknowledgment. Publishing House, Bombay, 1990, 297-298.. The authors are thankful to Twilight Litaka. 6.. Pharma Ltd., Pune for providing Metformin HCl and other excipients as gift samples and. Fulzele S. V., and Mandaogade P. M., Ind. J. Pharm. Sci., 64 (2), 2002, 138141.. 7.. Remington's Pharmaceutical Sciences, The. facilities to carry out the work. I am also. Science and Practice of Pharmacy, Mack. thankful to P. Wadhwani College of Pharmacy,. Publishing Company, Volume 1, 19th Edn,. Yavatmal,. India. for. supporting. me. in. successful completion of this work.. 1669-1670. 8.. Pharmacopoeia 32 National Formulary 27, United States Pharmacopoeia convention, Inc.,. References 1.. Jaleh Varshosaz, Naser Tavakoli, and Fatemeh Kheirolahi, AAPSPharmSciTech, 2006, 7(1), Article 24, E1-E5.. 2.. Sean C Sweetman, Martindale The Complete Drug. Reference. (2009),. 36th. Rockville, MD, 2009, 725. 9.. McClelland G. A., Sutton S., Engle K., Zetner G. M., Pharm. Res., 8, 1991, 88-92.. 10. The United State Pharmacopoeia, (USP32-. Edition,. Published by Pharmaceutical Press 437,453. 3.. Tablet Friability Test, The United States. The United States Pharmacopoeia 32 National Formulary 27, United States Pharmacopoeia convention, Inc., Rockville, MD, 2009, 2907.. www.ijpir.com. NF27), The Official compendia of Standards, United State Pharmacopoeial Convection Inc. Rockville, 2009, 2907..
(15)
Figure

+7


Related documents
If two of the three examiners have assigned ≥50% of marks then the candidate passes the examination and if two of the three examiners have assigned less than 50% of marks,
NK cell production of IFN- ␥ after coculture with the cell line K562 was increased when the cells were treated with IL-15 or IL-12 alone, as well as with IL-15 in combination with
The mere fact that an insured does not elect to take out cover against theft by an employee (fidelity cover) did not mean that this loss was not covered by another part of the
[r]
If a customer wants to use an alternate form of currency for a contract-based payment, refer to the Manual Payment method described in the subsection Editing a
Historically speaking, the PWM is the most popular technology of drivers for power electronics systems. Surprisingly, many growing innovative ideas on PWM schemes, are
Those who support the immigrant receiving in these Member States talk about that their tradition in having immigrants, but we are not sure that these traditions are good
For alpaca weft fabrics, alpaca/silk (AS) and alpaca/polyester (AP), again alpaca/polyester has a lower weft face percentage, ie., more polyester warp on the surface
