Preliminary Study on a System for Visualization of Big Data in SMEs
Yasuo Uchida
1,*, Miao Xinyun
1, Seigo Matsuno
1, Yasushi Iha
2, Makoto Sakamoto
31Department of Business Administration, National Institute of Technology, Ube College, Ube, Japan
2
Department of Media Information Engineering, National Institute of Technology, Okinawa College, Nago, Japan
3
Department of Computer Science and Systems Engineering, University of Miyazaki, Miyazaki, Japan
Received 19 July 2017; received in revised form 30 July 2017; accepted 03 August 2017
Abstract
The 2012 White Paper on Information and Co mmun ications in Japan issued by the Ministry of Internal Affa irs
and Co mmunications of Japan advocates use of big data under its “Special The me: ICT -induced and accelerated
Disaster Recovery and Japan’s Re-birth.” However, the analysis in the Japan Users Association of Information Systems’ white paper on its 2014 IT trend survey for co mpanies reports that less than 10% of co mpanies utilize big
data, and it would appear that progress in its use is centered on large firms. Under such conditions, use of big data is
becoming a challenge for the purpose of ensuring the survival and success of SM Es as we ll. As a result, R&D and
technological support for SMEs are becoming pressing issues. However, at present there has been almost no
academic research concerning policies and future direct ions for use of big data at SMEs. Accordingly, th is study
conducted the modelizat ion of the procedure fo r v isualization of big data fo r SM Es. Specifically, we o rganized the
procedure as a tutorial, fro m obtaining data of Japanese hot -spring areas using web scraping, to visualizing them
using the visualization software Cytoscape
Keywor ds: big data, visualization, SMEs, Cytoscape
1.
Introduction
This study is intended to research and develop a system for visualizat ion of big data suited to SMEs, as a tactica l
information tool to support SMEs’ strategies for success under conditions of increasing ly intense global co mpetition. That is, it
aims to probe a fra me work that is easy to adopt and superior in terms of operability for the collection, storage, analysis, a nd use
of big data. At the same time, it also a ims to eluc idate e mpirica lly the ideal fo rm of a strategic information infrastructure for
SMEs and challenges in its operation and administration.
In this study, we carried out a preparatory consideration of visualization of big data by SMEs. Specifically, we organized
the procedure as a tutorial, fro m obtaining data of Japanese hot-spring areas using web scraping, to visualizing the m using the
visualization software Cytoscape.
2.
Trends in Use of Big Data at SMEs in Japan
At present, there are very few e xa mp les of successful use of big data by Japanese SMEs. In addition, how big data is used
at SMEs depends on individual planning by each company. Accordingly, this paper will begin by summarizing measures taken
and research trends related to the use of big data at Japanese SMEs. It also will e xa mine a nu mber of e xa mp les of early
adopters.
For example, the report “Enriched Living and Economy fro m Connected IT: The Value and Reliab ility of Big Data”[1]
fro m the Research Group on IT Infrastructure for Living and the Economy of the Informat ion -technology Promotion Agency,
Japan (IPA) (IT Infrastructure for Living and the Economy of the Informat ion -technology Promotion Agency, Japan) both
e xpla ins in simp le terms what big data means for managers of co mpanies aiming to provide new services using big dat a and
identifies results such as expansion of business opportunities through summa rizing e xa mp les of early adopters of big data,
advantages and issues in service realization, and efforts to resolve these.
In addition, the 2014 White Paper on Small and Mediu m Enterprises in Japan [2] fro m the Sma ll and Mediu m Enterprise
Agency mentions use of data on corporate transactions (big data) as a “key” to revitalization of regional economies.
Looking at the activit ies of SM Es in the fie ld, in Nove mber 2014 the Osaka Cha mber of Co mmerce and Industry
published the results of a survey intended to ascertain matters such as expectations, needs, and issues involved in use of big
data by second-tier co mpanies and SMEs [3]. While the results of this survey show that approximate ly 81% of co mpanies are
interested in “information (data)” as “useful for management purposes,” respondents also identify the following as the top
three “issues in use” of data:
“Difficulty of understanding the cost-effectiveness of use of information (data)” (64.9%)
“Lack of human resources to analyze information (data)” (56.9%)
“Lack of understanding of methods of using information (data)” (34.0%)
Accordingly, we decided to proceed with research and development focusing on these three points. First of all, we
identified as a necessary condition the ability to use personal computers having specificat ions like those used in ord inary
administrative-leve l operations instead of high-priced co mputers, to keep costs down as much as possible. We also decided t o
use, in principle, software such as open-source software that can be used free of charge as tools needed for analysis and
visualizat ion. Another prerequisite we identified was that the data analysis must be of a degree capable of being conducted b y
emp loyees who have the skill levels needed to analyze data using spreadsheet software (such as Microsoft Exce l), since it is
difficult for SM Es to secure staff that have specialized data analysis skills. Furthermo re, we decided to provide hints on use of
data by describing specific examples of methods of their use.
3.
Visualization of Big Data
3.1. Steps from data collection through visualization
The data subject to visualizat ion can be broken down into two main categories. The first consists of data in the possession
of the co mpany itself. In this case, the co mpany has ascertained the content of the data sufficiently and it is easy for it t o process
the data on its own. The other category consists of data that is present on the Internet. In this case, it is difficult to understand
the structure of the data and they are not easy to obtain. However, somet imes SM Es will want to obtain and utilize these data .
Accordingly, this study will consider the steps used when obtaining and processing data present on the In ternet. Since the main
objective of this study is to illustrate a data processing model, we limited the purposes of visualization itself to the following
content:
Subject data to be collected: Data on hot-springs resorts in Japan, published on the Internet
Purpose of visualization: To visualize the locations and water qualities of hot -springs resorts
3.2. Data acquisition and processing
When obtaining data through Web scraping, the permission of the data provider must be obtained in advance. There is a
need to consider how to avoid burdening the servers and network when actually obtaining the data. Besides, the end-user
license agree ment must be co mplied with fo r the data obtained. A lthough we used the Python language [6] as a software
environment for obtain ing and processing data, we arrang ed the model as one consisting of steps that could be used even by
non-specialists, with consideration for ease of use.
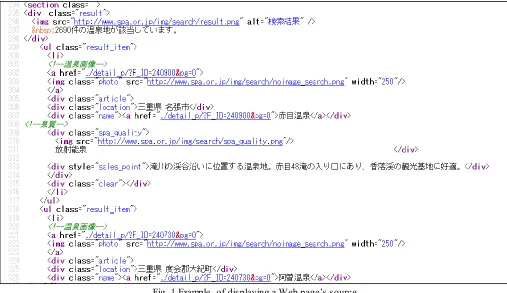
(1) Analysis of Web pages
There was a need to analy ze the data structure of Web pages and identify the data obtained. Th is can be done using the
View source” feature of a Web browser (Fig. 1).
Fig. 1 Example of displaying a Web page’s source
(2) We used a Python program to obtain the desired data from within Web pages through Web scraping. In this study, we
obtained only data on the names and water quality of hot-springs resorts.
(3) We used the Python program to look up the latitude and longitude of the hot -springs resorts in Google Maps [7].
(4) We processed the above data using Exce l and other tools and saved it as network data. An e xa mp le of the fo rmat of the data
is provided below. In th is case, we used latitude as the Y-a xis va lue on the graph a fter inverting positive and negative signs,
since display coordinates and axial directions on the monitor are reversed .
Sample network data format:
Prefecture name, hot-springs resort name, water quality, X coordinate (longitude), Y coordinate (latitude)
3.3. Visualizationusing Cytoscape
Cytoscape is a tool for visualizat ion of networks (through a graph structure). For this reason, the subject of processing
needs to have a network structure. Accordingly, we decided to analy ze the locations of hot -springs resorts and their local
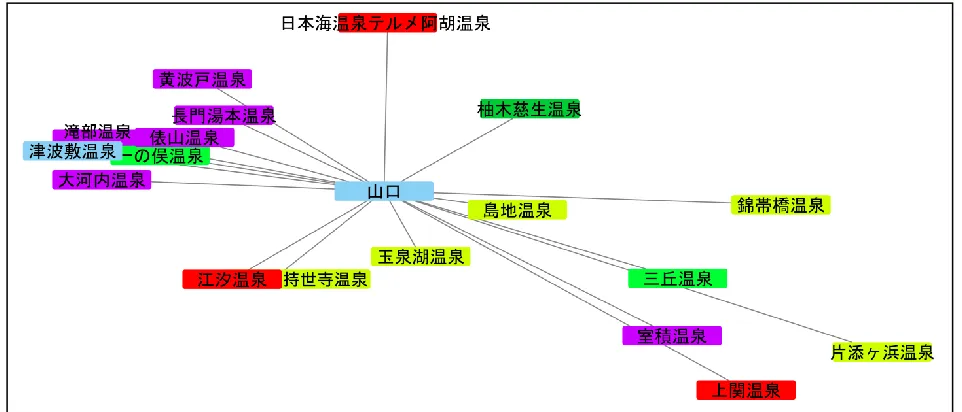
prefecture capitols, as an exa mp le of a network. Fig. 2 shows an exa mple of v isualization of information on hot -springs resorts
In the center of the graph is the Ya maguchi Prefecture capitol. Fro m this graph, the reader can identify the mutual positioning
from the latitudes and longitudes on the map and the water quality from the color coding of the hot -springs resort names.
Fig. 2 Visualization of hot-springs resorts in Yamaguchi Prefecture
4.
Discussion
In this study, ultimately we visualized structured data. First of all, the origina l data source of Web page source text
(HTM L) is semistructured data [8]. We followed the method of Web scraping to obtain data fro m the content of Web pages.
Ne xt, when the data obtained as in this study are composed of multip le files, there is a need for steps such as data abstraction
and combination. This p rocess requires use of data-processing tools and programming languages. In addition, occasionally it is
impossible to apply general-purpose tools to conversion of semistructured to structured data, and in such cases one must rely
on programming languages. Also, in the case of a locale such as Japan that employs mult ibyte characters, sometimes text code
conversion is required [9].
5.
Conclusion
This study employed a preparatory consideration of a system for visualizat ion of Big Data at SMEs, eluc idating a number
of require ments. That is, it showed that in processes such as data collection and data processing there are many cases in which
it is difficult to process the data using general-purpose tools alone. Topics for future study include development of independent
tools to supplement general-purpose tools as well as development of general-purpose models for the steps involved in
visualization and preparation of tutorials suitable for use by SMEs.
Acknowledgement
This work was supported by JSPS KAKENHI Grant Number 15K03639 .
References
[1] IT Infrastructure for Living and the Economy of the Information -technology Promotion Agency, Japan, “Enriched living and economy from connected IT: the value and reliability of big data,” http://www.ipa.go.jp/files/000001884.pdf. [2] Small and Medium Enterprise Agency, “2014 White paper on small and medium enterprises in Japan,”
http://www.chusho.meti.go.jp/pamflet/hakusyo/H26/PDF/h26_pdf_moku ji.ht ml.
[3] The Osaka Chamber of Commerce and Industry, “Results of survey on use of big data,” Press Release, 2014.
[5] Cytoscape Consortium, “Cytoscape,” http://www.cytoscape.org/. [6] Python Software Foundation, “Python,” https://www.python.org/.
[7] Python Software Foundation, “Pygeocoder,” https://pypi.python.org/pypi/pygeocoder.
[8] D. Quass, A. Rajaraman, Y. Sagiv, J. Ullman, and J. Widom, “Querying semi structured heterogeneous information,” Journal of Systems Integration, vol. 7, no. 3, pp. 381-407, 1997.