S H O R T R E P O R T
Open Access
Comparative survey of go/no-go results to
identify the inhibitory control ability change of
Japanese children
Koji Terasawa
1*, Hisaaki Tabuchi
1, Hiroki Yanagisawa
2, Akitaka Yanagisawa
3, Kikunori Shinohara
4, Saiki Terasawa
5,
Osamitsu Saijo
6and Takeo Masaki
6Abstract
This research, conducted in 1998 and 2008, uses go/no-go data to investigate the fundamentals of cognitive functioning in the inhibitory control ability of Japanese children. 844 subjects from kindergarten to junior high school participated in go/no-go task experiments. Performance of go/no-go tasks, which are frequently used to investigate response inhibition, measures a variety of cognitive components besides response inhibition. With normal brain development, the ability to inhibit responses improves substantially in adolescence. An increase over time in the error rate during the go/no-go tasks of subjects of the same age indicates that these processes are not functioning properly. Comparisons between the 1998 and 2008 data revealed several differences in error rates. In 2008, there were increases in the number of errors in groups from each age range. The comparison also revealed that overall error rates peaked at later ages in the 2008 subjects. Taken together, these results show changing conditions in the inhibitory function of the prefrontal cortex. However, the reason for these changing conditions remains unclear. While a lifestyle questionnaire revealed several differences in factors such as bedtimes and hours spent watching TV, analysis did not reveal a significant correlation.
Introduction
Cognitive control functions continue to improve from infancy until early adulthood, allowing flexible adaptation to a complex environment [1]. Growth in executive func-tioning skills play a role in children's academic success, and the transition to elementary school is an important time for the development of these abilities [2]. Executive functions make it possible to mentally play with ideas and take the time to think before acting. Core executive functions are inhibition and interference control, working memory, and cognitive flexibility [3]. Both inhibitory-based executive functioning and basic information processing deficits are found in clinic-referred attention deficit hyper-activity disorder samples [4].
Response inhibition is an essential executive function implemented by the prefrontal cortex.
Recent neuropsychological and neuroimaging studies have shown that the presupplementary motor area and ventrolateral prefrontal cortex are crucial for response inhibition and that various subregions of the prefrontal cortex make different contributions leading to successful response inhibition [5]. Performance of go/no-go tasks, which are frequently used to investigate response inhib-ition, requires a variety of cognitive components besides response inhibition [6].
In view of the changing cultural conditions and their potential influence on response inhibitory function im-plemented by the prefrontal cortex, we have been inves-tigating the condition of children’s inhibitory function. In particular, we have been focusing on the inhibitory control ability using go/no-go tasks since 1969 [7-10]. The number of errors made by sixth and seventh graders in go/no-go tasks has been increasing since around 1980.
Despite this, no research has applied go/no-go tasks to subjects from kindergarten to junior high school to explore the process of inhibitory development. Thus, we * Correspondence:kterasa@shinshu-u.ac.jp
1
Shinshu University, Faculty of Education, 6-Ro Nishinagano Naganoshi, Nagano 380-8544, Japan
Full list of author information is available at the end of the article
investigated the developmental inhibitory process of the repression function of children from kindergarten to junior high school using go/no-go tasks.
Methods
Participants
The participants were children aged 3 to 15 years from the same kindergarten-to-junior high school (G1 to G12). 437 children (225 boys and 212 girls) partici-pated in 1998 and 407 different children (200 boys and 207 girls) participated in 2008 (see Table 1 for details). In this investigation, no children with ADHD or autism were included. The latest guidelines of the Helsinki Declaration were followed, and the study was approved by the Institutional Ethics Committee of Shinshu University. Written informed consent was obtained from the children and their parents.
Task
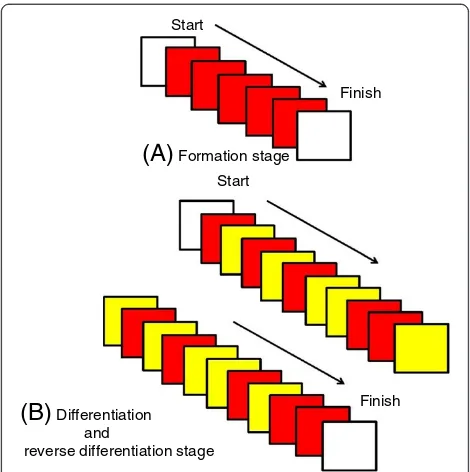
The go/no-go task consisted of the following three stages: formation, differentiation, and reverse differentiation. In the formation stage, the participants were trained to squeeze a rubber ball in response to a red light stimulus, which was displayed five times (Figure 1A). For the differ-entiation stage, they were asked to squeeze it in response to red but not to yellow (Figure 1B). For the reverse differentiation stage, the instructions were reversed; that is, they squeezed the ball in response to yellow but not to red. Each participant performed 20 trials each during the differentiation and reverse differentiation stages and the number of errors from the 40 trials of the two stages was calculated. Yellow and red stimuli were used for G1 to G9 subjects, and bright and dim lights were used as stimuli for G10 to G12 subjects. The dur-ation of each stimulus was random between 200 and 1100 ms. The inter-stimulus interval was also random between 1300 and 7500 ms.
The participants were seated in a booth enclosed on three sides by 45 × 45 cm panels. Stimuli were presented in a framed rectangle (2.5 cm × 3.7 cm), which was approximately 70 cm away from their eyes. The experiment was conducted by computer-controlled equip-ment (ME Corporation, Nagano, Japan).
Statistical analysis
We used the number of errors for statistical analysis of the go/no-go tasks. Reaction times could not be deter-mined because we used analog data collection in 1998. In this study, we analyzed the data classified according to age as defined by educational grade. Preliminary analyses were conducted to determine if there were any differences in the number of errors made bet-ween each grade in kindergarten, elementary school and junior high school using one-way ANOVA and Tukey’s honest significant difference post hoc multiple comparison test. We used two-way ANOVA to make a comparison between 1998 and 2008 data. Because the data obtained from the go/no-go tasks have a limited number of errors and a normal distribution is not as-sumed in this case, secondary analyses used the Poisson distribution.
Table 1 The number of participants
Grade level Age (years) 1998 2008
G1 3 - 4 23 28
G2 4 - 5 53 46
G3 5 - 6 53 30
G4 6 - 7 37 33
G5 7 - 8 37 35
G6 8 - 9 32 28
G7 9 - 10 35 29
G8 10 - 11 33 35
G9 11 - 12 32 31
G10 12 - 13 36 38
G11 13 - 14 31 38
G12 14 - 15 35 36
Start
Finish
(A)
Formation stage StartFinish
(B) Differentiation
and
reverse differentiation stage
The participant’s wakeup time, bedtime, and time spent playing, studying, watching TV and playing videogames were assessed from a questionnaire filled out after the experiment. The results of the questionnaires from 1998
and 2008 were compared using independent t-tests.
In addition, we investigated the correlation between the number of errors for the go/no-go task and the numerical values of the 2008 questionnaire.
The level of significance was set at p <0.05. Statistical analyses were performed using SPSS Statistical Packages (SPSS Inc., Chicago, USA).
Results
For the convenience of statistical analysis, the participants were categorized into three respective age groups: kinder-garten (G1 to G3; ages 3 to 6 years), elementary (G4 to G9; ages 6 to 12 years), and junior high school (G10 to G12; ages 12 to 15 years, see Table 1 for details).
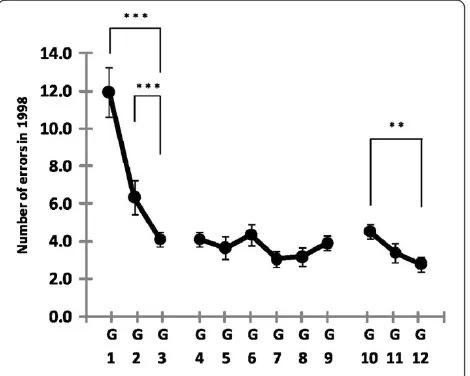
The number of errors in 1998
Figure 2 shows that the number of errors decreases with age, especially between G1 and G3. An independent ANOVA indicated that the effect of age group was signifi-cant [F(2,126) = 18.7, p <0.001]. For the kindergarten group, Turkey’s HSD analyses showed that the numbers of errors for G2 (mean (M) =6.4, standard error (SE) =0.9) and G3 (M = 4.1, SE = 0.4) were significantly lower than for G1 (M = 12.0, SE = 1.3) [G1 vs. G2, p <0.001; G1 vs. G3,p <0.001]. The results of the elementary-school group from G4 to G9, however, were almost the same across these different ages [F(5,200) =1.1,p >0.37]. In the junior-high-school group, the number of errors also decreased with age [F(2,99) = 27.4,p <0.01]. The difference between
G10 (M = 4.5, SE = 0.4) and G12 (M = 2.8, SE = 0.4) was significant [p <0.01].
The number of errors in 2008
Figure 3 shows that the number of errors decreased with age from G1 to G3, similar to what was observed in 1998. An independent ANOVA indicated that the effect of age group was significant [F(2,101) = 24.0, p < 0.001]. The numbers of errors for G2 (M = 7.4, SE = 0.5) and G3 (M = 5.3, SE = 0.5) were significantly lower than for G1 (M = 12.1, SE = 0.9) [G1 vs. G2, p < 0.001; G1 vs. G3, p < 0.001]. The elementary-school group from G4 to G9 did not show a statistically significant difference in error rate [F(5,185) = 23.5, p > 0.09]. In the junior-high-school group, the difference in the number of errors between G11 (M = 6.8, SE = 0.7) and G12 (M = 4.0, SE = 0.6) was significant [p < 0.01].
Comparison between 1998 and 2008
The results of 1998 and 2008 are superimposed in Figure 4. Although the overall patterns are similar, the numbers of errors in 2008 tended to be greater than those of 1998. The greatest difference for the different years of investi-gation was found in G11; the average number of errone-ous responses was 3.4 in 1998, as opposed to 6.8 in 2008. The effect of the research year was statistically significant [F(1,198) = 14.7, p < 0.001]. A post-hoc ana-lysis based on a Poisson distribution indicated that the 2008 results for G5, G8, G10, and G11 were statistically higher than those of 1998 [p < 0.001].
Lifestyle survey and correlational investigation
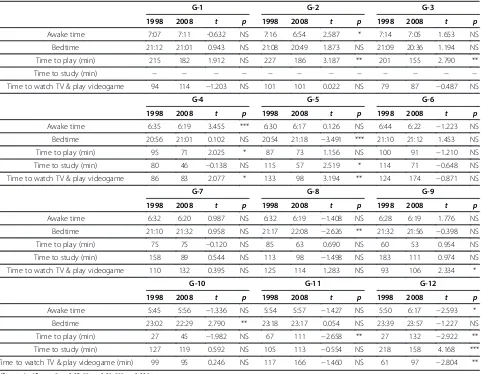
Table 2 shows the mean response from each survey question in 1998 and 2008. Although some lifestyle
Figure 2Number of errors for G1 to G12 in 1998.The data points and error bars indicate mean and the standard error, respectively. Significant differences are denoted with ** forp <0.01 and *** forp <0.001.
**
questions, such as wakeup time for G4, bedtime for G5, and time spent studying for G12, were found to be sta-tistically significant between the survey years, the pattern of significance seemed too sporadic to interpret.
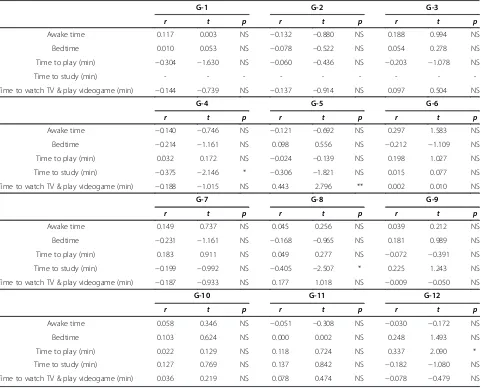
Table 3 indicates the correlation between each lifestyle question in 2008 and the number of errors for the go/ no-go task. A positive correlation coefficient indicates that the number of errors increases as the numerical value for the survey question increases, whereas a nega-tive correlation coefficient indicates that the number of errors decreases as the numerical value for the survey question increases. The error rate and time spent watch-ing TV and playwatch-ing videogames were positively correlated for G5 and G8, although the strength of relationship was moderate or less. A negative correlation was also found for time spent studying for G4 and G8.
Discussion
Investigations were done in 1998 and 2008 using go/no-go tasks to look into inhibitory control as an essential
Table 2 Results from the lifestyle questionnaire in 1998 and 2008
G-1 G-2 G-3
1998 2008 t p 1998 2008 t p 1998 2008 t p
Awake time 7:07 7:11 -0.632 NS 7:16 6:54 2.587 * 7:14 7:05 1.653 NS
Bedtime 21:12 21:01 0.943 NS 21:08 20:49 1.873 NS 21:09 20:36 1.194 NS
Time to play (min) 215 182 1.912 NS 227 186 3.187 ** 201 155 2.790 **
Time to study (min) − − − − − − − − − − − −
Time to watch TV & play videogame 94 114 −1.203 NS 101 101 0.022 NS 79 87 −0.487 NS
G-4 G-5 G-6
1998 2008 t p 1998 2008 t p 1998 2008 t p
Awake time 6:35 6:19 3.455 *** 6:30 6:17 0.126 NS 6:44 6:22 −1.223 NS
Bedtime 20:56 21:01 0.102 NS 20:54 21:18 −3.491 *** 21:10 21:12 1.453 NS
Time to play (min) 95 71 2.025 * 87 73 1.156 NS 100 91 −1.210 NS
Time to study (min) 80 46 −0.138 NS 115 57 2.519 * 114 71 −0.648 NS
Time to watch TV & play videogame 86 83 2.077 * 133 98 3.194 ** 124 174 −0.871 NS
G-7 G-8 G-9
1998 2008 t p 1998 2008 t p 1998 2008 t p
Awake time 6:32 6:20 0.987 NS 6:32 6:19 −1.408 NS 6:28 6:19 1.776 NS
Bedtime 21:10 21:32 0.958 NS 21:17 22:08 −2.626 ** 21:32 21:56 −0.398 NS
Time to play (min) 75 75 −0.120 NS 85 63 0.690 NS 60 53 0.954 NS
Time to study (min) 158 89 0.544 NS 113 98 −1.498 NS 183 111 0.974 NS
Time to watch TV & play videogame 110 132 0.395 NS 125 114 1.283 NS 93 106 2.334 *
G-10 G-11 G-12
1998 2008 t p 1998 2008 t p 1998 2008 t p
Awake time 5:45 5:56 −1.336 NS 5:54 5:57 −1.427 NS 5:50 6:17 −2.593 *
Bedtime 23:02 22:29 2.790 ** 23:18 23:17 0.054 NS 23:39 23:57 −1.227 NS
Time to play (min) 27 45 −1.982 NS 67 111 −2.658 ** 27 132 −2.922 **
Time to study (min) 127 119 0.592 NS 105 113 −0.554 NS 218 158 4.168 ***
Time to watch TV & play videogame (min) 99 95 0.246 NS 117 166 −1.460 NS 61 97 −2.804 **
NS, not significant; *p < 0.05; **p < 0.01; ***p < 0.001.
executive function implemented by the prefrontal cortex in children. The subjects in this study were all ordin-ary children and the conditions of their academic maturation were the same; the same kindergarten, primary school, and junior high school were used in both years.
The number of errors for kindergarten groups was approximately the same for G1 but greater in 2008 for G2 and G3. The number of errors for primary school groups was virtually the same from G4 to G9. Compari-sons between the results from 1998 and 2008 showed no statistically significant differences from G4 to G9. How-ever, a change in the error peak patterns can be seen. The number of errors in 1998 peaks in G6, whereas the 2008 data show a maximum in G5 and a second increase in G8 with both groups showing a statistically significant increase over the same 1998 groups (Figure 3). In 2008,
the number of errors was greater in G5 than G3, a pat-tern that was not observed in 1998. The second peak (G8) in 2008 was not seen previously. These changes in-dicate that during the 10 years between tests, the inhibi-tory control ability has declined.
The period from early childhood to school age is im-portant for the development of several brain functions. Dowsett et al. [11] reported that the conceptual under-standing of inhibition responses is acquired by the age of 7 in typically developing children.
For junior high school students, in 1998 the number of errors decreased gradually from G10 to G12. However, in 2008, the number peaked in G11. According to the stat-istical comparisons between 1998 and 2008, the number of errors in G10 and G11 increased significantly in 2008. In addition, the number of errors in G11 increased at a greater rate compared to 1998. This increase suggests Table 3 Correlations between number of errors and lifestyle questionnaire responses in 2008
G-1 G-2 G-3
r t p r t p r t p
Awake time 0.117 0.003 NS −0.132 −0.880 NS 0.188 0.994 NS
Bedtime 0.010 0.053 NS −0.078 −0.522 NS 0.054 0.278 NS
Time to play (min) −0.304 −1.630 NS −0.060 −0.436 NS −0.203 −1.078 NS
Time to study (min) - - -
-Time to watch TV & play videogame (min) −0.144 −0.739 NS −0.137 −0.914 NS 0.097 0.504 NS
G-4 G-5 G-6
r t p r t p r t p
Awake time −0.140 −0.746 NS −0.121 −0.692 NS 0.297 1.583 NS
Bedtime −0.214 −1.161 NS 0.098 0.556 NS −0.212 −1.109 NS
Time to play (min) 0.032 0.172 NS −0.024 −0.139 NS 0.198 1.027 NS
Time to study (min) −0.375 −2.146 * −0.306 −1.821 NS 0.015 0.077 NS
Time to watch TV & play videogame (min) −0.188 −1.015 NS 0.443 2.796 ** 0.002 0.010 NS
G-7 G-8 G-9
r t p r t p r t p
Awake time 0.149 0.737 NS 0.045 0.256 NS 0.039 0.212 NS
Bedtime −0.231 −1.161 NS −0.168 −0.965 NS 0.181 0.989 NS
Time to play (min) 0.183 0.911 NS 0.049 0.277 NS −0.072 −0.391 NS
Time to study (min) −0.199 −0.992 NS −0.405 −2.507 * 0.225 1.243 NS
Time to watch TV & play videogame (min) −0.187 −0.933 NS 0.177 1.018 NS −0.009 −0.050 NS
G-10 G-11 G-12
r t p r t p r t p
Awake time 0.058 0.346 NS −0.051 −0.308 NS −0.030 −0.172 NS
Bedtime 0.103 0.624 NS 0.000 0.002 NS 0.248 1.493 NS
Time to play (min) 0.022 0.129 NS 0.118 0.724 NS 0.337 2.090 *
Time to study (min) 0.127 0.769 NS 0.137 0.842 NS −0.182 −1.080 NS
Time to watch TV & play videogame (min) 0.036 0.219 NS 0.078 0.474 NS −0.078 −0.479 NS
diminished inhibition control ability in G11. This result shows diminished cognitive components, besides response inhibition, of the brain of Japanese children for the ten years from 1998 to 2008. We do not yet understand the cause, but it may be some kind of influence such as envir-onmental changes.
Tamm et al. [12] reported that the go/no-go task re-quires multiple executive functions, including working memory, interference avoidance, and response withhold-ing, which have been established as prepotent responses. Working memory provides for the need to access and ma-nipulate information in the short-term memory system [13]. In recent years, the working memory model has been further supported by neuroimaging studies. Selective attention, the capacity to focus on one stream of informa-tion while shutting out irrelevant material, is needed to solve a task immediately [14]. Furthermore, the capacity to switch attention from one source to another is also necessary. These important roles are assumed by working memory. Almost all measures of short-term memory show a steady increase from the preschool years through adolescence: Behavioral measures of working memory systems improve substantially between the ages of 4 and 15 [15,16]. Based on this data, an increased error rate for go/no-go tasks reflects a changed condition in the inhibitory function that is an essential executive function implemented for working memory by the pre-frontal cortex.
We carried out a survey to explore possible correla-tions that may be found in children’s lifestyle changes. Significant correlations between the number of errors in the go/no-go tasks and the hours spent watching television and playing videogames, bedtime, and the number of hours of sleep were found in some grades. Overall, however, no significant correlation between the number of errors in the go/no-go tasks and the lifestyle survey was found. From this, we conjecture that the change condition in the inhibitory function is not directly related to lifestyle factors such as the time you, wakeup, bedtime, hours spent studying or hours spent watching television and playing video games. Thus, other potential causes for these delays must be explored.
The Japanese lifestyle survey from 1956 to 1978 re-ported large time changes on the average [17]. Play -time decreased to 53 minutes, TV watching and listening to stereo and radio increased to 59 minutes, time doing housework decreased to 74 minutes, and studying in-creased to 104 minutes. This may be related to the decrease in physical activity. In the future, our studies need to include these things.
Competing interests
The authors declare that they have no competing interests.
Authors’contributions
KT, OS and TM participated in the design of this study and drafted manuscript. HT, AY, KS and ST carried out data collection and analysed the data. HT provided the information about the psychological variables. ST carried out back translation into English, and confirmed phrasing nuances with HY and KS. OS, TM and HT evaluated the results of the study and reviewed the manuscript. All authors read and approved the final manuscript.
Acknowledgements
The authors would like to thank Koki Nakajima, Kenichi Nemoto, Tomio Matsumura, Hiroshi Miura, Masao Okuhara, and Satomi Fujimori for technical support.
Koji Terasawa are supported by a Grant-in-Aid for the Scientist (Houga: 26560380, Kiban A: 25257101) of the Ministry of Education, Culture, Sports, Science and Technology of Japan. This study was supported grant of the Preventive Medical Center of Shinshu University Hospital from Ministry of Education, Culture, Science and Technology.
Author details 1
Shinshu University, Faculty of Education, 6-Ro Nishinagano Naganoshi, Nagano 380-8544, Japan.2Physical Fitness Research Institute, Meiji Yasuda Life Foundation of Health and Welfare, 150 Tobukimachi Hachoujisi, Tokyo192-0001, Japan.3Department of Infant Childcare, Matsumoto Junior College, 3118 Sasaga Matsumotosi, Nagano 399-0033, Japan.4Center of General Education and Humanities, Tokyo University of Science, 5000-1 Toyohira Chino, Nagano 391-213, Japan.5Department of Electrical and Electronic Engineering, Shinshu University, 4-17-1 Wakasato Naganoshi, Nagano 380-928, Japan.6Laboratory of Psychology, Nippon Sport Science University, 7-1-1 Fukasawa Setagayaku, Tokyo 158-0081, Japan.
Received: 19 April 2014 Accepted: 3 July 2014 Published: 11 July 2014
References
1. Liu ZX, Woltering S, Lewis MD:Developmental change in EEG theta activity in the medial prefrontal cortex during response control.
Neuroimage2014,2:873–887.
2. Grammer JK, Carrasco M, Gehring WJ, Morrison FJ:Age-related changes in error processing in young children: aschool-based investigation.
Developmental Cognitive Neuroscience2014,9:93–105.
3. Diamond A:Executive functions.Annu Rev Psychol2013,64:135–168. 4. Salum GA, Sergeant J, Sonuga-Barke E, Vandekerckhove J, Gadelha A, Pan
PM, Moriyama TS, Graeff-Martins AS, de Alvarenga PG, do Rosário MC, Manfro GG, Polanczyk G, Rohde LA:Specificity of basic information processing and inhibitory control in attention deficit hyperactivity disorder.Psychol Med2014,44:617–631.
5. Chikazoe J, Konishi S, Asari T, Jimura K, Miyashita Y:Activation of right inferior frontal gyrus during response inhibition across response modalities.J Cogn Neurosci2007,19:69–80.
6. Chikazoe J:Localizing performance of go/no-go tasks to prefrontal cortical subregions.Curr Opin Psychiatry2010, 23(3):267–272.
7. Masaki T, Moriyama G:A study on the types of the human higher nervous activity.J Tokyo Science Univ1971,4:69–81.
8. Saijo O, Mriyama G, Noshi K, Kumano K, Muramoto K, Abe S, Masaki T:A study on the types of the children higher nervous activity.J Nippon Sport Science Univ1981,10:61–68.
9. Terasawa K, Zhiyong J:A comparative study: pattern of the higher nervous activity of Chinese and Japanese.J Beijing Institute of Physical Education1986,4:87–94. in Chinese.
10. Terasawa K, Saijo O, Shinohara K, Nemoto K, Masaki T, Yanagisawa A: A survey of patterns in the development of cerebral activity in '69, 79, 98 in Japanese and in '84 in Chinese children.J Physiological Anthropology2000,5:47–54. in Japanese.
11. Dowsett SM, Livesey DJ:The development of inhibitory control in preschool children: effects of“executive skills”training.Dev Psychobiol 2000,36:161–174.
13. Baddeley AD:Working memory.Oxford: Oxford University Press; 1986. 14. Baddeley AD:Working memory and executive.Philos Trans R Soc Lond B
Biol Sci1996,29:1397–13403.
15. Gathercole SE, Pickering SJ:Working memory deficits in children with low achievements in the national curriculum at 7 years of age.Br J Educ Psychol2000,70(Pt 2):177–94.a.
16. Gathercole SE, Pickering SJ, Ambridge B, Wearing H:The structure of working memory from 4 to 15 years of age.Dev Psychol2004, 40:177–190.
17. National theater network of children and parents:Culture and environment of the children.Tobi print Limited1979, 41–60. in Japanese.
doi:10.1186/1751-0759-8-14
Cite this article as:Terasawaet al.:Comparative survey of go/no-go results to identify the inhibitory control ability change of Japanese children.BioPsychoSocial Medicine20148:14.
Submit your next manuscript to BioMed Central and take full advantage of:
• Convenient online submission
• Thorough peer review
• No space constraints or color figure charges
• Immediate publication on acceptance
• Inclusion in PubMed, CAS, Scopus and Google Scholar
• Research which is freely available for redistribution