R E S E A R C H
Open Access
Enhancing ecological-economic efficiency
of intensive shrimp farm through in-out
nutrient budget and feed conversion ratio
Pasicha Chaikaew
*, Natcha Rugkarn, Varot Pongpipatwattana and Vorapot Kanokkantapong
Abstract
In aquaculture systems, insufficient nutrients impede shrimp growth while excessive amounts of nutrient inputs lead to environmental degradation and unnecessary high investment. A study of in-out nutrient budgets in an intensiveLitopenaeus vannameifarm was conducted in this work to measure the amount of nitrogen (N) and phosphorus (P) input and output from the system. The feed conversion ratio (FCR) was obtained to determine the level of nutrient input performance. Between September and December 2017, monthly water and sediment samples were taken within one crop cycle. Nutrient concentrations in sediment and water increased over 90 days. The total nitrogen concentration in the pond water and effluents were in accordance with wastewater quality control for aquaculture; however, the total phosphorus concentration failed to meet the water quality control from the water input through the end of the crop cycle. The nutrient budget model showed that the input/output contained 107.8 kg N and 178.4 kg P. Most of the N input came from shrimp diets (80%) while most of the P came from fertilizer (57%). Both N (46%) and P (54%) mainly deposited in the sediment as an output process. The FCR of this farm is 2.0. Based on the 1.8 FCR scenario, this farm could reduce 147 kg of feed in total, which accounts for 9.04 kg N and 2.21 kg P reduction. The farmer could save $1027 USD crop−1($1 USD = 32.7 baht), as well as reducing uneaten food at the bottom of the pond. This study offers a simple and straightforward model that can practically reduce environmental impacts and increase the profitability of farms.
Keywords:Nitrogen, Phosphorus, Whiteleg shrimp, Intensive farming, Feed conversion ratio
Introduction
Shrimp farming accounts for one of the fastest growing aquacultures in many countries. Of the global produc-tion of farmed shrimp, up to 80% originates from the Asia-Pacific region [1]. Whiteleg shrimp (Litopenaeus vannamei) have been farmed in this region, with a rapid expansion of shrimp aquaculture occurring mainly due to high profits and high demand for fresh and frozen seafood in domestic and international markets. In re-sponse to growing demand, intensive shrimp farms have been implemented to increase mass productivity. Inten-sive shrimp production has produced significant short-term profits for small-scale entrepreneurs; however, many shrimp farming practices have driven towards sub-stantial financial and environmental risks and long-term
sustainability [2]. Inadequate farming management and improper feeding strategies can lead to adverse impacts on aquatic ecosystems and the farmed shrimp’s health. Since natural food production is limited in intensive farming, farmers depend on commercial feeds [3]. Shrimp farmers are usually forced to feed their shrimp on a targeted growth response in a preset culture period [4]. This practice consequently results in over-feeding and causes water pollution. The high nutrient concen-tration of effluents from shrimp farms has raised envir-onmental pollution concerns in many countries and has caused considerable financial losses to entrepreneurs.
The major ingredients of feeds for optimal shrimp growth are nitrogen (N) and phosphorus (P). Nitrogen is mixed in shrimp feeds in various protein levels whilst P is involved in energy producing cellular reactions. Des-pite the nutrition necessity, uneaten food, excrement and organic matter can be released as the sources of
© The Author(s). 2019Open AccessThis article is distributed under the terms of the Creative Commons Attribution 4.0 International License (http://creativecommons.org/licenses/by/4.0/), which permits unrestricted use, distribution, and reproduction in any medium, provided you give appropriate credit to the original author(s) and the source, provide a link to the Creative Commons license, and indicate if changes were made. The Creative Commons Public Domain Dedication waiver (http://creativecommons.org/publicdomain/zero/1.0/) applies to the data made available in this article, unless otherwise stated.
* Correspondence:[email protected]
excess nutrients during water exchanges. Only 21–24% of N and 10–13% of P from the feed input were incorpo-rated into shrimp bodies, while the remaining contents were retained in the sediments and then discharged to the nearby area [5, 6]. The direct impacts of overused feeds result in high feed conversion ratios (FCRs) –the simplest form of conversion feed used for animal meat. In many cases, FCRs have been applied as a proxy indi-cator to measure aquaculture production efficiency and to indicate economic and environmental performance [7,
8]. The result can provide a good indication of how effi-cient an existing feeding strategy is and how much the management can be improved.
To counter nutrient surpluses or deficits, an under-standing of the nutrient inputs and outputs from the shrimp culture system is crucial. A nutrient budget model is the key to track which nutrients are in which part of the system and the environment under time and space constraints. This study is organized with three main objectives: 1) determine the nutrient balance in a small-scale intensive shrimp pond; 2) perform explicitly spatio-temporal aspects of nutrient concentrations across the shrimp pond; and 3) explore the current po-tential for improving economic efficiency. Such analysis can provide directions to farmers with similar framing practices, as well as supporting policy formulation on shrimp production efficiency management.
Materials and methods Study area
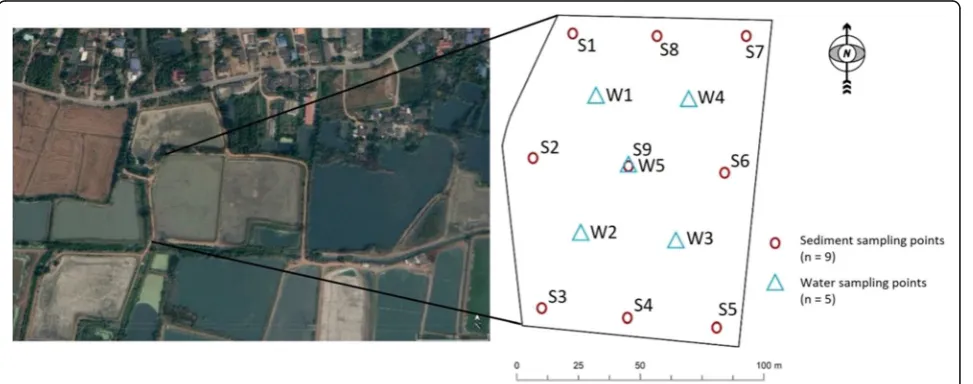
The study area is located in Nakhon Pathom Province, in the central region of Thailand, coordinates 13°47′ 28.5″N, 100°7′21.9″E. This region is classified as trop-ical and has an annual rainfall of 1000–1500 mm. The pond is approximately 130 × 90 m in size and has a
volume of 21,880 m3. The shrimp farm lies on flat ter-rain. The surrounding areas are rural fragmentations that are primarily agricultural and aquaculture lands.
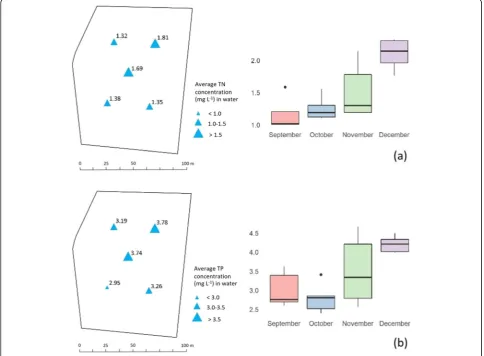
The systematic grid sampling design was employed to ensure that sediment and water samples adequately repre-sented the population. Distributive locations of five water samples and nine sediment samples are shown in Fig.1.
Shrimp farming characterization and management Common practices to culture white shrimp for this farm are based on farmer knowledge and observation. The pond was equipped with four 27 kW electric motors and 60 paddle wheel aerators to avoid a low dissolved oxygen (DO) con-centration. These aerators were operated two times a day from 12 am to 9 am and from 4 pm to 6 pm. During pond preparation, the pond bottom was allowed to dry for a period of three weeks between crop cycles. The bottom dry-ing process enhanced the microbial decomposition of or-ganic matter [9]. After that, water from the nearby canal was pumped into the shrimp pond (~18,234 m3) for the cultur-ing process mixed with 500 L of saline water. The pond water level was maintained at ~1.5 m throughout the culture period, but no water exchange occurred during farming. After harvesting, water from the pond was pumped and drained to the adjacent canal flowed into the Tha Chin River and merged with other major rivers to the Gulf of Thailand.
The pond was stocked with 150,000 post-larval shrimp (PL15). The feeding frequency was twice a day for small post larvae (1–15 d), which slowly increased to three times a day when they grew larger. Whiteleg shrimp,L. vannamei, were cultured for 90 d between September and December 2017.
Water samples and preparation
Water samples were taken on four time scales throughout the production cycle: once during the pond preparation
(input) in September; twice during the shrimp growing stage in October and November; and once before harvest-ing (output) in December. Four water samples were col-lected at 50 cm below the water surface using a bottle sampler. The measured water quality parameters were sal-inity, DO, electrical conductivity (EC), total dissolved solids (TDS) (Hach, sensION™+ MM156, USA), pH and temperature. The preservation of water was achieved by adding sulfuric acid to lower the pH to < 2. The samples were filled in polyethylene bottles and placed in a cooler below 4 °C. The samples were transported to the Depart-ment of EnvironDepart-mental Science Laboratory, Chulalong-korn University, immediately after sampling.
Due to the limitation of rain gauge data, rainfall was collected by farm staff in the area nearby the shrimp pond using a clean water bottle, then brought to the laboratory. The amount of rainfall data was collected through the nearest meteorological station in the same district. The aggregated precipitation data for four months were used to calculate the N content in rainfall.
Sediment samples and preparation
Nine surface sediment samples were taken across the pond on four timescales: once during the pond prepar-ation using the soil core, twice during shrimp culturing using an Ekman grab sampler and once again before har-vesting using the Ekman grab sampler. The salinity, EC, pH and temperature were determined on site. The sam-ples were kept in polyethylene bags and placed in a cool-ing box kept at below 4 °C. Freeze-drycool-ing of the sediment was performed prior to further analysis of total phos-phorus (TP). The sediment was grounded and mixed homogeneously, then sieved through a 0.5 mm mesh.
Sediment, water and shrimp laboratory analyses
Three forms of N components from pond water, rainfall and sediment were analyzed. For sediment samples, the solution was separated from sediment particle through a filter paper (Whatman No. 2). Water sample analyses were performed using the following methods: total Kheldahl ni-trogen (TKN), EPA Method 351.1; nitrate (NO3+), nitrite (NO2−), EPA Method 352.2 (United States Environmental Protection Agency [10]); TP, Standard Method 5310B (American Public Health Association [11]).
The total organic matter (OM) was analyzed by a Walk-ley Black modified acid-dichromate digestion, FeSO4 titra-tion method [12].
Shrimp were randomly captured using a net one day before harvesting. The fresh shrimp samples were kept in zipped lock bags inside a cooler filled with ice. Fifteen shrimp were weighed on a scale and grinded to a single composition. The methods used for the determination of N and P contents in shrimp were as same as for the sediment analysis procedure.
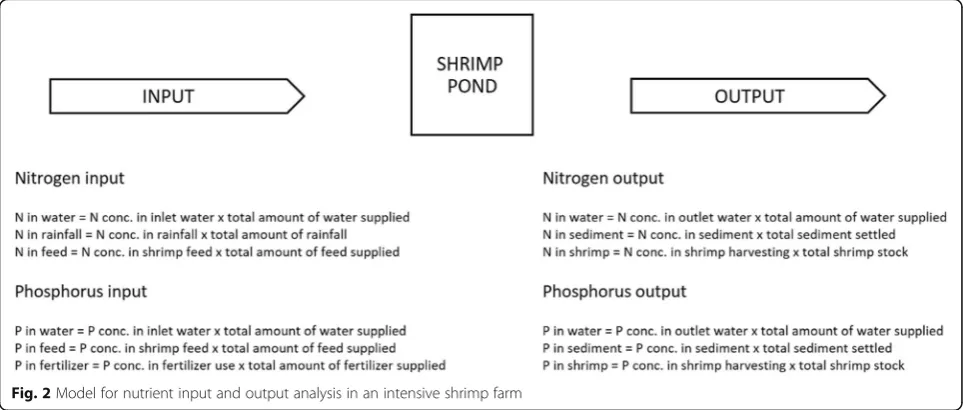
In-out nutrient budget calculation
The N and P budgets were calculated by subtracting nu-trient outputs from inputs. A simple model for nunu-trient input and output analysis is shown in Fig.2.
Statistical analysis
Descriptive statistics, including maximum, minimum, mean, and standard deviation, were employed to explain the characteristics of physical and chemical properties of water and sediment. A paired-t test was applied to com-pare the mean concentrations of nutrients before oper-ation and after harvest in water and sediment samples. Three replicate measurements were determined for each water and sediment sample. Statistical analyses and
graphics were generated using R 3.5.2 computing envir-onment. Spatial distributions of were generated using ArcMap 10.6 software.
Environmental-economy efficiency
FCR values vary with the production system and the type of feed used. According to the Food and Agricul-ture Organization of the United Nations, FCRs of 1.4– 1.8 are generally obtained from intensive whiteleg shrimp farming [13]. FCRs as low as 1.2 can be achieved when applying a superior quality of feed, yet many shrimp farmers experience FCRs of higher than 2.2 [14].
This study evaluated environmental-economic effi-ciency using the FCR concept. The FCR was calculated by the ratio between the input of the feed applied and the weight gain of the shrimp population. We used the upper FCR of 1.8 suggested by FAO to compare with the existing efficient management.
Results and discussion
Pond water and sediment quality parameters
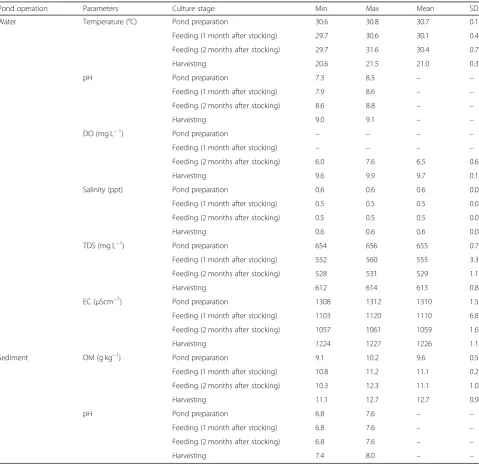
The descriptive statistics of temperature, pH, DO, salin-ity, TDS, EC and OM are presented in Table 1. The water was suitable for shrimp farming, as recommended by the Department of Fisheries. The pH of the water
Table 1Basic characteristics of pond water and sediment quality during an intensive whiteleg shrimp culture cycle
Pond operation Parameters Culture stage Min Max Mean SD
Water Temperature (°C) Pond preparation 30.6 30.8 30.7 0.1
Feeding (1 month after stocking) 29.7 30.6 30.1 0.4
Feeding (2 months after stocking) 29.7 31.6 30.4 0.7
Harvesting 20.6 21.5 21.0 0.3
pH Pond preparation 7.3 8.5 – –
Feeding (1 month after stocking) 7.9 8.6 – –
Feeding (2 months after stocking) 8.6 8.8 – –
Harvesting 9.0 9.1 – –
DO (mg L−1) Pond preparation – – – –
Feeding (1 month after stocking) – – – –
Feeding (2 months after stocking) 6.0 7.6 6.5 0.6
Harvesting 9.6 9.9 9.7 0.1
Salinity (ppt) Pond preparation 0.6 0.6 0.6 0.0
Feeding (1 month after stocking) 0.5 0.5 0.5 0.0
Feeding (2 months after stocking) 0.5 0.5 0.5 0.0
Harvesting 0.6 0.6 0.6 0.0
TDS (mg L−1) Pond preparation 654 656 655 0.7
Feeding (1 month after stocking) 552 560 555 3.3
Feeding (2 months after stocking) 528 531 529 1.1
Harvesting 612 614 613 0.8
EC (μScm−1) Pond preparation 1308 1312 1310 1.5
Feeding (1 month after stocking) 1103 1120 1110 6.8
Feeding (2 months after stocking) 1057 1061 1059 1.6
Harvesting 1224 1227 1226 1.1
Sediment OM (g kg−1) Pond preparation 9.1 10.2 9.6 0.5
Feeding (1 month after stocking) 10.8 11.2 11.1 0.2
Feeding (2 months after stocking) 10.3 12.3 11.1 1.0
Harvesting 11.1 12.7 12.7 0.9
pH Pond preparation 6.8 7.6 – –
Feeding (1 month after stocking) 6.8 7.6 – –
Feeding (2 months after stocking) 6.8 7.6 – –
was moderately alkaline, resulting from lime additions during pond preparation. The values of the water salinity ranged from 0.5–0.6 ppt, considering as fresh water (0– 0.5 ppt) or slightly brackish water (0.5–30 ppt) [15]. The farm owner added 500 L of saline water, which contrib-uted a minimal amount of salt compared to the water vol-ume in the pond. TheL. vannameican be found in a wide range of salinities, from as low as 0.5 ppt to ocean-like water at 45 ppt, but they grow well at the range of 10–15 ppt [16]. The salinity, EC and TDS were related. The TDS range was 528–656 mg L−1and the EC range was 1057– 1312 μS cm−1. Salinity and TDS were estimates of the level of salt in water and were derived from the EC read-ing usread-ing a conversion factor of 0.5. This water condition measured in this study was similar to the whiteleg shrimp culture in Mexico where they used groundwater as a main source. The major chemical properties included a pH of 7.69, TDS of 650 mg L−1 and EC of 1074μS cm−1[17]. Overall, despite the relatively low salinity, the water qual-ity in this study was in a range for growingL. vannamei.
The average values of OM and pH in the sediment in-creased with time. The input of OM came from the food and fertilizer applied to the pond. The pond was in closed condition with no water exchange, and hence OM kept accumulating within the pond over time. How-ever, sediments in this study contained a much lower OM content (12.7 ± 0.9 g kg−1) than OM found in small-scale white shrimp farms (75.2 ± 38.7 g kg−1) in southern Thailand [18]. In addition to the low OM content, the pH in sediments showed lower values when compared to the measured pH in water throughout the culture period. This can be explained by the experimental pro-cedure using a 1:1 sediment to solution ratio in deion-ized water that formed a weak basic solution.
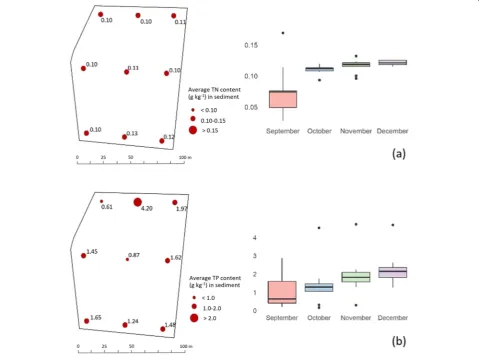
The TN and TP in the sediment increased overtime (Fig.3). The average TN input in sediment significantly (p= 0.01) rose from 0.75 ± 0.04 mg g−1in September to 1.21 ± 0.00 g kg−1in December. Similar to TN, TP also exhibited the same trend. The average TP increased from 0.99 ± 0.88 mg g−1in Septem-ber to 2.31 ± 0.98 mg g−1in December (p< 0.0001).
Overall, the TN concentration throughout the shrimp cycle was under the quality control regulation. Although there was a statistically significant increase in the aver-age TN input in water from 1.08 ± 0.24 mg L−1in Sep-tember to 2.10 ± 0.24 mg L−1 in December (p= 0.0003) (Fig. 4), the average water outlet concentration did not exceed the Thai Freshwater and Brackish Water Quality Control Standards for Aquaculture (≤ 4.0 mg L−1) [19]; however, significant N loading can be experienced dur-ing harvestdur-ing when the pond is emptied, and the nutri-ent concnutri-entrations are likely to be at their highest [20].
In contrast,≤0.5 and≤0.4 mg L−1are the maximum TP limits for freshwater aquaculture and brackish aquaculture wastewater [19]. Our results indicated that the phosphorus content was already high from the received water with mean values of 3.01 ± 0.46 mg L−1and increased to 4.21 ± 0.21 mg L−1 (p= 0.001) (Fig. 4). This system is clearly in a ‘ phos-phorus enrichment’condition. In addition to the high P in-put, abundant fertilizer was added during shrimp molting to accelerate the increment of TP in the pond. Seasonal
synchrony with shrimp molting stage was one of the reasons the farmer added extra P fertilizer. Crustacean molts are often coupled with seasonal synchrony, such as the lunar, semi-lunar and tidal cycles. The synchrony has been reported in several studies [21,22]. In this molting stage, shrimp need to leave the old exoskeleton and build a larger one, therefore it is important to ensure that sufficient calcium and phos-phorus are provided to support the new shell form. For this intensive shrimp farming pond, the feeding activity increased according to the lunar phase. The farm owner added supple-mentary superphosphate (20% P) fertilizer into the pond bi-monthly. This can be beneficial because increased primary production can lead to increased shrimp biomass. The downside was that over nutrient enrichment drives excessive primary productivity in natural waterways. Fertilizer applica-tion was thus the major concern for this particular farming.
Feed utilization
Feed was one of the important inputs in shrimp produc-tion and played a significant role in the costs of this
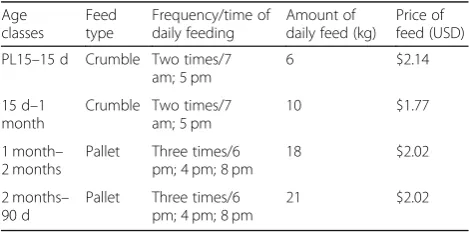
shrimp farm. Four different types of artificial feed pellets varying in size were used for the different age classes (Table2). On a regular basis, feeds were applied twice a day in the first 30 days and increased to three times a day from 31 to 90 d.
Protein is the most important nutrient that contributes a large percentage in shrimp feed. There was a limitation of nutrient component information from diets, the calcu-lation of TP and TN was thus a proxy estimation based on the nutrient mixture and the amount of feed application. The TN is ~0.16 g or 0.16% of protein [23]. Commercial feeds for aquatic animals contained ~1.5–2.5% P [24] and the optimum TP content in shrimp diets was 1–15% P. This TP amount is sufficient for shrimp to gain more weight and have more ability to convert the eaten feed into flesh [25]. This study adopted the P composition in shrimp feed at 1.5% P. The labeled percentage of protein on the feed bag with the amount of feed was converted to the amount of TN and TP use in the system (Table 3). The amount of superphosphate use was accounted for as 102.34–204.68 kg P.
Nutrient budget and FCR
The TN input represented the sum of N in inlet water (NinputW), in rainfall (NinputR) and in feed (NinputF). All these accounted for 107.8 kg, divided into 19.6% for NinputW, 0.1% for NinputR and 80.3% for NinputF. In contrast, the TP in the systems was 178.4 kg. Fertilizer (PinputFR) was the major path of P input, contributing 57.4% of TP inputs. Inlet water (PinputW) brought on 30.8%, while feeds (PinputF) showed the least contribu-tion among P inputs, 11.9% (Fig.5).
The sum of N output was estimated at ~107.8 kg, repre-senting 35.5% effluents (NoutputW), 17.0% shrimp harvest (NoutputH) and 46.4% accumulation in sediment (Nout-putS). The remaining portion of 1.2% was unaccounted and assumed to be loss to the atmosphere by bacterial de-nitrification. The TP output was 178.4 kg. This amount was broken down to 53.5% sediment accumulation (Pout-putS), 43.1% effluents (PoutputW), 0.7% in shrimp stocks (PoutputH) and 2.8% unaccounted P (Fig.5).
Most of the nutrient input came from feed and fertilizer as shrimp require protein for growth. When these inputs were high and nutrients were only partly consumed by shrimp, the remainder accumulated in sediment at the bottom of the pond or was suspended in the water. In addition, multiple crops around the year can also raise high nutrient pile-up through the sedi-ment aggregation.
In comparison to theL. vannameismall-scale farms in the southern region of Thailand, coastal shrimp farms used refilled water in culturing and produced 22.0 kg TKN t−1production [18], while sediment accumulation in this study generated ~71.4 kg TKN t−1production or in-creased three-fold compared to their study. Our study showed that for the TN input, 17.0% was recovered in the 700 kg of shrimp biomass harvested from the pond. This number possessed comparatively low N utilization when compared to intensive shrimp farms in the Gulf of Califor-nia Ecoregion, where 52% was recovered in 2000 kg of shrimp biomass [26]. Similar to this study, the Penaeus monodonpond in India operated with no water exchange. The harvest of shrimp accounted for recovery of 10.1– 12.9% P, with feed alone accounting for 91.2–95.4% P. Phosphorus accumulation in sediment was 64.1%, efflu-ents contributed 2.9% and uncounted P shared 21.8% [27]. Clearly, pond bottom conditions are critical for shrimp compared to other aquaculture species and they need to be seriously managed because shrimp spend most of their lifetimes at the bottom of ponds.
The FCR was estimated to determine the performance of feed and production from stocking to harvest. It was calculated by total weight of total feed consumed (kg) di-vided by the total yield. FCR was 1410 kg feed per 700 kg production = 2.0. It implied that 2.0 kg of feed is needed to produce 1 kg of shrimp body live weight. The feeding fre-quency can have effects on the FCR, as reported in Aali-mahmoudi et al. [28]. The FCR values for L. vannamei
were 2.6 ± 0.1 and 2.6 ± 0.1 when the feeding frequencies were two and four times a day, respectively. However, the FCR declined to 1.8 ± 0.0 when diets were given six times a day. In addition, the relatively high FCR may be due to a temperature drop to below 25 °C that could decrease the
Table 2Feed and feeding schedule during shrimp culture period of 90 days
Age classes Feed type Frequency/time of daily feeding Amount of daily feed (kg)
Price of feed (USD)
PL15–15 d Crumble Two times/7 am; 5 pm
6 $2.14
15 d–1 month
Crumble Two times/7 am; 5 pm
10 $1.77
1 month– 2 months
Pallet Three times/6 pm; 4 pm; 8 pm
18 $2.02
2 months– 90 d
Pallet Three times/6 pm; 4 pm; 8 pm
21 $2.02
$1 USD32.7 baht (as of December 2017)
Table 3Amount of TN and TP in the feeds
Age classes Amount of feed (kg) % protein Amount of protein (kg) Amount of TN (kg)
Amount of TP (kg)
PL15–15 d 90 40 36 5.76 1.35
15 d–1 month
150 40 60 9.60 2.25
1 month– 2 months
540 38 205.2 32.83 8.10
2 months– 90 d
630 38 239.4 38.30 9.45
feed consumption and growth rate [29]. The low temperature in the pond at the end of the cycle in our study (21 °C) was possibly responsible for a slow growth rate of shrimp as they reduced consumption. In a well-managed system, FCR can be reduced to 1.3 to 1.5; how-ever, in poorly managed condition, FCR can be as high as 2.5 [30]. On the average shrimp farm, the FCR ratios of 1.6–1.8 were reported across 174 black tiger shrimp farms in Thailand [31].
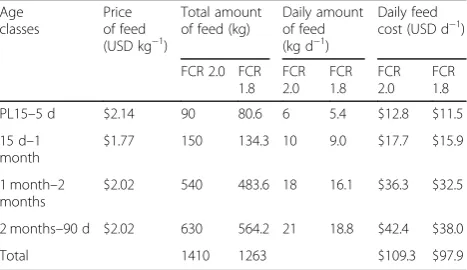
Feed is one of the highest variable costs of shrimp farming [32]. In addition to lowering feeding costs and maintaining shrimp growth, diminishing the FCR lessens the nutrient load per unit of production and reduces the oxygen demand, as well as cutting down the potential for eutrophication and acidification [7]. To estimate the optimum feed strategy, daily feed inputs were calculated upon an expected FCR of 1.8. The expected total amount of feed should be ~1263 kg so that the farm owner can save up to $11.4 USD d−1 of feed cost or $1027 USD crop−1. In the case where three crops are operated per year, the owner can save $3081 USD yr−1 for the feed. The amount of nutrients is anticipated to reduce from 86.5 to 77.5 kg for N and from 21.2 to 19.0 kg for P use in the pond system. Due to the limitation of fertilizer data, fertilizer was not taken into this calcula-tion. Phosphorus is expected to decline with more economical efficiency when well-planned fertilizer man-agement is cooperated in real practices. Table 4 illus-trates feed inputs and cost calculation based on an expected FCRs of 2.0 and 1.8.
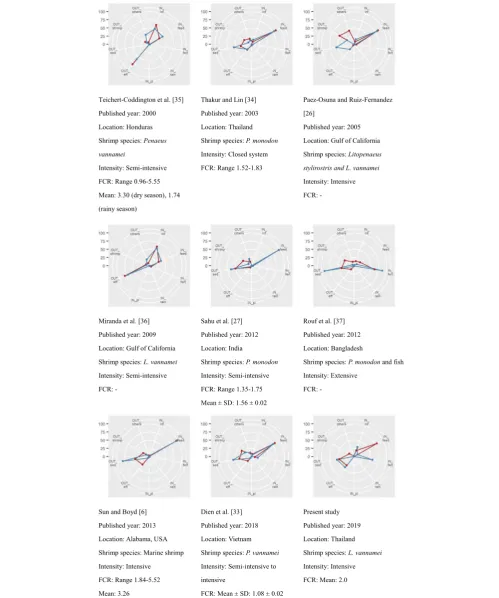
According to nine different studies, including this one, despite a variety of species, location, and intensity, the ma-jority of N input came from feed with a value of more than 80% [6,26,27,33,34]. This is while water influent was the main N input budget investigated in Teichert-Coddington et al. (62.9%) and Miranda et al. (62.7%) [35, 36] where
semi-intensive farming system was operated. This high N inlet may be due to the water exchange between pond sys-tem and natural water. In an extensive farming scheme, fertilizer was the highest N contributor, with a value of 63.4% [37]. The results reflected farm management that depended on natural food and were enhanced with chem-ical fertilizer. The authors additionally claimed that semi-intensive and semi-intensive culture systems caused excessive nutrient discharge when compared to extensive shrimp culture. Among all studies in Table 5, Paez-Osuna and Ruiz-Fernandez [26], Teichert-Coddington et al. [35], and Miranda et al. [36] missed revealing N accumulation in the sediment but showed that N output was discharged to the environment about 80%. The other six studies agreed that sediment accumulation is the main N output in the pond system, from 34% in a closed system [33] to as high as 50.3% [27] in semi-intensive scheme. Interestingly, while all studies found that only < 35% of consumed N is retained in shrimp, Paez-Osuna and Ruiz-Fernandez reported that 52% N was recovered in shrimp body. There were two potential losses of N via denitrification and ammonia volatilization
Fig. 5Nutrient budget in an intensive whiteleg shrimp farm
Table 4Feed inputs and cost calculation based on FCRs of 2.01 and 1.80
Age classes
Price of feed (USD kg−1)
Total amount of feed (kg)
Daily amount of feed (kg d−1)
Daily feed cost (USD d−1)
FCR 2.0 FCR 1.8
FCR 2.0
FCR 1.8
FCR 2.0
FCR 1.8
PL15–5 d $2.14 90 80.6 6 5.4 $12.8 $11.5
15 d–1 month
$1.77 150 134.3 10 9.0 $17.7 $15.9
1 month–2 months
$2.02 540 483.6 18 16.1 $36.3 $32.5
2 months–90 d $2.02 630 564.2 21 18.8 $42.4 $38.0
classified into the other category and often not measured directly.
Similar to N input, added feeds were the main P con-tributor in the grow-out shrimp pond, as shown in five studies [6, 26, 27, 33, 34]. Water intake was leading among P inputs in the Teichert-Coddington et al. and Miranda et al. studies on semi-intensive culture pond [35, 36]. The contrary tendency was observed between extensive system [37] and intensive system from this study. The major P inputs originated from fertilizer, with high percentage P loads of 87.7 and 57.4%, respectively. Excessive use of fertilizers is a caution of this study as compared to other intensive farming conditions. Water effluents released P to the surrounding water 60.2% and up to 71.5% in Teichert-Coddington et al. and Miranda et al. [35, 36] while the other studies [6,26, 27, 33, 34] including this study reported that more than 50% of P was trapped in the sediment and can be as high as 92% in the extensive cultured pond. P was removed as har-vested shrimp lower than N in all comparative studies. The highest P removal of shrimp harvest was 25% [26], and the lowest level was 0.7%, as shown in this study.
It is observed that nutrient use, N and P loads, and FCR varied among farms across location, management technique, and species. In extensive and semi-intensive aquacultural farming, a greater contribution of N and P inputs was from non-feed sources, either from water in-lets or added fertilizers. In terms of FCR, low FCR values found in previous studies can be ascribed by various rea-sons, such as the strict control of feeding in closed sys-tem [33], seasonal variation [35], and shorter period for reaching harvest size [34]. On the contrary, Limsuwan [38] listed five common mistakes that lead to the high FCR: usual high water temperature, overfeeding, over frequent feeding, fast water current from aerators, and insufficient aeration. Many studies have calculated FCR to perform feed utilization efficiency, but most failed to recalculate the magnitude in the sense of how much farm owners could save from adjusting to lower FCR. This study, though on small scale farming, demonstrated that setting a FCR goal with monetary projection could motivate positive practices to a sustainable way.
Conclusions
At a small-scale farm level, the quality parameters of both water and sediment were within optimum ranges for shrimp culture. Although nutrient concentrations in water were under water quality standard from aquaculture, at this con-centrated level, it could accelerate plant growth and create water pollution in nearby areas. The findings from this study increase awareness of nutrient application in an intensiveL. vannameifarming pond. The four-fifths N input found in the pond mainly came from shrimp feeds, while the largest amount of N output was accumulation in the sediment. Of
the P inputs, fertilizer was the lead contributor with 57.4% in the pond, followed by inlet water and feed. From the out-put path, the shrimp product recovered the smallest part of P, whereas the bottom pond was the largest sink for P accu-mulation. The effluents contained more nutrients than inlet water, indicating that there were abundant nutrients that had not been used. A high FCR of 2.0 indicates that this farm requires better feed management strategy. The ex-pected FCR of 1.8 could cut down 9.04 kg N and 2.21 kg P in the aquaculture system in one crop. With this feasible FCR, the farm owner can save investment costs on feed up to $1027 USD crop−1due to 147 kg feed reduction. There is considerable potential to improve the economic and envir-onmental performance of intensive L. vannamei farming. The development of such a system will contribute to redu-cing the environmental impacts from shrimp, improving the profitability of the farm and allowing it to become part of a sustainable shrimp industry.
Additional file
Additional file 1.Measurement of nitrogen and phosphorus in water and sediment obtained from four time scales throughout the production cycle.
Acknowledgements
We thank Mr. Somchai Jiamjiroch, the farm owner, for offering his farm as a study area. This research received funding from the National Science and Technology Development Agency (NSTDA), grant number FDA-00-2561-6271-TH. The laboratory activities were supported by the Department of En-vironmental Science, Faculty of Science, Chulalongkorn University.
Authors’contributions
We wish to confirm that the manuscript has been read and approved by all named authors and that there are no other persons who satisfied the criteria for authorship but are not listed. Four authors have made contributions to the paper as follows: Author 1: PC. Devised the project and the main conceptual ideas; collected sample; analyzed the data; wrote the manuscript with input from all authors; designed the figures. Author 2: NR. Nitrogen section–Collected samples; performed the laboratory experiments; analyzed the data; verified the numerical results; drafted the output results. Author 3: VP. Phosphorus section–Collected samples; performed the laboratory experiments; analyzed the data; verified the numerical results; drafted the output results. Author 4: VK. Designed and directed the project; developed the theoretical framework; aided in interpreting the results.
Funding
The only source of funding is from the National Science and Technology Development Agency (NSTDA), grant number FDA-00-2561-6271-TH. This grant supports data collection, laboratory analysis, data analysis and inter-pretation, and manuscript submission.
Availability of data and materials
We declare that all datasets supporting the findings of this study are available within the manuscript, under Additional file1.
Competing interests
Received: 1 July 2019 Accepted: 12 September 2019
References
1. FAO. GLOBEFISH Highlights. Rome: Food and Agriculture Organization of the United Nations; 2018.
2. Szuster BW, Flaherty M. Cumulative environmental effects of low salinity shrimp farming in Thailand. Impact Assess Proj A. 2002;20:189–200. 3. Thongrak S, Prato T, Chiayvareesajja S, Kurtz W. Economic and water quality
evaluation of intensive shrimp production systems in Thailand. Agric Syst. 1997;53:121–41.
4. Tacon AGJ, Jory DE, Nunes AJP. Shrimp feed management: issues and perspectives. In: Hasan MR, New MB, editors. On-farm feeding and feed management in aquaculture. Rome: Food and Agriculture Organization; 2013. p. 481–8.
5. Briggs MRP, Funge-Smith SJ. A nutrient budget of some intensive marine shrimp ponds in Thailand. Aquac Res. 1994;25:789–811.
6. Sun W, Boyd CE. Phosphorus and nitrogen budgets for inland, saline water shrimp ponds in Alabama. Fish Aquacult J. 2013;4:1–5.
7. Boyd CE, McNevin AA, Racine P, Tinh HQ, Minh HN, Viriyatum R, et al. Resource use assessment of shrimp,Litopenaeus vannameiandPenaeus monodon, production in Thailand and Vietnam. J World Aquacult Soc. 2017;48:201–26.
8. Chatvijitkul S, Boyd CE, Davis DA, McNevin AA. Embodied resources in fish and shrimp feeds. J World Aquacult Soc. 2017;48:7–19.
9. Boyd CE, Teichert-Coddington D. Pond bottom soil respiration during fallow and culture periods in heavily-fertilized tropical fish ponds. J World Aquacult Soc. 1994;25:417–23.
10. US EPA. Methods and guidance for analysis of water, version 2.0. Washington, DC: US Environmental Protection Agency; 1999. 11. APHA. Standard methods for the examination of waste and wastewater.
20th ed. Washington, DC: American Public Health Association; 1998. 12. Walkley A. A critical examination of a rapid method for determining organic
carbon in soils - effect of variations in digestion conditions and of inorganic soil constituents. Soil Sci. 1947;63:251–64.
13. Briggs M. Cultured aquatic species information programme.Penaeus vannamei
(Boone, 1931). Rome: FAO Fisheries and Aquaculture Department; 2006. 14. ASEAN. Manual of ASEAN good shrimp farm management practice. Jakarta:
Association of Southeast Asian Nations; 1998.
15. Levinton JS. Marine biology: function, biodiversity, ecology. 1st ed. New York: Oxford University Press; 1995.
16. Briggs M, Funge-Smith S, Subasinghe R, Phillips M. Introductions and movement ofPenaeus vannameiandPenaeus stylirostrisin Asia and the Pacific. Bangkok: Food and Agriculture Organization; 2004.
17. Mariscal-Lagarda MM, Esquer-Mendez JL, Paez-Osuna F. Shrimp study uses low-salinity groundwater in Sonora, Mexico. Portsmouth: Global Aquaculture Alliance; 2010.
18. Na nakorn A, Chevakidagarn P, Danteravanich S. Environmental impact of white shrimp culture during 2012–2013 at Bandon Bay, Surat Thani Province: a case study investigating farm size. Agric Nat Resour. 2017;51:109–16.
19. PCD. Thai Freshwater and Brackish Water Quality Control Standards for Aquaculture. Bangkok: Pollution Control Department; 2004.http://www.pcd. go.th/info_serv/reg_std_water04.html#s12[in Thai].
20. Dierberg FE, Kiattisimkul W. Issues, impacts, and implications of shrimp aquaculture in Thailand. Environ Manag. 1996;20:649–66.
21. Franke R, Hoerstgen-Schwark G. Lunar-rhythmic molting in laboratory populations of the noble crayfishAstacus astacus(Crustacea, Astacidea): an experimental analysis. PLoS One. 2013;8:1–11.
22. Rusaini OL. Effect of moulting and lunar rhythms on the lymphoid organ spheroid (LOS) cells of the black tiger prawn (Penaeus monodon). J Exp Mar Biol Ecol. 2010;389:6–12.
23. Jones DB. Factors for converting percentages of nitrogen in foods and feeds into percentages of proteins. US Dept Agric Circular. 1931;183:1–22. 24. Penaflorida VD. Interaction between dietary levels of calcium and phosphorus on
growth of juvenile shrimp,Penaeus monodon. Aquaculture. 1999;172:281–9. 25. Ambasankar K, Ahamad Ali S, Syama DJ. Effect of dietary phosphorus on
growth and its excretion in tiger shrimp,Penaeus monodon. Asian Fish Sci. 2006;19:21–6.
26. Paez-Osuna F, Ruiz-Fernandez AC. Environmental load of nitrogen and phosphorus from extensive, semiintensive, and intensive shrimp farms in the Gulf of California ecoregion. B Environ Contam Tox. 2005;74:681–8.
27. Sahu BC, Adhikari S, Dey L. Carbon, nitrogen and phosphorus budget in shrimp (Penaeus monodon) culture ponds in eastern India. Aquacult Int. 2013;21:453–66.
28. Aalimahmoudi M, Reyshahri A, Bavarsad SS, Maniat M. Effects of feeding frequency on growth, feed conversion ratio, survival rate and water quality of white leg shrimp(Litopenaeus vannamei, Boone, 1931). Int J Fish Aquat Stud. 2016;4:293–7.
29. Hasan BMA, Guha B, Datta S. Optimization of feeding efficiency for cost effective production ofPenaeus monodonfabricius in semi-intensive pond culture system. J Aquac Res Dev. 2012;3:1–7.
30. Hung LT, Huy HPV. Analysis of feeds and fertilizers for sustainable aquaculture development in Viet Nam. In: Hasan MR, Hecht T, De Silva SS, Tacon AGJ, editors. Study and analysis of feeds and fertilizers for sustainable aquaculture development. Rome: Food and Agriculture Organization; 2007. p. 331–61.
31. Tacon AGT. Feed formulation and on-farm feed management. In: New MB, AGT T, Csavas I, editors. Farm-made aquafeeds. In: the FAO/ AADCP Regional Expert Consultation on Farm-Made Aquafeeds. Bangkok; 1993 Dec. 14–8.
32. Beseres JJ, Lawrence AL, Feller RJ. Variation in fiber, protein, and lipid content of shrimp feed - effects on gut passage times measured in the field. J Shellfish Res. 2005;24:301–8.
33. Dien LD, Hiep LH, Hao NV, Sammut J, Burford MA. Comparing nutrient budgets in integrated rice-shrimp ponds and shrimp grow-out ponds. Aquaculture. 2018;484:250–8.
34. Thakur DP, Lin CK. Water quality and nutrient budget in closed shrimp (Penaeus monodon) culture systems. Aquac Eng. 2003;27:159–76. 35. Teichert-Coddington DR, Martinez D, Ramirez E. Partial nutrient budgets for
semi-intensive shrimp farms in Honduras. Aquaculture. 2000;190:139–54. 36. Miranda A, Voltolina D, Frias-Espericueta MG, Izaguirre-Fierro G, Rivas-Vega
ME. Budget and discharges of nutrients to the Gulf of California of a semi-intensive shrimp farm (NW Mexico). Hidrobiológica. 2009;19:43–8. 37. Rouf MA, Islam MMM, Hambrey J, Telfer TC. Nutrient budget of shrimp culture
ponds in southwest coastal region of Bangladesh. J Aquacult Trop. 2012;27:41–51. 38. Limsuwan C. How to prevent high feed conversion ratio in shrimp farming.
J Fish Environ. 2010;34:28–34.
Publisher’s Note