Open Access
Research
Transcriptional effects of CRP* expression in
Escherichia coli
Reza Khankal
1, Jonathan W Chin
1, Debashis Ghosh
2and Patrick C Cirino*
1Address: 1Department of Chemical Engineering, The Pennsylvania State University, University Park, PA 16802, USA and 2Department of Statistics,
The Pennsylvania State University, University Park, PA 16802, USA
Email: Reza Khankal - khankal@engr.psu.edu; Jonathan W Chin - jchin@engr.psu.edu; Debashis Ghosh - ghoshd@psu.edu; Patrick C Cirino* - cirino@engr.psu.edu
* Corresponding author
Abstract
Background: Escherichia coli exhibits diauxic growth in sugar mixtures due to CRP-mediated catabolite repression and inducer exclusion related to phosphotransferase system enzyme activity. Replacement of the native crp gene with a catabolite repression mutant (referred to as crp*) enables co-utilization of glucose and other sugars in E. coli. While previous studies have examined the effects of expressing CRP* mutants on the expression of specific catabolic genes, little is known about the global transcriptional effects of CRP* expression. In this study, we compare the transcriptome of E. coli W3110 (expressing wild-type CRP) to that of mutant strain PC05 (expressing CRP*) in the presence and absence of glucose.
Results: The glucose effect is significantly suppressed in strain PC05 relative to strain W3110. The expression levels of glucose-sensitive genes are generally not altered by glucose to the same extent in strain PCO5 as compared to W3110. Only 23 of the 80 genes showing significant differential expression in the presence of glucose for strain PC05 are present among the 418 genes believed to be directly regulated by CRP. Genes involved in central carbon metabolism (including several TCA cycle genes) and amino acid biosynthesis, as well as genes encoding nutrient transport systems are among those whose transcript levels are most significantly affected by CRP* expression.
We present a detailed transcription analysis and relate these results to phenotypic differences between strains expressing wild-type CRP and CRP*. Notably, CRP* expression in the presence of glucose results in an elevated intracellular NADPH concentration and reduced NADH concentration relative to wild-type CRP. Meanwhile, a more drastic decrease in the NADPH/NADP+ ratio is observed for the case of CRP* expression in strains engineered to reduce xylose to xylitol via a heterologously expressed, NADPH-dependent xylose reductase. Altered expression levels of transhydrogenase and TCA cycle genes, among others, are consistent with these observations.
Conclusion: While the simplest model of CRP*-mediated gene expression assumes insensitivity to glucose (or cAMP), our results show that gene expression in the context of CRP* is very different from that of wild-type in the absence of glucose, and is influenced by the presence of glucose. Most of the transcription changes in response to CRP* expression are difficult to interpret in terms of possible systematic effects on metabolism. Elevated NADPH availability resulting from CRP* expression suggests potential biocatalytic applications of crp* strains that extend beyond relief of catabolite repression.
Published: 24 August 2009
Journal of Biological Engineering 2009, 3:13 doi:10.1186/1754-1611-3-13
Received: 7 May 2009 Accepted: 24 August 2009
This article is available from: http://www.jbioleng.org/content/3/1/13
© 2009 Khankal et al; licensee BioMed Central Ltd.
Background
E. coli growing in a mixture of sugars exhibits diauxic growth characteristics, whereby glucose is preferentially assimilated before other sugars. This is due to CRP-medi-ated catabolite repression and inducer exclusion relCRP-medi-ated to phosphotransferase system enzyme activity. It is well established that cyclic AMP (cAMP) and its receptor pro-tein (CRP) are involved in transcriptional activation of catabolic genes [1,2], but the details of catabolite repres-sion and inducer exclurepres-sion mechanisms and their relation to the levels of cAMP and CRP (also known as CAP) are not clear and have motivated many studies [3-7].
Inducer exclusion is a result of dephosphorylation of
enzyme IIAGlc of PTS [8,9] and catabolite repression is
associated with altered levels of cAMP [10-12] and CRP
[13]. Enzyme IIAGlc, when unphosphorylated, inhibits
activity of other transport systems (non-PTS transporter)
[14-16]. In its phosphorylated form, enzyme IIAGlc
stimu-lates adenylate cyclase activity, resulting in higher intrac-ellular levels of cAMP [17,18] and the cAMP-CRP complex (global transcription activator).
Efforts to study or alleviate catabolite repression mediated by CRP have resulted in a series of CRP mutants isolated from strains lacking adenylate cyclase and having an apparent reduced dependence on cAMP for activating
cat-abolic genes (called CRP*, CRP-in or CAPc) [1,19,20].
Genetically different crp* strains reported are also
pheno-typically different, showing different sensitivities to cyclic nucleotides and relieving catabolic repression of select genes examined to different extents [21]. For example, six
different crp* mutants isolated after UV treatment and
selection for a lactose+ phenotype in an adenylate
cyclase-deficient E. coli strain showed a variety of utilization
pat-terns for different sugars (lactose, maltose, arabinose, xylose, ribose, mannose, mannitol) as well as different
levels of activation of the lac operon by cAMP or cGMP
[22]. Similar examples have been reported by others [3,21].
Ability to co-utilize sugars via relief of catabolite repres-sion during microbial production of value-added chemi-cals has potential to improve bioproduction process
economics [23]. We previously engineered E. coli to
pro-duce xylitol from xylose while metabolizing glucose as a source of carbon and energy (xylose metabolism is disa-bled) [24,25]. Expression of CRP* was an effective approach to promote expression of xylose transporters and enhance xylitol production in the presence of glucose. Although plasmid-based, CRP-independent expression of
xylose transporters in wild-type crp strains also enhances
xylose uptake and xylitol production in the presence of glucose [25], the favorable effects of CRP* expression were found to go beyond improving xylose transport and
to include other beneficial phenotypes such as improved xylitol titer in controlled batch fermentation and reduced acetate production and higher yields on xylose reduced per mole of glucose consumed in resting cell transforma-tions [26].
While CRP*s have been studied at the molecular level and the effects of expressing CRP* mutants on the expression of specific catabolic genes have been reported, the global transcriptional effects and regulatory consequences of CRP* expression is not known. Here, we report the results
of comparisons between the transcriptome of E. coli
W3110 (expressing wild-type CRP) and that of mutant strain PC05 (expressing CRP*) in the presence and absence of glucose through microarray analysis. Our results show that gene expression in PC05 is drastically different from that of W3110 in both the presence and absence of glucose, and that while expression of the CRP* allele used in this study has the general effect of suppress-ing transcriptional changes due to glucose, a significant response to glucose nonetheless remains. Results are ana-lyzed in light of the observed differences between wild-type and CRP* strains during xylitol production. We iden-tify many genes showing differential expression that are consistent with the observed elevated levels of glucose oxidation and NADPH-dependent xylose reduction for PC05 compared to W3110. A subsequent intracellular cofactor analysis reveals CRP*-correlated effects on cofac-tor levels that are consistent with the observed expression changes.
Results
The E. coli W3110-derivative CRP* strains used in our
studies are derived from E. coli donor strain ET25 [8],
which expresses a CRP* mutant with three amino acid substitutions (I112L, T127I, and A144T) identical to those found in an earlier characterized CRP* strain CA8404 [1]. Amino acid position 127 lies in the cAMP binding pocket, and T127I or T127L mutations occur fre-quently in CRP* alleles [21,27], presumably serving to reduce the cAMP requirement to form an activating CRP complex [27]. Mutation A144T is also frequently found in different CRP* alleles [3,21,28] and can exhibit the CRP* phenotype to some extent even as the only mutation in the protein [29]. This position lies in the DNA binding domain of CRP and is suggested to improve affinity of the protein for CRP binding sites [29]. A fourth base
substitu-tion in the crp* sequence results in a T28K mutation,
which is the result of native differences in the crp sequence
between W3110 and the donor strain.
Genome-wide transcriptional effects of glucose and CRP*
genes mentioned in this paper. Supplementary Table S1 (see Additional file 1) contains signal values for the
com-plete probe set data for the E. coli K-12 genome.
Transcrip-tome analysis of strain W3110 reveals that 629 genes show significant changes in expression level in response to the presence of glucose (comparison between WT G and WT in Figure 1a). 375 of these genes are upregulated by glucose, as depicted in Figure 1a. The complete list of expression levels of the genes that are differentially expressed between WT G and WT is provided in Supple-mentary Table S2 (see Additional file 2). Catabolic genes, membrane-related components, and sugar transporters (especially non-glucose PTS related enzymes) represent a large portion of genes repressed by glucose. In a study of CRP-dependent gene expression, Gosset and coworkers reported transcriptome analysis of CRP-dependent genes
in another E. coli K-12 strain BW25113 [30]. In Table 3 we
compare their result to results from our study for common conditions tested (i.e., WT G/WT). While their study did not examine CRP*, this comparison provides an indica-tion of the consistency of glucose-responsive gene expres-sion among different but similar strains. Our comparison focuses on genes involved in central metabolism and shows that the genes which are subject to glucose
repres-sion in BW25113 (such as aceA (isocitrate lyase
mono-mer), aldA (aldehyde dehydrogenase A), sdhA (succinate
dehydrogenase) and sucA (oxoglutarate dehydrogenase))
are also downregulated in the presence of glucose for W3110. However, not all the genes which are upregulated in the presence of glucose in BW25113 are upregulated in
W3110 under the same conditions (examples are aceE
(pyruvate dehydrogenase E1 component), guaB (IMP
dehydrogenase), rpsQ (30S ribosomal subunit protein
S17)). This is likely to be due to differences between these two strains [26,31-33] as well as the differences in experi-mental methods.
Figure 1b depicts the changes in expression levels of the same genes shown in Figure 1a for CRP mutant strain PC05 in response to glucose. The average WT G/WT ratio for the genes which are upregulated in W3110 in the
pres-ence of glucose is 4.06 while the average CRP* G/CRP* ratio for the same genes is 1.07. For downregulated genes in W3110 by glucose, WT G/WT and CRP* G/CRP* ratios are 0.32 and 0.81 respectively. These results show that genes whose expression is significantly altered by glucose in strain W3110 are generally not altered to the same extent in strain PCO5 and that CRP* suppresses this effect of glucose.
Figure 2 depicts that fewer genes show significant changes in expression level for strain PC05 (80 genes) compared to W3110 (629 genes) when grown in the presence versus absence of glucose. 29 of these genes are upregulated in the presence of glucose. This confirms the expected role of CRP* in the alleviation of glucose repression. Only 43 genes are common between those of Figure 1 and Figure 2. In contrast to W3110, the number of genes that are repressed in the presence of glucose in PC05 is greater than the number of genes that are upregulated. Only 3% of genes that are upregulated in W3110 in the presence of glucose are also upregulated in PC05 in the same condi-tion, while 12% of glucose-repressed genes in W3110 are also repressed by glucose in PC05.
The complete list of expression levels of the genes that are differentially expressed between in PC05 with versus without glucose is provided in Supplementary Table S3 (see Additional file 3). Specific examples of genes that are upregulated in PC05 in response to glucose include: the
PTS gene ptsG, che genes (involved in regulation of
chem-otaxis), dhaM (associated with dihydroxyacetone kinase),
edd (encoding phosphogluconate dehydratase of the
Entner-Doudoroff pathway), gnt genes (gluconate
trans-port and metabolism), genes involved in amino acid
metabolism such as glt (glutamate synthase), and ser
(ser-ine biosynthesis) genes, and ymf genes of the lambdoid
prophage element e14. Genes that are downregulated in
PC05 in response to glucose include: argD (involved in
lysine and arginine biosynthesis), glp genes (glycerol
transport and metabolism), gntP (encoding a gluconate
transporter), srlA (glucitol/sorbitol PTS system), thiCE
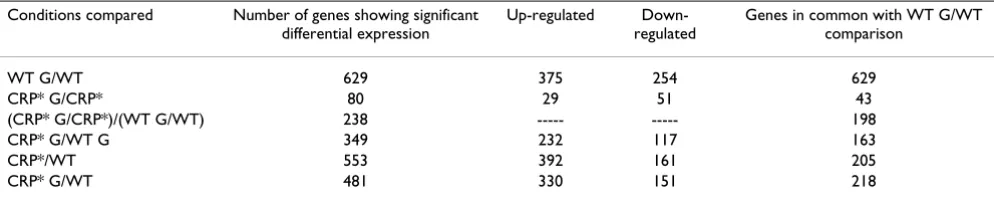
Table 1: Summary of genome-wide effects of CRP* expression.
Conditions compared Number of genes showing significant differential expression
Up-regulated Down-regulated
Genes in common with WT G/WT comparison
WT G/WT 629 375 254 629
CRP* G/CRP* 80 29 51 43
(CRP* G/CRP*)/(WT G/WT) 238 --- --- 198
CRP* G/WT G 349 232 117 163
CRP*/WT 553 392 161 205
CRP* G/WT 481 330 151 218
Table 2: Expression levels for the genes discussed in this paper.
Gene WT G WT CRP* G CRP* WT G/WT CRP* G/CRP* CRP* G/WT G CRP* G/WT
aceA 1806 3171 2584 1980 0.6 1.3 1.4 0.8
aceE 7646 13291 10053 9167 0.6 1.1 1.3 0.8
acs 56 223 203 386 0.3 0.5 3.6 0.9
aldA 370 2471 937 1613 0.2 0.6 2.5 0.4
argD 44 38 73 158 1.1 0.5 1.7 1.9
asnA 594 1741 1409 1880 0.3 0.8 2.4 0.8
cheR 1588 2315 2311 1007 0.7 2.3 1.5 1.0
cheY 5365 6487 5893 2646 0.8 2.2 1.1 0.9
citF 50 25 306 269 2.0 1.1 6.1 12.2
dhaM 8790 1502 10556 3530 5.9 3.0 1.2 7.0
edd 4178 756 3582 980 5.5 3.7 0.9 4.7
fruA 3105 1289 5777 3659 2.4 1.6 1.9 4.5
fruK 3722 1934 6807 3866 1.9 1.8 1.8 3.5
fumA 956 3284 4013 3738 0.3 1.1 4.2 1.2
gapC 1316 581 2345 2383 2.3 1.0 1.8 4.0
gatD 1560 475 6080 7981 3.3 0.8 3.9 12.8
gatR 1776 786 6106 5039 2.3 1.2 3.4 7.8
gcd 491 467 171 67 1.1 2.5 0.4 0.4
glnP 2682 1037 1108 1374 2.6 0.8 0.4 1.1
glpC 564 8563 5595 13130 0.1 0.4 9.9 0.7
glpF 738 12693 2384 10944 0.1 0.2 3.2 0.2
glpG 1225 895 938 1426 1.4 0.7 0.8 1.1
glpK 360 8374 1579 8395 0.04 0.2 4.4 0.2
glpQ 159 4424 1747 9315 0.04 0.2 11.0 0.4
glpT 54 4285 893 9145 0.01 0.1 16.5 0.2
gltB 3219 2423 3388 1487 1.3 2.3 1.1 1.4
gltD 1881 1282 1829 595 1.5 3.1 1.0 1.4
glyA 1613 3148 3353 3448 0.5 1.0 2.1 1.1
gntK 631 217 670 259 2.9 2.6 1.1 3.1
gntP 87 354 321 799 0.2 0.4 3.7 0.9
gntU 334 98 260 126 3.4 2.1 0.8 2.7
guaB 4670 7698 2558 1733 0.6 1.5 0.6 0.3
ldhA 1823 1281 6014 3669 1.4 1.6 3.3 4.7
maeB 579 1420 1509 1839 0.4 0.8 2.6 1.1
malF 2381 2353 7365 9358 1.0 0.8 3.1 3.1
manZ 3993 2734 12806 9993 1.5 1.3 3.2 4.7
mdh 5878 9397 12603 15821 0.6 0.8 2.1 1.3
mglA 10 592 400 1205 0.02 0.3 40.0 0.7
mglB 38 1376 1529 4340 0.03 0.4 40.3 1.1
nrfE 783 21 531 754 36.5 0.7 0.7 24.7
nrfF 2460 41 1177 2267 59.7 0.5 0.5 28.6
nrfG 611 10 216 435 58.6 0.5 0.4 20.7
pntA 3946 6915 7400 7086 0.6 1.0 1.9 1.1
pntB 1736 2546 3057 3083 0.7 1.0 1.8 1.2
ppsA 247 6026 1325 3494 0.04 0.4 5.4 0.2
proA 2536 2397 13 12 1.1 1.1 0.01 0.01
proB 3589 3092 7 4 1.2 1.9 0.00 0.00
ptsG 13731 3926 16556 5403 3.5 3.1 1.2 4.2
rpsQ 6405 12505 9398 7652 0.5 1.2 1.5 0.8
sdhA 1033 7257 3292 3154 0.1 1.0 3.2 0.5
sdhB 895 5161 2407 2521 0.2 1.0 2.7 0.5
sdhD 556 5466 2568 1980 0.1 1.3 4.6 0.5
serA 2256 956 1638 793 2.4 2.1 0.7 1.7
serC 3904 2365 3230 1738 1.7 1.9 0.8 1.4
srlA 174 4601 313 3037 0.04 0.1 1.8 0.1
sthA 3236 3764 1936 2741 0.9 0.7 0.6 0.5
sucA 3988 8390 4822 4421 0.5 1.1 1.2 0.6
tdcA 74 4064 3412 8483 0.02 0.4 45.9 0.8
genes (involved in thiamine biosynthesis), and treBC genes (trehalose transport and metabolism). Refer to Table 2 for expression levels and ratios.
418 genes in the E. coli genome are suggested to be
regu-lated in part by CRP, as reported by the most current Eco-Cyc database [34]. While the modes of regulation of many of these genes are complicated and not well understood
(often involving multiple transcription factor binding sites), the CRP-cAMP complex is assigned to be a tran-scriptional activator for approximately 321 genes (imply-ing upregulation in the absence of glucose) and a repressor for approximately 46 genes (implying downreg-ulation in the absence of glucose) (in some cases the role of CRP is dual or unclear). While 629 genes show signifi-cant changes in their expression levels in response to the presence of glucose in W3110 (Figure 1), only 19% of them (118 out of 629) have a CRP binding site close to their start codon (these genes are highlighted in green in Additional file 2 (Table S2)). This result is perhaps not unexpected when considering that most genes under CRP control are also regulated by other transcription factors [34]. Of these 118 genes, 25 are upregulated while 93 show reduced expression in the presence of glucose. 77 out of the 93 genes downregulated in glucose are described in Ecocyc as being activated by CRP-cAMP, showing good agreement with the expected inverse rela-tionship between glucose presence and CRP-cAMP activ-ity. Meanwhile only 23 of the 80 genes showing significant differential expression in the presence of glu-cose for strain PC05 are present among the list of 418 genes believed to be directly regulated by CRP (high-lighted in green in Additional file 3 (Table S3); 7 are upregulated in glucose, and 13 out of the remaining 16 downregulated genes are reported to be activated by CRP-cAMP and therefore expected to show lower expression in the presence of glucose), again demonstrating significant alleviation of catabolite repression. Thus, the majority of expression changes resulting from the presence of glucose or the CRP* mutations are not directly related to altered regulation by CRP at CRP binding sites, but rather due to secondary effects resulting from a smaller number of direct, CRP-mediated expression differences.
To investigate which genes respond differently to glucose in PC05 compared to W3110, an interaction term ((CRP* G/CRP*)/(WT G/WT)) was examined with the same
crite-tdcE 95 397 3932 11414 0.2 0.3 41.4 9.9
tdcG 126 182 3018 14708 0.7 0.2 23.9 16.6
thiC 163 179 212 455 0.9 0.5 1.3 1.2
thiE 136 140 183 412 1.0 0.4 1.4 1.3
thrA 812 2686 1997 1279 0.3 1.6 2.5 0.7
thrB 849 2857 2165 1353 0.3 1.6 2.6 0.8
thrC 783 1722 1594 1378 0.5 1.2 2.0 0.9
tnaA 688 16366 10805 23343 0.04 0.5 15.7 0.7
tnaB 74 3825 1957 9810 0.02 0.2 26.6 0.5
treB 4465 17280 4711 19044 0.3 0.3 1.1 0.3
treC 3007 12164 2606 15416 0.3 0.2 0.9 0.2
Upd 11584 3965 4736 6483 2.9 0.7 0.4 1.2
ymfL 29 56 364 71 0.5 5.1 12.5 6.6
ymfO 114 177 961 137 0.7 7.0 8.4 5.4
Four different conditions were tested: W3110 in LB+glucose medium (WT G), W3110 in LB medium (WT), PC05 in LB+glucose medium (CRP* G), and PC05 in LB medium (CRP*)
Table 2: Expression levels for the genes discussed in this paper. (Continued)
Table 3: Comparison between expression levels (signal values) of the wild-type strain genes in response to the presence of glucose in two different studies.
Gene symbol This study Study by Gosset et al. [30]
WT G WT G/WT WT G WT G/WT
Upregulated genes in the study by Gosset and coworkers
aceE 7646 0.58 8177 4.4
fis 3058 0.99 5726 6.9
guaB 4670 0.61 2749 4.2
ptsG 13731 3.50 2387 3.2
rplS 8353 0.84 5704 2.7
rpmE 13204 1.18 8773 3.9
rpsQ 6405 0.51 3311 2.7
rpsT 10344 1.8 24476 2.6
spf 11308 3.40 26801 11.2
Downregulated genes in the study by Gosset and coworkers
aceA 1806 0.57 498 0.2
aceB 1466 0.65 296 0.2
aldA 370 0.15 305 0.1
fumA 956 0.29 819 0.3
gltA 126 0.27 452 0.1
mdh 5878 0.62 996 0.2
pckA 6733 0.56 765 0.3
sdhA 1033 0.14 614 0.2
sdhB 556 0.10 401 0.2
sucA 3988 0.47 822 0.2
sucB 6087 0.60 802 0.1
sucC 5447 0.59 1250 0.2
sucD 3439 0.58 526 0.1
ria as pair-wise comparisons. This comparison reports the difference of differences and reveals that 238 genes respond differently to the presence of glucose in W3110 compared to PC05, as illustrated in Figures 3a and 3b (listed in supplementary Table S4 (see Additional file 4)).
As shown in Table 2, ppsA (encoding
phosphoenolpyru-vate synthase), glp genes (involved in glycerol transport
and metabolism), mgl genes of the galactose ABC
trans-porter, and TCA cycle genes fumA (fumarate hydratase
class I) and sdhA, sdhB, sdhD (succinate dehydrogenase)
all show significantly different responses to glucose in W3110 compared to PC05.
Pair-wise comparison between the CRP* G and WT G con-ditions identifies the changes in transcriptional levels of genes affected by CRP* in the presence of glucose. In this category, 349 genes show significant changes in their expression levels (Table 1), as depicted in Figure 4 and as listed in supplementary Table S5 (see Additional file 5). Many of the genes upregulated by CRP* (strain PC05) are involved in transport, catabolism, and amino acid
metab-olism (Table 2), including glp genes (involved in glycerol
transport and metabolism), mgl genes (galactose ABC
transporter), tdc genes (involved in serine and threonine
metabolism), and tnaB (encoding a tryptophan
trans-porter). Genes downregulated by CRP* in this
compari-son include gcd (encoding glucose dehydrogenase), glnP
(glutamine ABC transporter), pro genes (involved in
pro-line biosynthesis), and udp (uridine phosphorylase,
involved in pyrimidine ribonucleoside metabolism). Additional differentially expressed genes of relevance to this study are described in the Discussion.
Pair-wise comparison of gene expression in PC05 and W3110 grown on LB (without glucose) reveals changes in gene transcription levels as a result of the CRP* mutation. This comparison shows that 553 genes are expressed dif-ferently (392 of them are upregulated) between these two strains in the absence of glucose. These results are summa-rized in Table 1, and the specific genes are listed in
supple-mentary Table S6 (see Additional file 6). gapC (encoding
glyceraldehyde 3-phosphate dehydrogenase), nrf genes
(involved in anaerobic respiration), and tdc genes
(involved in serine and threonine metabolism) are exam-ples of genes upregulated by CRP*.
Finally, to examine the extent to which CRP* reduces the glucose effect, we performed a pair-wise test between two conditions: PC05 in the presence of glucose (CRP* G) and W3110 in the absence of glucose (WT). Our results show that the transcriptional levels of 481 genes are signifi-cantly different between these two conditions. These results are summarized in Table 1 and the specific genes and expression values are listed in supplementary Table S7 (see Additional file 7). Examples of genes most
signifi-cantly upregulated by CRP* in glucose include the nrf
genes, citF (encoding citrate lyase), gat genes (involved in
hexitol transport and metabolism), edd (encoding
phos-phogluconate dehydratase), ldhA (lactate
dehydroge-nase), fru genes (fructose transport and metabolism),
manZ (mannose PTS permease), ptsG, and malF (maltose ABC transporter).
Real-Time Reverse Transcription PCR
To confirm the microarray results, the transcript levels of ppsA and pntA, both of which showed significant changes in their transcriptional levels under the various conditions tested, were compared by real-time reverse transcription
PCR. The transcript of rpsQ was also analyzed, as this gene
was noted to respond quite differently to the presence of glucose with wild-type CRP in our study as compared to the study by Gosset (WT G/WT value of 0.51 compared to 2.7) [30]. Data are presented in supplementary Table S8b as fold-changes (signal ratios) for all conditions tested, and show a good agreement between microarray and real-time RT-PCR results (see Additional file 8).
Cofactor analysis
In order to better understand how CRP* expression may influence NADPH availability for xylose reduction,
intra-Genome-wide transcriptional effects of glucose in strain W3110 expressing wild-type CRP, presented as expression ratios for individual genes showing significant differential expression in the presence and absence of glucose (WT G/ WT)
Figure 1
Genome-wide transcriptional effects of glucose in strain W3110 expressing wild-type CRP, presented as expression ratios for individual genes showing sig-nificant differential expression in the presence and absence of glucose (WT G/WT). a) 629 genes show sig-nificant changes in expression level in response to the pres-ence of glucose in strain W3110. b) The changes in expression levels of the same genes shown in (a) in CRP* strain PC05, in response to glucose. Gene names and expres-sion levels are given in supplementary Table S2 (see Addi-tional file 2).
0 2 4
1 101 201 301 401 501 601
Gene number
WT
G
/
WT
a
0 2 4
1 101 201 301 401 501 601
Gene number
CRP
* G
/
CRP
*
cellular cofactor concentrations were quantified for wild-type and CRP* strains engineered to produce xylitol. To
prevent xylose metabolism in these strains, xylB encoding
xylulokinase was deleted [24]. The wild-type CRP strain
(W3110ΔxylB) was transformed with plasmid pPCC207
for inducible co-expression of an NADPH-dependent
xylose reductase (CbXR) and the E. coli ATP-dependent
xylose transporter system (XylFGH) [25], while the CRP*
strain (PC05ΔxylB) was transformed with plasmid
pLOI3815 for CbXR expression [24]. The strains were then compared after growth on glucose (no xylitol pro-duction) versus growth on glucose plus xylose (resulting in xylose reduction).
Results from the intracellular cofactor concentration measurements are summarized in Table 4. Also listed are the xylitol production results for these strains in batch fer-mentations and resting cell cultures. Note that the CRP* strain produced considerably more xylitol and with a higher yield. In the absence of xylose, the NADPH concen-tration is significantly higher in the CRP* strain (0.8
ver-sus 0.5 μmol (g cdw)-1). Meanwhile, given the ability to
reduce xylose to xylitol, the NADPH concentration falls to a much lower level in the CRP* strain (from 0.8 to 0.1
μmol (g cdw)-1) compared to wild-type CRP (from 0.5 to
0.3 μmol (g cdw)-1). While the NADPH/NADP+ ratios are
nearly identical for both strains in the absence of glucose, the significant consumption of NADPH during xylose reduction coincides with a significantly larger drop in the
NADPH/NADP+ ratio for CRP* (from 0.09 to 0.01)
com-pared to wild-type CRP (from 0.10 to 0.05). Also note that
the oxidized NADP+ concentrations are significantly
ele-vated in the CRP* strain, while both NADH and NAD+
concentrations are much lower. The net effects are higher
total NADP(H) (i.e. NADPH plus NADP+) concentrations
and lower NAD(H) concentrations in the CRP* strains compared to wild-type. It is also noteworthy that the
NADH/NAD+ ratio is significantly lower in the CRP*
strain under both conditions tested.
Discussion
We previously used a CRP* strain to promote expression of xylose transporters in the presence of glucose to pro-duce xylitol from a glucose+xylose mixture, with xylose metabolism disabled [24]. Plasmid-based,
CRP-inde-pendent expression of xylose transporters in wild-type crp
strains was an alternative strategy we explored to enhance xylose uptake and xylitol production in the presence of glucose [25]. However the favorable effects of CRP* expression were found to go beyond improving xylose transport and to include other beneficial phenotypes such as reduced acetate production and higher yields on xylose reduced per mole of glucose consumed (as shown in Table 4) [26].
Transcription changes associated with CRP* expression are extensive. While many of the genes known to be regu-lated by CRP show altered expression in the context of CRP*, the majority of differentially expressed genes are not known to be directly under CRP control. The complex network of genes showing altered regulation due to sec-ondary effects of CRP* is not likely to be metabolically systematic, since the mutant CRP used in this study (i.e. CRP*) does not have an evolved physiological role, was isolated under very particular growth conditions, and does not simply serve as a constitutive, cAMP-independ-ent regulator. Therefore the difficulty in idcAMP-independ-entifying clear patterns of differential expression of metabolically related genes is perhaps not surprising (the mutations in CRP* may not uniformly alter the regulator's natural physiolog-ical role at different control sites). Rather than attempting to assign physiological meaning to the altered transcrip-tome, we instead identify gene expression changes that help to explain the beneficial effects of CRP* expression as they relate to xylitol production. Specifically, we focus on genes that may affect NADPH availability.
Genome-wide transcriptional effects of glucose in CRP* strain PC05, presented as expression ratios for individual genes showing significant differential expression in the pres-ence and abspres-ence of glucose (CRP* G/CRP*)
Figure 2
Genome-wide transcriptional effects of glucose in CRP* strain PC05, presented as expression ratios for individual genes showing significant differential expression in the presence and absence of glucose (CRP* G/CRP*). a) 80 genes show significant changes in expression level for strain PC05. Only 29 are upregulated. b)
The changes in expression levels of the same genes shown in
(a) for strain W3110, in response to glucose. Gene names and expression levels are given in supplementary Table S3 (see Additional file 3).
0 2 4
1 26 Gene number 51 76
CRP
* G
/
CRP
*
a
0 2 4
1 26 51
Gene number 76
WT
G
/
WT
Improved cofactor availability for xylitol production
In E. coli, complete oxidation of glucose during aerobic growth requires that respiration and anabolic metabolism consume reducing equivalents as they are generated [35]. Elevated glucose flux beyond the capacity of respiration and growth results in incomplete oxidation and acid secretion. Heterologous, NADPH-dependent xylitol duction can act as an added electron sink in strains pro-ducing xylitol from a mixture of glucose and xylose, and an increased ability to produce xylitol during aerobic growth is expected to increase glucose oxidation and tri-carboxylic acid (TCA) cycle flux, provided reducing equiv-alents from NADH can be converted to NADPH. Alternately, increased expression of genes involved in glu-cose oxidation would allow for increased xylitol produc-tion, provided reducing equivalents can be delivered as NADPH. Our transcription analysis sheds light on the observed ability of CRP* strains expressing xylose reduct-ase to produce more xylitol and secrete less acetate than similar wild-type CRP strains constitutively expressing a xylose transporter.
TCA cycle genes involved in reactions between succinate and oxaloacetate are upregulated in PC05 compared to W3110 in the presence of glucose, as listed in Table 2.
These include sdhA, sdhB, sdhD (encoding succinate
dehy-drogenase), fumA (encoding fumarate hydratase class I),
and mdh (encoding malate dehydrogenase). All of these
genes are known to have CRP binding sites in their pro-moter regions, so increased expression in PC05 is likely due to direct regulatory effects of CRP*. A strain with a more active TCA cycle potentially increases glucose oxida-tion, produces more NADPH and produces less acetate
[36,37]. Upregulation of acs (acetyl-CoA synthetase) in
CRP* G compared to WT G (3.63-fold) may promote ace-tate assimilation instead of accumulation. Also shown in
Table 2, sthA encoding soluble pyridine nucleotide
tran-shydrogenase is differentially expressed in CRP* G com-pared to WT G (CRP* G/WT G ratio of 0.6). SthA is believed to primarily oxidize NADPH to regenerate NADH and an increase in NADPH demand corresponds
to reduced sthA expression [38,39]. As shown in Table 2,
sthA expression is lower with CRP* G compared to WT G.
Transcriptional control of sthA is not well understood, but
the lack of an apparent CRP binding site suggests that
reduced sthA expression may be a result of increased
NADPH demand rather than a direct result of CRP*-medi-ated control. Consistent with this apparent elevCRP*-medi-ated demand for NADPH is the fact that the genes encoding both subunits of the membrane-bound,
proton-translo-cating pyridine nucleotide transhydrogenase (pntA and
pntB) are upregulated in CRP* G compared to WT G (1.88
and 1.76-fold respectively). PntAB has been reported to
produce 35–45% of the NADPH required for E. coli
bio-synthesis during aerobic growth [38]. Interestingly, the
maeB gene encoding NADP-linked malic enzyme
(decar-boxylating malate to pyruvate) can serve as another source
of NADPH regeneration in E. coli and also shows a higher
level of transcription in PC05 compared to W3110 in the presence of glucose (CRP* G/WT G ratio of 2.6). Changes in transcriptional patterns of the above mentioned genes can be in response to increased demands for NADPH in CRP* strains, perhaps as this relates to apparently increased anabolic demands (described below).
To ensure continued growth, E. coli balances intracellular
concentrations and ratios of the reduced and oxidized cofactors through a complex interplay between catabolic metabolism, anabolic metabolism, redox-sensitive regula-tion (both genetic and allosteric) and transhydrogenase activities [35,40-43]. While the mechanisms of maintain-ing redox balance are not well understood, the expression levels of enzymes and regulators involved in redox metab-olism play a critical role. It is thus perhaps not surprising that altering the activity of a global regulator has a signif-icant impact on cofactor concentrations and the range of attainable redox states (as demonstrated in Table 4). NADH regulates the activity of a number of enzymes involved in central metabolism and glucose oxidation (e.g. pyruvate dehydrogenase [44,45], citrate synthase
Genes that respond differently to the presence of glucose in W3110 compared to PC05, (CRP* G/CRP*)/(WT G/WT)
Figure 3
Genes that respond differently to the presence of glucose in W3110 compared to PC05, (CRP* G/ CRP*)/(WT G/WT). a) Ratio of expression levels of these 238 genes in strain W3110 in the presence and absence of glucose (WT G/WT). b) Ratio of expression levels of the same genes shown in (a) in strain PC05, in the presence and absence of glucose (CRP* G/CRP*). Gene names and expres-sion levels are given in supplementary Table S4 (see Addi-tional file 4).
0 2 4
1 51 101 151 201
Gene number
WT
G
/
WT
a
0 2 4
1 51 101 151 201
Gene number
CRP
* G
/
CRP
*
[46,47] and α-ketoglutarate dehydrogenase [48]). CRP* expression results in reduced NADH levels, increased pro-duction of NADPH relative to NADH, and increased
toler-ance to a range of NADPH levels and NADPH/NADP+
ratios, all of which are likely to improve NADPH-depend-ent xylitol production during glucose metabolism.
Expression of "unnecessary" genes
Most of the genes that are differentially expressed between PC05 and W3110 in the presence of glucose (231 out of 349) are upregulated with CRP* (Figure 4), supporting the generally assumed behavior of CRP* in alleviating glucose-dependent catabolite repression. The otherwise unnecessary upregulation of these genes likely causes a significant increase in demand for carbon and energy, helping to explain the slower growth rate observed for PC05 compared to W3110 [24]. Notable genes that fall into this upregulated category include many involved in
amino acids metabolism, such as tnaA (encoding
tryp-tophanase), thrA (aspartokinase I and homoserine
dehy-drogenase I), glyA (serine hydroxymethyl transferase),
tdcB (threonine dehydratase), thrC (threonine synthase), thrB (homoserine kinase), and asnA (asparagine syn-thetase A) (refer to Table 2). Upregulation of amino acid metabolism pathways may be in response to increased protein synthesis demands caused by upregulation of other genes.
Catabolite repression and inducer exclusion
A relationship between the phosphorylation state of
enzyme IIAGlc and the intracellular
"phosphoenolpyru-vate (PEP)/pyru"phosphoenolpyru-vate" ratio has been suggested [9].
Decreased levels of phosphorylated enzyme IIAGlc is
usu-ally accompanied by decreased PEP/pyruvate ratios. The crucial role of the unphosphorylated form of enzyme
IIAGlc in catabolite repression and inducer exclusion is
well documented [8,9,14-18]. As shown in Table 2,
phos-phoenolpyruvate synthase (encoded by ppsA) is expressed
to a higher level in PC05 compared to W3110 in the pres-ence of glucose (CRP* G/WT G ratio of 5.35). Upregula-tion of this enzyme which mediates conversion of pyruvate to PEP may increase the intracellular PEP/pyru-vate ratio, resulting in an increase in the phosphorylated
form of enzyme IIAGlc. This in turn may increase adenylate
cyclase activity [17,18] and further help to alleviate cat-abolite repression and inducer exclusion in PC05.
Conclusion
We have used microarray analysis to compare the
tran-scriptomes of E. coli W3110 expressing wild-type CRP and
mutant strain PC05 expressing CRP* in the presence and absence of glucose. Table 1 summarizes the genome-wide effects of CRP* expression under the conditions tested. Gene expression in the context of CRP* in the presence of glucose is very different from that of wild-type in the absence of glucose. Although fewer genes show expression sensitivity to glucose in PC05 compared to W3110, CRP* does not completely eliminate glucose effects. As expected, CRP* expression causes increased expression of genes involved in nutrient transport and catabolism (among many others). In addition, several genes showing significant differential expression in CRP* versus wild-type CRP help to explain the observed differences in cofac-tor levels and metabolic behavior of CRP* strains used in xylitol production.
Materials and methods
General
E. coli K-12 strain W3110 (ATCC 27325) and its deriva-tives were maintained on plates containing Luria-Bertani (LB) medium (10 g tryptone, 5 g yeast extract, 5 g NaCl, and 15 g agar per liter). Methods for construction of
strains PC05 (W3110 and crp*), PC07 (W3110ΔxylB), and
PC09 (PC05ΔxylB) were described previously [24].
Briefly, the crp* gene and xylB deletion were introduced
into W3110 via P1 phage transduction using a lysate from
strain ET25 (crp*::Tn10) [8] and PC06 (W3110,
ΔxylB::FRT-aac-FRT) [24] followed by selections on
tetra-cycline (for crp*) or apramycin (for ΔxylB) plates. Plasmid
pLOI3815 is a medium copy, pBR322-origin vector carry-ing a kanamycin resistance marker and the xylose
reduct-ase gene from Candida boidinii, which is located
downstream of tac promoter and upstream of a
transcrip-tion terminatranscrip-tion sequence [24]. Xylose transporter genes
xylFGH (ATP-dependent xylose transporter system) were
cloned downstream of CbXR in pLOI3815 to make plas-mid pPCC207.
Amino acid substitutions in the CRP* were confirmed by
sequencing. The crp* phenotype was verified in two ways.
First, several TetR transductants were grown in LB medium
containing glucose (1%) and xylose (1%). Cells were har-vested at mid logarithmic growth phase and washed twice
Significant genome-wide transcription effects of expressing CRP* (strain PC05) instead of wild-type CRP (W3110) in the presence of glucose, presented as individual gene expression ratios (CRP* G/WT G)
Figure 4
Significant genome-wide transcription effects of expressing CRP* (strain PC05) instead of wild-type CRP (W3110) in the presence of glucose, presented as individual gene expression ratios (CRP* G/WT G). 349 genes show significant changes in their expression levels between CRP* G and WT G conditions. Gene names and expression levels are given in supplementary Table S5 (see Additional file 5).
0 2 4
1 101 201 301
Gene number
C
R
P
* G / W
T
in phosphate buffer containing kanamycin (50 μg/mL). After allowing time for residual sugars to be cleared, the cells were resuspended a final time in buffer containing xylose (1%), kanamycin, and 1% triphenyltetrazolium chloride (TTC). Reduction of TTC results in red color for-mation and indicates constitutive xylose utilization. The
crp* phenotype was additionally confirmed using HPLC
to verify simultaneous glucose and xylose consumption in batch cultures [24].
Growth conditions
Four different conditions were tested in this study: W3110 in LB medium (WT), W3110 in LB+glucose medium (WT G), PC05 in LB medium (CRP*), and PC05 in LB+glucose medium (CRP* G). All experiments were performed at least in triplicate and all data reported are the average of at least three experiments. Cell culture optical density was
measured at 600 nm (OD600) using a SPECTRAMax
PLUS384 spectrophotometer (Molecular Devices). Cells
grown for harvesting were prepared briefly as follows. Overnight pre-seed cultures were prepared by inoculating 3 ml of LB medium (in 13 × 100 mm tube) with a few col-onies from a fresh LB plate. The overnight cultures were
used to inoculate, to an OD600 of 0.1, 50 ml LB media
(with or without 0.4% glucose supplementation) seed cultures in a 250 ml shake-flask. The seed culture were
grown at 37°C to an OD600 of ~2 and then were used to
directly inoculate, to an OD600 of 0.02, 100 ml LB media
(with or without 0.4% glucose supplementation) cultures in a 500 ml flask. These cultures were grown at 37°C and
250 rpm to an OD600 of 0.5.
Cell harvesting and preparation of RNA
Cells from the 100 ml culture were harvested at an OD600
of 0.5 (early logarithmic growth phase) by immediately placing on ice, transferring to 50 ml falcon tubes and cen-trifuging at 4°C for 5 minutes before treating with lys-ozyme. Promega PureYield™RNA Midiprep System kit was used for RNA extraction. As a preliminary check, RNA yield and quality were determined by spectrophotometry according to the manufacturer's protocol and the integrity of the purified RNA was determined by formaldehyde aga-rose gel electrophoresis.
Labeling, hybridization and scanning
Total RNA concentration and purity were determined using a NanoDrop spectrophotometer and total RNA integrity was examined using an Agilent Bioanalyzer. Total RNA of sufficient concentration, purity, and integ-rity was labeled and subsequently hybridized to Affyme-trix GeneChip microarrays by the Penn State DNA Microarray Facility according to the manufacturer's instructions (Affymetrix Inc, Santa Clara, CA). Briefly, 10
μg of total RNA was converted to cDNA using random
primed reverse transcription. cDNA was purified by removing the RNA via hydrolysis with NaOH and then neutralizing the solution. Purified cDNA was fragmented and subsequently end-labeled with biotin. Fragmented, end-labeled cDNA was dissolved in hybridization cocktail
and hybridized to Affymetrix GeneChip E. coli Genome
2.0 Arrays (approximately 10000 probe set) for 16 hours
at 45°C. The details of GeneChip E. coli Genome 2.0
Arrays are described by Affymetrix [49]. Table 4: Culture performance and intracellular cofactor levels and ratios for strains engineered to produce xylitol.
Batch fermentationa Resting cellsb Cofactor concentrations
μmol (g cdw)-1
Cofactor ratios
Glucose consumed (mM)
Xylitol produced
(mM)
Acetate produced
(mM)
Xylitol yieldc
NADH NAD+ NADPH NADP+ NADH/
NAD+
NADPH/ NADP+
W3110ΔxylB + pPCC207, GX
248 223 19 2.5 10.3 47.9 0.3 ± 0.05 5.8 0.22 0.05
W3110ΔxylB + pPCC207, G
- - - - 10 ± 1.8 47.9 0.5 5.1 ± 1.0 0.21 0.10
PC05ΔxylB + pLOI3815, GX
301 680 1.3 ± 1.4 3.9 1.8 ± 0.7 33.1 0.1 ± 0.04 9.9 ± 2.3 0.05 0.01
PC05ΔxylB + pLOI3815, G
- - - - 3.8 ± 0.7 39.2 0.8 8.7 ± 2.6 0.10 0.09
W3110ΔxylB harboring plasmid pPCC207 expresses CbXR and XylFGH, while PC05ΔxylB harboring plasmid pPLOI3815 expresses CbXR. Strains were grown in the presence of glucose only (G) or in glucose plus xylose (GX), enabling xylose reduction during glucose metabolism. Standard deviations were less than 15% unless noted.
a Reported in Table 4 of reference [26].
b Resting cells were prepared as described [61]. Values reported were measured after 24 hours of biotransformation with cells suspended to OD 600 = 2.0.
After hybridization, the hybridization cocktail was removed and the arrays were washed to remove unbound and non-specifically bound cDNA. Hybridization was detected by staining the arrays with streptavidin phyco-erythrin. All washing and staining was performed using the Affymetrix GeneChip Fluidics Station 450 according to the manufacturer's instructions (Affymetrix Inc, Santa Clara, CA). Stained arrays were scanned using the Affyme-trix GCS3000 7G scanner.
Microarray data analysis
A minimum of three data sets was generated for each of the four different conditions tested (based on the combi-nation of the strains W3110 and PC05 in LB and LB+glu-cose media). Affymetrix Expression Console™software (Version 1.1) was used for background adjustment, nor-malization and summarization of chip level data in the form of feature intensity (CEL) files in order to generate probe set summarization (CHP) files, using the probe log-arithmic intensity error (PLIER) method. Data from CHP files were then exported to a Microsoft Excel spreadsheet for further analysis. Signal values for 10208 probsets from
GeneChip E. coli Genome 2.0 Arrays were filtered to
extract probe set data for only the E. coli K-12 strain. All
calculations and analyses were performed on the 4070 genes remaining after filtration.
Signal values were transformed to the log base for the pair-wise comparisons. A linear model was fitted to each gene using the Bioconductor software package LIMMA [50,51] in the R environment [52]. The linear model coefficients were used to calculate significant differences in expression levels for all pair-wise comparisons. The P-values were adjusted by the Benjamini-Hochberg method [53] and genes with a P-value of <0.05 were considered as those with significantly different expression levels under differ-ent conditions tested. Data are reported as expression lev-els (signal values) or ratios of expression levlev-els. Supplementary Table S1 (Additional file 1) contains
sig-nal values for the complete probe set data for the E. coli
K-12 genome. Written code in R [52] (file name: sup_code.doc) can be found in supplementary material (see Additional file 9). Gene Annotations were trans-formed from AFFY probe set ID's to Entrez gene IDs using NETAFFX on the Affymetrix website [49]. The online data-base for annotation, visualization and integrated discov-ery (DAVID) [54,55] and Kyoto Encyclopedia of Genes and Genome (KEGG) [56] were used for pathway visuali-zation and gene ontology (GO) classification.
Real-time, Reverse Transcription PCR
Total RNA samples were isolated the same way as for
microarray studies. ppsA (phosphoenolpyruvate
syn-thase), pntA (membrane-bound proton-translocating
pyridine nucleotide transhydrogenase), and rpsQ (30S
ribosomal subunit protein S17) were selected for
confir-mation by real-time reverse transcription PCR with rrsH
(encoding 16S ribosomal RNA) as a control. Primer and probe sequences used for RT-PCR are listed in supplemen-tary Table S8a (Additional file 8) and were designed by Deborah S. Grove of the Penn State Nucleic Acid Facility using Primer Express v2.0 (Applied Biosystems, Foster City, CA). Probes were synthesized by Biosearch (Novato, CA). The Applied Biosystems High Capacity cDNA Reverse Transcription Kit (part number 4368813) was used for reverse transcription according to the manufac-turer's instructions for cDNA production. cDNA was amplified in an ABI 7300 real-time machine using
Taq-Man® Universal PCR Master Mix, No AmpErase® UNG
(part number 4324018). Output was analyzed using the
method [57].
Cofactor measurements
The cofactor analysis used in this study is based on the methods developed by Bernofsky and Swan [58], and modified by Gibon and Larher [59], and Walton and Stewart [60]. To investigate the effect of xylitol production on intracellular NADP(H) and NAD(H) levels, cofactor concentrations and ratios were measured and compared
in PC05ΔxylB strain harboring pLOI3815 and
W3110ΔxylB harboring pPCC207. Seed cultures were
grown at 37°C to an OD600 of ~2 and then were used to
directly inoculate, to an OD600 of 0.02, 100 ml LB
medium supplemented with 100 mM glucose, 100 mM xylose (or 200 mM glucose for non-xylitol producing
con-ditions), 50 mM MOPS, kanamycin monosulfate (50 μg/
ml) and isopropyl-B-D-thiogalactopyranoside (IPTG, 100
μM) in a 500 ml flask. These cultures were grown at 30°C
and 250 rpm to an OD600 of 0.5. Cells were immediately
chilled on ice and harvested by pelleting (4°C, 15 min,
3750 rpm) to achieve a final OD600 of 30 in 1 ml. To
iso-late the oxidized forms, the pellet was resuspended in 0.5 ml of 0.3 M HCl, 50 mM Tricine-NaOH (pH 8.0). To iso-late the reduced forms, the pellet was resuspended in 0.5 ml of 0.3 M NaOH. All samples were then heated to 60°C for 7 minutes followed by a neutralization step (0.5 ml 0.3 M NaOH for oxidized forms, 0.3 ml 0.3 M HCl, 0.2 ml 1.0 M Tricine-NaOH (pH 8.0) for reduced forms). The neutralized solutions were then centrifuged (4°C, 60 min, 13000 rpm) and the supernatants were transferred to a new microcentrifuge tube.
Cofactor levels were measured in a 96-well microtiter
plate. Either 40 μl of oxidized sample and 40 μl 0.1 M
NaCl, or 80 μl of reduced sample was aliquoted to a single
well. The 2X stock solution of the reaction mixture
sisted of equal volumes of 1.0 M Tricine-NaOH (pH 8.0), 4.2 mM MTT, 40 mM EDTA, 1.67 mM PES, and substrate (either 5 M ethanol or 25 mM glucose-6-phosphate). After addition of the appropriate reaction mixture (ethanol for NAD(H), glucose-6-phosphate for NADP(H)), the plate was incubated at 37°C for 5 minutes. To start the reaction, either 10 units/ml alcohol dehydrogenase (from 100 units/ml stock) or 0.27 units/ml glucose-6-phosphate dehydrogenase (from 2.7 units/ml stock) was added. The formation of reduced MTT was monitored using a
SpectraMax384 plate reader, taking readings every 15
sec-onds for 10 minutes using a wavelength of 570 nm while being incubated at 37°C. The cofactor concentration of the samples was interpolated by comparing the rate of reaction to that observed in a concentration curve run on the same plate, and subtracting the rate from the back-ground of the sample (reaction without enzyme).
Competing interests
The authors declare that they have no competing interests.
Authors' contributions
RK and JWC performed the experiments, DG assisted in experimental design and data analysis, RK and PCC wrote the manuscript. All authors have read and approved the final manuscript.
Note
**NOTE: Average signal values start at column Q in Table S1 and at column D in Tables S2-S7. Expression ratios start at column H in Tables S2-S7.
Additional material
Acknowledgements
We acknowledge W. Boos (University of Konstanz) for providing strain ET25, Dr. Craig Praul at the Penn State DNA Microarray Facility for assist-ance with all microarray methods and Dr. Deborah S. Grove of the Penn State Nucleic Acid Facility for assistance with RT-PCR. This research was made possible by a grant from the NSF (BES0519516) and support from the Penn State Associate Vice President for Research
References
1. Sabourin D, Beckwith J: Deletion of the Escherichia coli crp gene. J Bacteriol 1975, 122:338-340.
2. Emmer M, Decrombr B, Pastan I, Perlman R: Cyclic AMP receptor protein of E. coli: its role in synthesis of inducible enzymes. Proc Natl Acad Sci USA 1970, 66:480-487.
Additional file 1
Table S1. Signal values for the complete probe set data for the E. coli K-12 genome.
Click here for file
[http://www.biomedcentral.com/content/supplementary/1754-1611-3-13-S1.xls]
Additional file 2
Table S2. Expression levels of the genes that are differentially expressed between WT G and WT conditions (presented in Figure 1). Genes high-lighted in green have a CRP binding site close to their start codon. Click here for file
[http://www.biomedcentral.com/content/supplementary/1754-1611-3-13-S2.xls]
Additional file 3
Table S3. Expression levels of the genes that are differentially expressed between CRP* G and CRP* conditions (presented in Figure 2). Genes highlighted in green have a CRP binding site close to their start codon. Click here for file
[http://www.biomedcentral.com/content/supplementary/1754-1611-3-13-S3.xls]
Additional file 4
Table S4. Expression levels of the genes that respond differently to the pres-ence of glucose in W3110 compared to PC05, (CRP* G/CRP*)/(WT G/ WT) (presented in Figure 3).
Click here for file
[http://www.biomedcentral.com/content/supplementary/1754-1611-3-13-S4.xls]
Additional file 5
Table S5. Expression levels of the genes that are differentially expressed between CRP* G and WT G conditions (presented in Figure 4). Click here for file
[http://www.biomedcentral.com/content/supplementary/1754-1611-3-13-S5.xls]
Additional file 6
Table S6. Expression levels of the genes that are differentially expressed between CRP* and WT conditions.
Click here for file
[http://www.biomedcentral.com/content/supplementary/1754-1611-3-13-S6.xls]
Additional file 7
Table S7. Expression levels of the genes that are differentially expressed between CRP* G and WT conditions.
Click here for file
[http://www.biomedcentral.com/content/supplementary/1754-1611-3-13-S7.xls]
Additional file 8
Table S8. a) Primer and probe sequences used for RT-PCR. b) Compari-son between microarray and real-time reverse transcription PCR results. Data are presented as fold changes (signal ratio) for all conditions tested. Click here for file
[http://www.biomedcentral.com/content/supplementary/1754-1611-3-13-S8.doc]
Additional file 9
The file entitled "sup_code.doc" contains the written code in R, used for data analysis.
Click here for file
3. Karimova G, Ladant D, Ullmann A: Relief of catabolite repression in a cAMP-independent catabolite gene activator mutant of
Escherichia coli. Res Microbiol 2004, 155:76-79.
4. Tagami H, Aiba H: Role of CRP in transcription activation at
Escherichia coli lac promoter: CRP is dispensable after the formation of open complex. Nucleic Acids Res 1995, 23:599-605. 5. Nanchen A, Schicker A, Revelles O, Sauer U: Cyclic AMP-depend-ent catabolite repression is the dominant control mecha-nism of metabolic fluxes under glucose limitation in
Escherichia coli. J Bacteriol 2008, 190:2323-2330.
6. Bettenbrock K, Sauter T, Jahreis K, Kremling A, Lengeler JW, Gilles ED: Correlation between growth rates, EIIACrr phosphoryla-tion, and intracellular cyclic AMP levels in Escherichia coli K-12. J Bacteriol 2007, 189:6891-6900.
7. Saier MH, Reizer J: The bacterial phosphotransferase system: new frontiers 30 years later. Mol Microbiol 1994, 13:755-764. 8. Eppler T, Boos W: Glycerol-3-phosphate-mediated repression
of malT in Escherichia coli does not require metabolism, depends on enzyme IIAGlc and is mediated by cAMP levels.
Mol Microbiol 1999, 33:1221-1231.
9. Hogema BM, Arents JC, Bader R, Eijkemans K, Yoshida H, Takahashi H, Alba H, Postma PW: Inducer exclusion in Escherichia coli by non-PTS substrates: The role of the PEP to pyruvate ratio in determining the phosphorylation state of enzyme IIA. Mol Microbiol 1998, 30:487-498.
10. Ullmann A, Danchin A: Role of cyclic AMP in bacteria. Adv Cyclic Nucleotide Res 1983, 15:1-53.
11. Kolb A, Busby S, Buc H, Garges S, Adhya S: Transcriptional regu-lation by cAMP and its receptor protein. Annu Rev Biochem 1993, 62:749-795.
12. Botsford JL, Harman JG: Cyclic AMP in prokaryotes. Microbiol Rev 1992, 56:100-122.
13. Tagami H, Inada T, Kunimura T, Aiba H: Glucose lowers CRP* lev-els resulting in repression of the lac operon in cells lacking. Mol Microbiol 1995, 17:251-258.
14. Osumi T, Saier MH: Regulation of lactose permease activity by the phosphoenolpyruvate:sugar phosphotransferase sys-tem:Evidence for direct binding of the glucose-specific enzyme III to the lactose permease. Proc Natl Acad Sci USA 1982, 79:1457-1461.
15. Nelson SO, Wright JK, Postma PW: The mechanism of inducer exclusion. Direct interaction between purified IIIGlc of the phosphoenolpyruvate:sugar phosphotransferase system and the lactose carrier of Escherichia coli. EMBO J 1983, 2:715-720. 16. Saier MH Jr: Protein phosphorylation and allosteric control of inducer exclusion and catabolite repression by the bacterial phosphoenolpyruvate: sugar phosphotransferase system. Microbiol Rev 1989, 53:109-120.
17. Yang JK, Epstein W: Purification and characterization of ade-nylate cyclase from Escherichia coli K12. J Biol Chem 1983, 258:3750-3758.
18. Amin N, Peterkofsky A: A dual mechanism for regulating cAMP levels in Escherichia coli. J Biol Chem 1995, 270:11803-11805. 19. Guidi-Rontani C, Danchin A, Ullmann A: Isolation and
character-ization of an Escherichia coli mutant affected in the regula-tion of adenylate cyclase. J Bacteriol 1981, 148:753-761. 20. Botsford JL, Drexler M: The cyclic 3',5'-adenosine
monophos-phate receptor protein and regulation of cyclic 3',5'-adenos-ine monophosphate synthesis in Escherichia coli. Molec Gen Genet 1978, 165:47-56.
21. Harman JG, McKenney K, Peterkofsky A: Structure-function anal-ysis of 3 cAMP-independent forms of the cAMP receptor protein. J Biol Chem 1986, 261:6332-6339.
22. Aiba H, Nakamura T, Mitani H, Mori H: Mutations that alter the allosteric nature of cAMP receptor protein of Escherichia coli. EMBO J 1985, 4:3329-3332.
23. Aristidou A, Penttila M: Metabolic engineering applications to renewable resource utilization. Curr Opin Biotechnol 2000, 11:187-198.
24. Cirino PC, Chin JW, Ingram LO: Engineering Escherichia coli for xylitol production from glucose-xylose mixtures. Biotechnol Bioeng 2006, 95:1167-1176.
25. Khankal R, Chin JW, Cirino PC: Role of xylose transporters in xylitol production from engineered Escherichia coli. J Biotech-nol 2008, 134:246-252.
26. Khankal R, Luziatelli F, Chin JW, Frei CS, Cirino PC: Comparison between Escherichia coli K-12 strains W3110 and MG1655 and wild-type E. coli B as platforms for xylitol production. Bio-technol Lett 2008, 30:1645-1653.
27. Gorshkova I, Moore JL, McKenney KH, Schwarz FP: Thermody-namics of cyclic nucleotide binding to the cAMP receptor protein and its T127L mutant. J Biol Chem 1995, 270:21679-21683.
28. Belduz AO, Lee EJ, Harman JG: Mutagenesis of the cyclic AMP receptor protein of Escherichia coli:targeting positions 72 and 82 of the cyclic nucleotide binding pocket. Nucleic Acids Res 1993, 21:1827-1835.
29. Garges S, Adhya S: Sites of allosteric shift in the structure of the cyclic-amp receptor protein. Cell 1985, 41:745-751.
30. Gosset G, Zhang ZG, Nayyar SN, Cuevas WA, Saier MH: Transcrip-tome analysis of CRP-dependent catabolite control of gene expression in Escherichia coli. J Bacteriol 2004, 186:3516-3524. 31. Vijayendran C, Polen T, Wendisch VF, Friehs K, Niehaus K, Flaschel
E: The plasticity of global proteome and genome expression analyzed in closely related W3110 and MG1655 strains of a well-studied model organism, Escherichia coli K-12. J Biotechnol 2007, 128:747-761.
32. Baba T, Ara T, Hasegawa M, Takai Y, Okumura Y, Baba M, Datsenko KA, Tomita M, Wanner BL, Mori H: Construction of Escherichia coli K-12 in-frame, single-gene knockout mutants: the Keio collection. Mol Syst Biol 2006. Article 2006.0008
33. Hayashi K, Morooka N, Yamamoto Y, Fujita K, Isono K, Choi S, Oht-subo E, Baba T, Wanner BL, Mori H, Horiuchi T: Highly accurate genome sequences of Escherichia coli K-12 strains MG1655 and W3110. Mol Syst Biol 2006. Article 2006.0008
34. Keseler IM, Bonavides-Martinez C, Collado-Vides J, Gama-Castro S, Gunsalus RP, Johnson DA, Krummenacker M, Nolan LM, Paley S, Paulsen IT, Peralta-Gil M, Santos-Zavaleta A, Shearer AG, Karp PD: EcoCyc: A comprehensive view of Escherichia coli biology. Nucleic Acids Res 2009, 37:D464-D470.
35. Fuhrer T, Sauer U: Different biochemical mechanisms ensure network-wide balancing of reducing equivalents in microbial metabolism. J Bacteriol 2009, 191:2112-2121.
36. Wolfe AJ: The acetate switch. Microbiol Mol Biol Rev 2005, 69:12-50.
37. Phue JN, Shiloach J: Transcription levels of key metabolic genes are the cause for different glucose utilization pathways in E. coli B (BL21) and E. coli K (JM109). J Biotechnol 2004, 109:21-30. 38. Sauer U, Canonaco F, Heri S, Perrenoud A, Fischer E: The soluble and membrane-bound transhydrogenases UdhA and PntAB have divergent functions in NADPH metabolism of
Escherichia coli. J Biol Chem 2004, 279:6613-6619.
39. Canonaco F, Hess TA, Heri S, Wang TT, Szyperski T, Sauer U: Met-abolic flux response to phosphoglucose isomerase knock-out in Escherichia coli and impact of overexpression of the soluble transhydrogenase UdhA. FEMS Microbiol Lett 2001, 204:247-252. 40. Bizouarn T, Althage M, Pedersen A, Tigerstrom A, Karlsson J, Johans-son C, Rydstrom J: The organization of the membrane domain and its interaction with the NADP(H)-binding site in proton-translocating transhydrogenase from E. coli. Biochimica Et Bio-physica Acta-Bioenergetics 2002, 1555:122-127.
41. Arner ESJ, Holmgren A: Physiological functions of thioredoxin and thioredoxin reductase. Eur J Biochem 2000, 267:6102-6109. 42. Durnin G, Clomburg J, Yeates Z, Alvarez PJJ, Zygourakis K, Campbell
P, Gonzalez R: Understanding and harnessing the microaero-bic metabolism of glycerol in Escherichia coli. Biotechnol Bioeng 2009, 103:148-161.
43. Boonstra B, French CE, Wainwright I, Bruce NC: The udhA gene of
Escherichia coli encodes a soluble pyridine nucleotide tran-shydrogenase. J Bacteriol 1999, 181:1030-1034.
44. Shen LC, Atkinson DE: Regulation of pyruvate dehydrogenase from Escherichia coli. Interactions of adenylate energy charge and other regulatory parameters. J Biol Chem 1970, 245:5974-5978.
45. Kim Y, Ingram LO, Shanmugam KT: Dihydrolipoamide dehydro-genase mutation alters the NADH sensitivity of pyruvate dehydrogenase complex of Escherichia coli K-12. J Bacteriol 2008, 190:3851-3858.
Publish with BioMed Central and every scientist can read your work free of charge "BioMed Central will be the most significant development for disseminating the results of biomedical researc h in our lifetime."
Sir Paul Nurse, Cancer Research UK
Your research papers will be:
available free of charge to the entire biomedical community
peer reviewed and published immediately upon acceptance
cited in PubMed and archived on PubMed Central
yours — you keep the copyright
Submit your manuscript here:
http://www.biomedcentral.com/info/publishing_adv.asp
BioMedcentral
and unregulated dimeric type I enzymes. Biochemistry 2001, 40:13177-13187.
47. Maurus R, Nguyen NT, Stokell DJ, Ayed A, Hultin PG, Duckworth HW, Brayer GD: Insights into the evolution of allosteric prop-erties. The NADH binding site of hexameric type II citrate synthases. Biochemistry 2003, 42:5555-5565.
48. Smith MW, Neidhardt FC: 2-oxoacid dehydrogenase complexes of Escherichia coli: cellular amounts and patterns of synthesis. J Bacteriol 1983, 156:81-88.
49. Affymetrix [http://www.affymetrix.com]
50. Smyth GK: Limma: Linear models for microarray data. In Bio-informatics and computational biology solutions using R and Bioconductor Edited by: Gentleman R, Carey V, Dudoit S, Irizarry R, Huber W. New York: Springer; 2005:397-420.
51. Smyth GK: Linear models and empirical Bayes methods for assessing differential expression in microarray experiments. Stat Appl Genet Mol Biol 2004, 3:Article 3.
52. R [http://www.r-project.org]
53. Benjamini Y, Hochberg Y: Controlling the False Discovery Rate: a practical and powerful approach to multiple testing. J Royal Stat Soc Ser B 1995, 57:289-300.
54. Dennis G, Sherman BT, Hosack DA, Yang J, Gao W, Lane HC, Lem-picki RA: DAVID: Database for Annotation, Visualization, and Integrated Discovery. Genome Biology 2003, 4:Article R60. 55. Huang da W, Sherman BT, Lempicki RA: Systematic and
integra-tive analysis of large gene lists using DAVID bioinformatics resources. Nat Protoc 2009, 4:44-57.
56. Kanehisa M, Goto S, Kawashima S, Okuno Y, Hattori M: The KEGG resource for deciphering the genome. Nucleic Acids Res 2004, 32:D277-D280.
57. Livak KJ, Schmittgen TD: Analysis of relative gene expression data using real-time quantitative PCR and the method. Methods 2001, 25:402-408.
58. Bernofsky C, Swan M: An improved cycling assay for nicotina-mide adenine dinucleotide. Anal Biochem 1973, 53:452-458. 59. Gibon Y, Larher F: Cycling assay for nicotinamide adenine
dinucleotides: Nacl precipitation and ethanol solubilization of the reduced tetrazolium. Anal Biochem 1997, 251:153-157. 60. Walton AZ, Stewart JD: Understanding and improving
NADPH-dependent reactions by nongrowing Escherichia coli
cells. Biotechnol Prog 2004, 20:403-411.
61. Chin JW, Khankal R, Monroe CA, Maranas CD, Cirino PC: Analysis of NADPH supply during xylitol production by engineered Escherichia coli. Biotechnol Bioeng 2009, 102:209-220.