Open Access
Research article
Comparison of glucose tolerance in renal transplant recipients and
hemodialysis patients
Hassan Argani*
1,2, Alireza Noorazarian
3, Mohammad Rahbaninobar
2,4,
Mohammad Noori
4and Hamid T Khosroshahi
1Address: 1Nephrology Division of Emam Hospital, Tabriz university of medical sciences, Tabriz, Iran, 2Drug Applied Research Center, Tabriz university of medical sciences, Tabriz, Iran, 3Biochemistry Laboratory, Emam Hospital, Tabriz university of medical sciences, Tabriz, Iran and 4Biochemistry Division of Medical Faculty, Tabriz university of medical sciences, Tabriz, Iran
Email: Hassan Argani* - hassanargani@hotmail.com; Alireza Noorazarian - Alirezad@Hotmail.com; Mohammad Rahbaninobar - rahbanim@hotmail.com; Mohammad Noori - nourimd@yahoo.com; Hamid T Khosroshahi - drtayebikh@yahoo.com
* Corresponding author
Abstract
Background: Impaired glucose tolerance is a risk factor for atherosclerosis in hemodialysis patients and renal transplant recipients.
Methods: To check the relationship of impaired glucose tolerance with the other atherosclerotic risk factors, fasting blood sugar and the standard two hour glucose tolerance test, serum tryglyceride, serum cholesterol, cyclosporine through level (in renal tranpslant recipients) and hemoglobin A1C were measured in 55 stable renal transplant recipients, 55 hemodialysis patients and 55 healthy controls with similar demographic characteristics. Patients with diabetes mellitus and propranolol consumers were excluded. The mean age and female to male ratio were 39 +/- 7 years and 23/22, respectively.
Results: Four of the renal transplant recipients and twelve of the hemodialysis patients had impaired glucose tolerance. Significant linear correlation was observed with body mass index and IGT only in hemodialysis patients (r = 0.4, p = 0.05). Glucose tolerance also had a significant correlation with triglyceride levels (217.2 +/- 55 mg/dl in hemodialysis patients vs. 214.3 +/- 13 mg/ dl in renal transplant recipients and 100.2 +/- 18 mg/dl in control groups, p = 0.001). The glucose tolerance had significant relationship with higher serum cholesterol levels only in the renal transplant recipients (269.7 +/- 54 in renal transplant recipients vs. 199.2 +/- 36.6 mg/dl in hemodialysis and 190.5 +/- 34 mg/dl in control groups, p = 0.0001). In the renal transplant recipients, a linear correlation was observed with glucose tolerance and both the serum cyclosporine level (r = 0.9, p = 0.001) and the hemoglobin A1C concentration (6.2 +/- 0.9 g/dl). The later correlation was also observed in the hemodialysis patients (6.4 +/- 0.7 g/dl; r = 67, p = 0.001).
Conclusions: We conclude that although fasting blood sugar is normal in non-diabetic renal transplant and hemodialysis patients, impaired glucose tolerance could be associated with the other atherosclerotic risk factors.
Published: 08 September 2004
BMC Nephrology 2004, 5:11 doi:10.1186/1471-2369-5-11
Received: 10 February 2004 Accepted: 08 September 2004
This article is available from: http://www.biomedcentral.com/1471-2369/5/11
© 2004 Argani et al; licensee BioMed Central Ltd.
Background
Mortality and morbidity due to cardiovascular diseases are frequent in patients with diabetes mellitus and high prevalence of diabetes and cardiovascular disease, also, are observed in patients with end-stage renal disease treated by renal replacement therapy, either renal trans-plantation (RT) and dialysis [1]. Although uremia is typi-cally associated with impaired glucose metabolism via multiple mechanisms [2-4], hemodialysis improves, although not completely, the uremic induced glucose impairment [5-7]. Impaired glucose metabolism is also a common and an important problem after RT. By improve-ment of immunosuppression after RT, the incidence of post transplant diabetes (PTDM) has been decreased from 41% to 2.5% [8,9]. Although we routinely screen and treat only full-blown diabetes at the post transplant periods, an overlooked aspect is the impaired glucose tolerance, which may be a risk factor to induce atherosclerosis. Impaired glucose tolerance de novo, may be a risk factor of post-transplantation mortality and morbidity [10]. Although increased levels of glycosylated hemoglobin (HbA1C) and lipid concentrations have been shown in hemodialysis patients [11] and renal transplant recipients [12] with diabetes, their impairment is not clear in the both groups with impaired glucose tolerance without apparent diabetes mellitus. In this study we investigated glucose tolerance and lipid profiles in non-diabetic hemo-dialysis and renal transplant patients.
Methods
We selected fifty five RT recipients with more than one year of good renal allograft function (serum Cr < 1.5 mg/ dl), under conventional triple therapy composed of cyclosporine A (CsA), azathiopurine and prednisolone. Their allograft sources were living donors. Fifty five stable HD patients and another fifty five healthy controls (C), were also enrolled in this study. The mean age (39 ± 7 years), sex (F/M ratio was 33/22), body mass index (BMI) 24.7 ± 1.28 kg/m2) were similar in the three groups (see
table 1). Patients with diabetes mellitus and propranolol consumers were excluded.
The levels of serum triglyceride, cholesterol (measured by enzymatic spectrophotometry)[13], CsA (measured by ELISA in whole blood, only in renal transplant recipients) and glycosylated haemoglobin concentration (Hb A1c) (measured by column chromatography) were measured after 10 hours fasting (in the hemodialysis group, in the early morning before hemodialysis). Fasting blood sugar and the standard 2 hours glucose tolerance test (after ingestion of 75 g of glucose) were detected in the three groups by spectrophotometry. Statistical analysis was per-formed by Kuruskal wallis, U-Mann Whitney, multiple comparison and regression correlation coefficient tests, using SPSS 10.05.
Results
On the basis of WHO classification [14], four of our (7.5%) renal transplant recipients and twelve (22%) of
GTT has a linear relationship with BMI in hemodialysis patients
Figure 1
GTT has a linear relationship with BMI in hemodialysis patients. Impairment of GTT is more significant in the hemo-dialysis patients with higher BMI. Gtt2 = glucose tolerance test at the second hours of 75 gr oral glucose. bmih = body mass index in hemodialysis patients
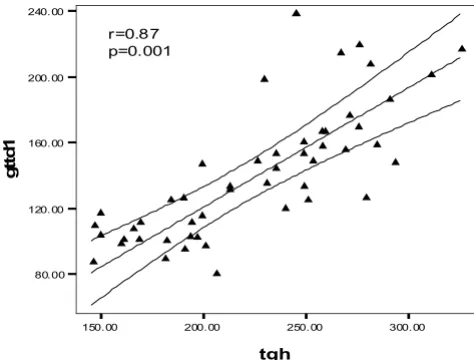
The glucose tolerance in the HD patients had a significant lin-ear correlation with the level of serum triglycerides
Figure 2
The glucose tolerance in the HD patients had a significant lin-ear correlation with the level of serum triglycerides. gttd1= glucose tolerance test in dialysis patients, tgh= serum con-centration of triglyceride in hemodialysis patients.
150.00 200.00 250.00 300.00 tgh
80.00 120.00 160.00 200.00 240.00
g
tt
d
1
䉱
䉱
䉱
䉱
䉱
䉱 䉱
䉱 䉱
䉱 䉱
䉱 䉱
䉱
䉱
䉱
䉱
䉱 䉱
䉱
䉱 䉱
䉱 䉱
䉱
r=0.87 p=0.001
䉱
䉱 䉱
䉱
䉱
䉱
䉱
䉱
䉱
䉱䉱 䉱 䉱
䉱 䉱
䉱 䉱
䉱 䉱
䉱 䉱 䉱
䉱 䉱
䉱
6 0 . 0 0 8 0 .0 0 1 0 0 . 0 0 1 2 0 . 0 0 1 4 0 . 0 0 1 6 0 . 0 0 1 8 0 . 0 0
2 2 . 0 0 2 3 . 0 0 2 4 . 0 0 2 5 . 0 0 2 6 . 0 0 2 7 . 0 0
b m i h
the hemodialysis patients had impaired glucose tolerance, i.e. the 2 hour of glucose tolerance test was between 140 and 200 mg/dl. It was more obvious at the end of the sec-ond hour of GTT. Although BMI was roughly similar in the three groups (Table 1), a significant linear correlation was observed between BMI and impaired glucose toler-ance only in HD patients (r = 0.4, p = 0.05) (fig 1), but not in the RT recipients. The glucose tolerance (especially at the first hour) in the HD patients had a significant linear correlation with the level of serum triglycerides (r = 0.87, p = 0.001) (Fig 2). Serum triglyceride concentration was 217.2 ± 55 mg/dl in HD vs. 214.3 ± 13 mg/dl in RT and 100.2 ± 18 mg/dl in C groups, (p = 0.001). On the other hand the four RT recipients with IGTT (i.e. 100% of RT recipients with IGTT) had the higher serum cholesterol
levels (308.4 ± 24.4 mg/dl)) compared with the remain-ing RT recipients with normal GTT (248.7 ± 55.6 mg/dl) with p = 0.031 (table 2). The mean of serum cholesterol was 269.7 ± 54 mg/dl in RT vs. 199.2 ± 36.6 mg/dl in HD and190.5 ± 34 mg/dl in C groups (p = 0.0001). A linear correlation was observed between impaired GTT and both of the serum Cyclosporine level (r = 0.9, p = 0.001) and HbA1c in RT recipients (Fig 3). The mean of HbA1c was 6.2 ± 0.6 gr/dl in the RT recipients with normal GTT vs. 4.34 ± 0.26 g/dl in the RT recipients with IGGT (p < 0.001, table 2). The later correlation was also observed in HD patients, in whom the mean of HbA1C level was 6.4 ± 0.7 gr/dl in the group (r = 67, p = 0.001). In contrast of a close relationship of IGTT and higher HbA1c, the gender, age, times after transplantation and BMI did not impact on
Cyclosporine level and HbA1c have correlations with the IGTT in RT recipients
Figure 3
Cyclosporine level and HbA1c have correlations with the IGTT in RT recipients ▲ = Serum Cyclosporine level ❍ = HbA1c concentration
240.00 260.00 280.00 300.00 320.00 340.00 360.00 380.00 cyclosporin
5.00 5.50 6.00 6.50 7.00 7.50 8.00
80.00 100.00 120.00 140.00 160.00 180.00 200.00 220.00 HbA1c (gr/dl) Cyclosporine level (mg/dl)
Insulin Glucose Tolerance
Table 1: Demographical, biochemical, hematological and therapeutical factors in hemodialysis patients and renal transplant recipients.
HD RT Control
Age (years) 48 ± 3 46 ± 4 47 ± 4 Male/female ratio 33/22 33/22 33/22 BMI (Kg/m2) 24.6 ± 1.4 23.8 ± 1.2 23.6 ± 1.3
Cholesterol (mg/dl) 199.2 ± 36.6 269.7 ± 54 190.5 ± 34 Triglycerides (mg/dl) 217.2 ± 55 214.3 ± 13 100.2 ± 18 HgA1C (g/dl) 6.42 ± 0.7 6.2 ± 0.9 5.7 ± 0.7 Hb level 10.9 ± 0.8 12.4 ± 1.1 13.3 ± 0.8 Therapy with vitamin D3 0.5 µg/day (number) 25 -- --Impaired glucose tolerance (number) 12* 4**
--*Significant correlation with BMI, serum triglycerides and HgA1C
IGTT in RT recipients. Although in logistic regression anal-ysis higher serum level of cyclosporine was correlated with increased GTT impairment, we could not evaluate the implication of corticosteroids on this test, because all of the 55 RT recipients were received prednisolone at a doses of 5 to 10 mg/day.
Discussion
Impaired glucose tolerance occurs in about 50% of patients with chronic renal failure (CRF) patients. It is due to multiple factors, which the two most important of them being insulin resistance at target organs and impaired insulin secretion from the pancreas [15]. Insulin sensitivity would be reduced by up to 60% in non-dia-betic patients with CRF before dialysis [16]. Marked improvement in insulin sensitivity and consequently glucose tolerance has been reported in non-diabetic patients after 10 weeks of HD, although they are not com-pletely returned to normal [15]. Thereby, impaired glu-cose tolerance during HD is secondary to non-effective removable toxins by HD compared with peritoneal dialy-sis. In the latter more effective removal of middle mole-cule toxins causes better glucose tolerance, although glucose rich dialyzet solution is used [16]. The other causes of impaired glucose tolerance in HD patients may be secondary to metabolic disturbances, such as anemia [17], malnutrition [18] and vitamin D3 deficiency [19]. Although all of our HD patients had normochromic-nor-mocytic anemia, the severity was not proportionate with impaired glucose tolerance (The data has not been shown). The patients were well nourished and were under treatment with daily oral vitamin D3 (Rocaltrol), 0.5 micrograms per day. So malnutrition and vitamin D3 deficiency could not to contribute to impaired glucose tol-erance in our HD patients. Impaired glucose toltol-erance was also observed in 7.5% of our RT recipients. All of the pre-sumed risk factors for post transplant diabetes mellitus
such as old age [18], family history of any known diabetes mellitus in their first relatives[21], cadaveric allografts [22] and obesity did not exist in the patients. Previously Boudreaux et al. [23] reported that those patients who weighed more than 70 kg had a higher incidence of post transplant diabetes mellitus (PTDM). A relative risk of 1.4 for developing PTDM for every 10 kg increase in body weight more than 60 kg has been shown [12]. Although in our study obese patients (BMI > 30 kg/m2) were not included in the both groups, a correlation was observed between impaired glucose tolerance and higher BMI in our HD patients. In RT recipients, the major risk factor for impaired glucose tolerance was immunosuppressive ther-apy. Through using higher doses of CsA and corticoster-oids, PTDM was previously more common, but the complication has been decreased to 2–5% in FK506-based immunosuppressive protocols [24,25]. Although this relatively uncommon complication is a major cause of post-transplant mortality and morbidity, even minor glucose intolerance is associated with an increased long-term risk for cardiovascular disease [26]. The importance of impaired glucose tolerance should not be underesti-mated in these patients with high risk of atherosclerosis. Hyperlipidemia, another risk factor for atherosclerosis, on one hand accompanies the impaired glucose tolerance observed in the HD and RT patients and on the other hand increases the risk of atherosclerosis induced by impaired glucose tolerance. As reported previously, a ten-dency to higher pre-transplantation serum triglyceride concentration was associated with post-transplantation impaired glucose tolerance [27].
Hypertriglyceridemia is common complication in dialysis patients. In non-transplant populations it is regarded (along with low HDL cholesterol levels) as a prominent feature of insulin resistance syndrome, and also is a cardi-ovascular risk factor in organ transplant recipients [28].
Table 2: Impaired glucose tests in HD and RT recipients have higher values of serum triglyceride, serum cholesterol and cyclosporine concentration than patients with normal glucose tolerance tests.
no. of cases Serum
Triglyceride(mg/dl)
Serum Cholesterol(mg/dl)
HbA1c (gr/l) Cyclosporine (mg/dl)
RT recipients with IGTT
4 231.4 ± 150 308.4 ± 24.4 7.34 ± 0.26 320.4 ± 36.6
RT Recipients With normal GTT
51 201 ± 75 248.7 ± 55.6 6.2 ± 0.6 295.1 ± 29
P = 0.59 P = 0.02 P = 0.001 P = 0.2
HD patients with IGTT
12 272.1 ± 41.3 201.1 ± 39 7 ± 1
HD patients with normal GTT
43 195.9 ± 45 198.5 ± 36.8 5.9 ± 0.7
P = 0.001 P = 0.87 P = 0.007
Our study confirmed the relationship between impaired glucose tolerance and triglyceride levels in HD patients, and between impaired glucose tolerance and cholesterol levels in RT recipients. The latter was also accompanied by a higher level of HgA1C. Commonly used tests of HgA1C may be unreliable in patients with end-stage renal disease because of the presence of anemia, shortened red blood cell survival, and assay interferences from uremia. But HgA1C in the range of 6% to 7%, as was found in our study, estimates glycemic control within the range of patients without severe renal impairment [1]. So in the range of mild to moderate increased HgA1C in HD and uremic patients, it would be a reliable marker of impaired glucose tolerance.
Conclusions
There was increased HgA1C and impaired glucose toler-ance in HD and RT patients. This was accompanied by hyperlipidemia in HD patients (with hypertriglyceri-demia) and RT recipients (with hypercholesterolemia). The impact upon the progression of atherosclerosis needs more study in haemodialysis and renal transplant popula-tions at a long term follow up.
Competing interests
None declared.
Authors' contributions
HA reviewed the literatures and wrote the manuscript and also helped to do statistical analysis, AN performed GTT and the other biochemical markers, MN participated as coordinator between laboratory and clinic, HTK selected the patients and collected data
Acknowledgments
We acknowledge from laboratory division of Emam hospital in Tabriz uni-versity of medical sciences for its cooperation
References
1. Joy MS, Cefalu WT, Hogan SL, Nachman PH: Long-term glycemic control measurements in diabetic patients receiving hemodialysis.Am J Kidney Dis 2002, 39:297-307.
2. Mak RH, DeFronzo RA: Glucose and insulin metabolism in uremia.Nephron 1992, 61:377-382.
3. Androgue HJ: Glucose hemostasis and the kidney. Kidney Int
1992, 42:1266-1282.
4. Alverstrand A: Carbohydrate and insulin metabolism in renal failure.Kidney Int 1997, 52(suppl 62):S48-S52.
5. Schmitz O: Insulin mediated glucose uptake in nondialysed and dialysed uremic insulin dependent diabetic subjects. Dia-betes 1985, 34:1152-1159.
6. Graf H, Prager R, Koverik J, Luger A, Schernthaner G, Pingerra WF:
Glucose metabolism and insulin sensitivity in patients on chronic hemodialysis.Metabolism 1985, 34:974-977.
7. Oshida Y, Sato Y, Shiraishi S, Sakamoto N: Studies on glucose tol-erance in chronic renal failure: estimation of insulin sensitiv-ity before and after initiation of hemodialysis. Clin Nephrol
1987, 28:35-38.
8. Gunnarson R, Arner P, Lundgren G: Steroid diabetes after trans-plantation: a preliminary report. Scand J Urol Nephrol 1977,
42(Suppl):191.
9. Rao M, Jacob CK, Shastry JC: Post renal transplant diabetes mel-litus-a retrospective study. Nephrol Dial Transplant 1992,
7:1039-1042.
10. DeFronzo RA, Smith JD: Is glucose intolerance harmful for the uremic patient?Kidney Int 1985:S88-97.
11. Paisey R, Banks R, Holton R, Young K, Hopton M, White D, Hartog M: Glycosylated haemoglobin in uraemia. Diabet Med 1986,
3:445-8.
12. Cosio FG, Pesavento TE, Osei K, Henry ML, Ferguson RM: Post transplant diabetes mellitus: increasing incidence in renal allograft recipients transplanted in recent years.Kidney Int
2001, 59:732-737.
13. Burtis CA, Ashwood RA: in Textbook of clinical chimestry 3rd edition. W.B. Saunders; 1999:840-843.
14. American Diabetes Association: Clinical Practice recommendations.Diabetes Care 1998, 21(suppl):1.
15. Mak RH: Impact of end-stage renal disease and dialysis on gly-cemic control.Semin Dial 2000, 13:4-8.
16. Mak RH: Insulin resistance in uremia. Pediatr Res 1996,
40:304-308.
17. Mak RH: The effect of erythropoietin on insulin, amino acid and lipid metabolism in uremia.J Pediatr 1996, 129:97-104. 18. Church JM, Hill GL: Impaired glucose metabolism in surgical
patients improved by intravenous nutrition: assessment by euglycemic-hyperinsulinemic clamp. Metabolism 1988,
37:505-509.
19. Mak RH: 1,25 dihydroxycholecalciferol corrects glucose intol-erance in hemodialysis patients.Kidney Int 1992, 41:1049-1054. 20. Vesco L, Busson M, Bedrossian J, Bitker MO, Heisse C, Lang P:
Dia-betes mellitus after renal transplantation: Characteristics, outcome, and risk factors.Transplantation 1996, 61:1475-1478. 21. Hathaway DK, Tolley EA, Blakely ML, Winsett RP, Gaber AO:
Devel-opment of an index to predict post-transplant diabetes mellitus.Clin Transplant 1994, 7:330-338.
22. Sumrani NB, Delaney V, Ding Z, Davis R, Daskalakis P, Friedman EA, Butt KM: Diabetes mellitus after renal transplantation in the cyclosporine era – An analysis of risk factors.Transplantation
1991, 51:343-347.
23. Boudreaux JP, Mc Hugh L, Canafax DM: The impact of cyclosporine and combination immunosuppression on the impact of posttransplant diabetes in renal allograft recipients.Transplantation 1987, 44:376-381.
24. Mayer AD, Dmitrewski J, Squifflet J-P, Besse T, Grabensee B, Klein B, Eigler FW, Heemann U, Pichlmayr R, Behrend M, Vanrentergham Y, Donck J, van Hooff J, Christiaans M, Morales JM, Andres A, Johnson RW, Short C, Buchholz B, Rehmert N, Land W, Schleibner S, For-sythe JL, Talbot D, Neumayer HH, Hauser I, Ericzon BG, Brattstrom C, Claesson K, Muhlbacher F, Pohanka E: Multi-center rand-omized trial comparing tacrolimus (FK506) and cyclosporine in the prevention of renal allograft rejection: A report of the European Tacrolimus Multicenter Renal Study Group.Transplantation 1997, 64:436-443.
25. Vincenti F, Laskow DA, Neylan JF, Mendez R, Matas AJ: One-year follow-up of an open-label trial of FK506 for primary kidney transplantation: A report of the US Multicenter FK506 Kid-ney Transplant Group.Transplantation 1996, 61:1576-1581. 26. Dysglycaemia and risk of cardiovascular disease.Lancet 1996,
347:949-950.
27. Maes BD, Kuypers D, Messiaen T, Evenepoel P, Mathieu C, Coose-mans W, Pirenne J, Vanrenterghem YF: Posttransplantation Dia-betes Mellitus in FK-506-Treated Renal Transplant Recipients: Analysis of Incidence and Risk Factors. Transplan-tation 2001, 72:1655-1661.
28. Alberti KG, Zimmet PZ: Definition, diagnosis and classification of diabetes mellitus and its complications. Part 1. Diagnosis and classification of diabetes mellitus. Provisional report of a WHO consultation.Diabetic Med 1998, 15:539-553.
Pre-publication history
The pre-publication history for this paper can be accessed here: