R E S E A R C H
Open Access
A wavelet-based ECG delineation algorithm for
32-bit integer online processing
Luigi Y Di Marco
*and Lorenzo Chiari
* Correspondence: luigiyuri. [email protected]
Biomedical Engineering Group, Department of Electronics, Computer Science and Systems (DEIS), University of Bologna, I-40136 Bologna, Italy
Abstract
Background:Since the first well-known electrocardiogram (ECG) delineator based on Wavelet Transform (WT) presented by Liet al.in 1995, a significant research effort has been devoted to the exploitation of this promising method. Its ability to reliably delineate the major waveform components (mono- or bi-phasic P wave, QRS, and mono- or bi-phasic T wave) would make it a suitable candidate for efficient online processing of ambulatory ECG signals. Unfortunately, previous implementations of this method adopt non-linear operators such asroot mean square(RMS) or floating point algebra, which are computationally demanding.
Methods:This paper presents a 32-bit integer, linear algebra advanced approach to online QRS detection and P-QRS-T waves delineation of a single lead ECG signal, based on WT.
Results:The QRS detector performance was validated on the MIT-BIH Arrhythmia Database (sensitivity Se = 99.77%, positive predictive value P+ = 99.86%, on 109010 annotated beats) and on the European ST-T Database (Se = 99.81%, P+ = 99.56%, on 788050 annotated beats). The ECG delineator was validated on the QT Database, showing a mean error between manual and automatic annotation below 1.5 samples for all fiducial points: P-onset, P-peak, P-offset, QRS-onset, QRS-offset, T-peak, T-offset, and a mean standard deviation comparable to other established methods. Conclusions:The proposed algorithm exhibits reliable QRS detection as well as accurate ECG delineation, in spite of a simple structure built on integer linear algebra.
Background
The electrocardiogram (ECG) is the recording of the electrical activity of the heart by means of electrodes placed on the body surface. It is the most commonly used non-invasive test in primary care for heart rate and rhythm-related abnormalities detection [1,2]. In recent years the interest for the ECG signal analysis has extended from clinical practice and research to disciplines such as cognitive psychophysiology [3,4], physical training [5,6] and rehabilitation [7].
Many non-diagnostic applications do not require the full 12-lead setup of clinical ECG, employing a limited number of electrodes. In some cases a single lead setup, requiring only three electrodes, is sufficient. Such applications focus on ambulatory ECG monitoring, namely in unconstrained conditions, in which subjects perform nor-mal activities as in their daily life [4], [8-10].
Ambulatory ECG analysis requires processing of signals which are affected by consid-erable noise, mainly caused by electrode motion and muscular activity, more promi-nently than in resting ECG recordings, and by power-line coupling. Moreover, emerging wearable technologies for ambulatory ECG monitoring have limited proces-sing resources and low power budget.
Clinical information on the cardiac beat is carried by the waveforms appearing on the electrocardiogram, namely: QRS-complex and P, T, U, waves. Their amplitudes and relative time intervals provide insight on heart rhythm abnormalities and heart dis-ease such as ischemia and myocardial infarction. Electrocardiogram delineation is the automatic process of determining such amplitudes and time intervals.
Performing an accurate delineation is quite a challenging task, for many reasons. For example, the P wave is characterized by low amplitude and may be masked by elec-trode motion or by muscular noise. The P and T waves may be biphasic, which increases the difficulty to accurately determine their onset or offset. Moreover, some arrhythmic beats may not contain all the standard ECG waves, for example the P wave may be missing, while in accelerated heart rate patterns, it might be partially over-lapped to the T wave of the previous beat.
The first stage of ECG delineation is devoted to detecting the QRS-complex, which in most cases is the most pronounced wave of the heart cycle. Subsequent processing locates P, QRS-complex and T waves fiducial points (onset, peak, offset).
The cyclic nature of the ECG signal and its spectral components, which mainly appear in well-known and distinguishable frequency bands, make ECG a suitable can-didate for multi-resolution decomposition by means of wavelet transforms [11,12]. Methods based on wavelet transforms have been proposed by numerous authors [13-18], building on the first well-known ECG delineator proposed by Li et al.[19].
Unfortunately, most of these ECG delineation algorithms adopt non-linear operators such as root mean square(RMS) or floating point algebra, which are computationally demanding. The work by Sovilj et al.[17] presents a real-time implementation of QRS detection and P wave delineation, though no validation on standard databases is pro-vided, nor is the P wave delineation criterion explained. In [20] a WT-based algorithm for real-time QRS detection and ECG delineation is presented, though no validation is reported on delineation, and the total number of annotated beats used in the validation of QRS detection does not match the record-by-record count, as noted in [13].
The work by Boichat et al. [16] presents a real-time implementation of the offline method proposed by Martinez et al.[13], though no validation on arrhythmia data-bases (such as the MIT-BIH Arrhythmia Database) is provided. The delineation of QRS onset and QRS offset in [16] is performed on WT detail coefficients at scale 24, namely on the output of a pass-band FIR filter with a 3dB band of 4.1-13.5 Hz. More-over, the criterion adopted for the validation of the delineation algorithm is based on a 320 ms window, which exceeds the maximum tolerance (150 ms) for QRS detection accuracy allowed by the ANSI/AAMI-EC57:1998 standard.
validated on MIT-BIH Arrhythmia Database (MITDB), the European ST-T Database (EDB), and QT Database (QTDB), available from Physionet.
Methods
Wavelet Transform
The general theory on wavelet transforms for multi-resolution analysis is described in detail in [11,12], [21] and its application to ECG signal delineation is presented in [13], [19], while a review is given in [14].
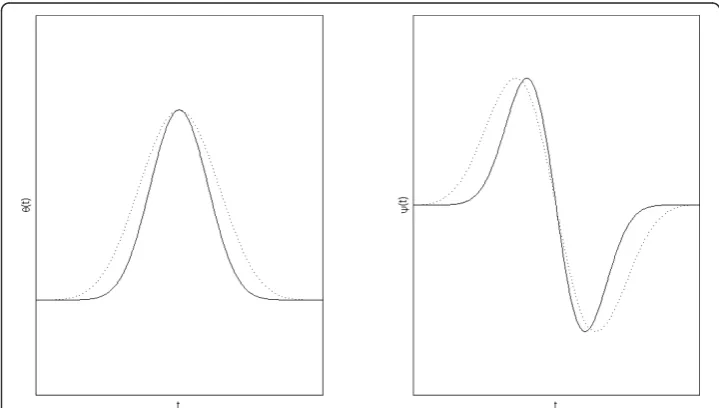
With reference to the family of spline functions of degree2r + 2proposed in [12] for the smoothing functionθ(t), in this study the 8thdegree (r= 3) was adopted. Its Four-ier transform is expressed in (1.1) and the FourFour-ier transform of the wavelet function is expressed in (1.2).
(ω) = ⎛ ⎜ ⎝sin
ω 4 ω 4
⎞ ⎟ ⎠ 8
(1:1)
(ω) =jω
⎛ ⎜ ⎝sin
ω 4 ω 4
⎞ ⎟ ⎠ 8
(1:2)
Unlike previous studies [13], [16-20] where a cubic spline smoothing function θ(t) (r = 1) was used, in this study a higher value ofr was adopted to reduce the width of the compact support and the pass-band of the equivalent filter for scales higher than 21, to improve frequency band separation across scales. However, the number of filter taps increases withr, therefore a tradeoff should be determined between computational effort and delineation performance.
Figure 1 shows the smoothing function θ(t)and wavelet function ψ(t) for r= 1 and
r = 3. The compact support of the smoothing (scaling) function decreases in width as
r increases.
The low-pass filter H and high-pass filter Gderived from (1.1) and (1.2) can be expressed as:
H(ejω) =ej
ω 2cosω
2 7
G(ejω) = 4jej
ω 2 sinω
2
(2)
whose finite impulse response hnand gn are given by the coefficients reported in Table 1.
It shall be noted that hnis symmetrical and of even length, representing a linear phase low-pass FIR filter, while gn is anti-symmetrical of even length, representing a linear phase high-pass FIR filter.
The frequency response for the filter bank generalized for any given scale can be written as:
Qk(ejω) = ⎧ ⎨ ⎩
G(ejω), k= 1
G(ej2k−1ω )·
k−2
l=0 H(ej2lω
),k≥2 (3)
The filter bank structure is illustrated in Figure 2.
The frequency response of the equivalent filtersQk in (3) is displayed in Figure 3 for the first four scales, for r= 1 (cubic spline smoothing function) and r= 3 (8thdegree spline smoothing function). For any given scale 2k, Qkpass-band narrows with increas-ingr, improving frequency separation of the filter bank across scales.
The group delay of the equivalent filter Qkmust be accounted for in multi-scale ana-lysis of discrete wavelet transform (DWT) coefficients. To match zero-crossings (and their relative modulus-maxima) across different scales, DWT coefficients must be aligned temporally.
The group delay of Qkat scale 2 k
, k >1, is given by:
τk g =
k−1
l=1 τl
g,H+τgk,G (4:1)
where:
τl
g,H=−3·2l−2 (4:2)
Table 1 Wavelet Filters Impulse Response
N hn gn
-2 1/128
-1 7/128
0 21/128 -2
1 35/128 2
2 35/128
3 21/128
4 7/128
is the group delay of the low-pass filter at scale 2l, and
τk
g,G=−2k−2 (4:3)
is the group delay of the high-pass filter at scale 2k.
According to [22,23], the energy of the main waveforms composing the ECG, namely QRS-complex, P and T waves, lies within a limited frequency range. As a consequence, a limited number of scales is required for ECG delineation. Table 2 summarizes the cutoff frequencies of Qkfilters for the scales of interest, forr= 1 andr = 3.
Description of the Algorithm
The raw ECG signal is assumed to be sampled at 250 samples/s.
The databases used for validation contain records of ECG data stored at 12-bit/ sample. Therefore, to prevent overflow in a (signed) integer implementation of the low-pass filter adopted in the filter bank, 16-bit integer capacity is not sufficient. This constitutes the only reason for adopting a 32-bit instead of 16-bit implementation. However, a 32-bit implementation also complies with input signals (raw ECG data)
) (z
H H(z2) H(z4)
) (z G
1 n
d
) (z2
G
2 n
d
n
x
) (z4
G
3 n
d
) (z8
G
4 n
d
….
Figure 2DWT filter bank. Filter bank implementation of biorthogonal dyadic wavelet transform without decimation (algorithme à trous).dknis the detail coefficient series for scale 2
k
. Inspired by [13].
with a sample resolution up to 24-bit/sample. Most, if not all, commercially available ECG front-end devices currently fall within this category. In order to comply with the largest set of such devices on the market, no assumptions are made on the amplitude resolution.
The DWT properties which the proposed method is based on are well described in [13], [19]. Based on the properties of the filter bank (2), the zero-crossings of the DWT coefficients dkncorrespond to the local maxima or minima of the smoothed
input signal at different scales, and the maximum absolute values ofdknare associated
with maximum slopes in the filtered signal [13].
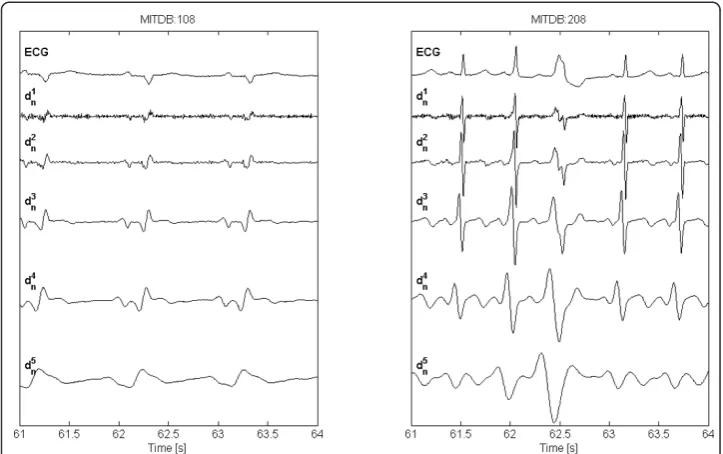
Figure 4 shows DWT detail coefficients computed by the present algorithm, for actual ECG signals (record 108 and 208, from MITDB).
At a sampling frequency of 250 samples/s, the spectral content of the ECG signal mainly falls within the first five scales of the filter bank (2). In particular, the QRS-complex is prominent at scales 22and 23while its energy decreases at increasing scales and becomes very low at scales higher than 24, while P shows high energy at scale 23 which decreases at higher ones. At scales 23 through 25 T wave has high energy, though at scale 25the baseline drift, including respiration effects, becomes prominent. For this reason, scale 25 is not considered in this study. At scales 21 and 22 small
Table 2 Wavelet Filters Bandwidth
Scale Bandwidth [Hz] (*) Bandwidth [Hz] (*) 2k 3rddegree Spline
θ(t) (r= 1) 8thdegree Spline
θ(t) (r= 3)
k = 1 62.50 - 125.00 62.50 - 125.00
k = 2 18.02 - 58.60 13.12 - 43.55
k = 3 8.36 - 27.46 5.98 - 19.99
k = 4 4.11 - 13.52 2.93 - 9.80
(*) 3 dB cut-off.
Figure 4ECG signal and DWT decomposition. Examples of ECG signals from MITDB records (resampled atFs= 250 samples/s) MITDB:108 (left), MITDB:208 (right), and DWT detail coefficientdknat scales 21
peaks in Q and S waves may show zero-crossings though at such low scales, especially scale 21, muscular noise and power-line coupling may appear.
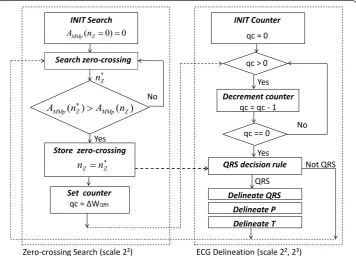
Using the information of local maxima, minima and zero-crossing at the scales of interest, the algorithm identifies for each beat the significant points of the ECG in the following steps: 1) detection of the QRS-complex; 2) QRS-complex delineation (onset, offset); 3) P wave delineation (onset, peak, offset); 4) T wave delineation (peak, offset) of the previous beat. Figure 5 displays the flow chart of the state machine for online parsing of detail coefficients d2n, for QRS detection. Unlike previous works [13], [19],
for QRS detection only two scales (22, 23) are processed.
The algorithm proposed in this work is intended for online processing, therefore it is causal: at discrete timeTi, only ECG samples at Tk≤Ti are assumed to be available.
To comply with low power budget constraints, the algorithm does not perform back-search for missed beats. The drawback is a decrease in sensitivity; the advantage is a decrease in storage memory and processing time. A memory buffer of 1 s for WT coefficients is sufficient for QRS detection, whereas the required storage size increases (depending on the inter-beat interval duration, in general no more than 1.5 s) for com-puting delineation of the T wave of the previous beat.
QRS detection
For each beat, the QRS-complex is detected using wavelet detail coefficients dkn at
scales 22 and 23. As shown in Figure 5, only scale 22 is parsed for zero-crossings. When a zero-crossing is detected, the adjacent modulus-maxima pair MMp(nZ) is
INIT Search
Search zero-crossing
No
Store zero-crossing
Yes
0 ) 0
( Z 0 0
MMp n A
) ( )
( Z MMp Z
MMp n A n
A ) A
Z Z n n
Set counter
qc = ȴWQRS
INIT Counter
qc = 0
QRS decision rule
QRS qc > 0
Yes
qc == 0
Decrement counter
qc = qc - 1
Not QRS Yes
No
Zero-crossing Search (scale 2²) ECG Delineation (scale 2², 2³)
Delineate QRS Z
n
Delineate P Delineate T
Figure 5ECG delineation state machine. State Machine flow chart for online ECG delineation. The zero-corssingnZwith the largest modulus-maxima pair amplitudeAMMp(nZ)is detected withinΔWQRS(250 ms)
at scale 22. Detail coefficientsdknat scales 22and 23are parsed for the verification of QRS candidates
determined and the associated amplitude AMMp(nZ), defined as the difference between
the positive maximum and negative minimum detail coefficients, is computed. The zero-crossing is stored and an observation window ΔWQRSof 250 ms is initialized: if a new zero-crossing nZ*is detected within this window such that AMMp(nZ*) > AMMp
(nZ), the window is reset andnZ*is stored, replacing nZ, as shown in Figure 5. The
process is iterated until a full window elapses without new candidates. The zero-cross-ing nZrepresents the QRS-candidate. The QRS-detection decision rule is defined as
follows: a window of 200 ms centred around nZis considered, and the
maximum-mini-mum difference Δd2n(nZ)of detail coefficients within such window, at scale 22, is
com-puted as follows:
d2n(nZ)≡ max n∈[nZ−W100,nZ+W100]
d2n
− min
n∈[nZ−W100,nZ+W100]
d2n (5:1)
whereΔW100represents a time interval of 100 ms expressed in units of samples. The
following condition is then tested:
d2n(nZ) > ε2QRS (5:2)
whereε2QRSis an empirically determined threshold computed as follows:
ε2
QRS= 11 32 ·
nZ
d2
n(nz)
N
(5:3)
where the summation encompasses the N (= 4) most recent QRS-candidates that satisfied (5.2). Under the assumption that the time distance between two consecutive beats is generally not longer than 2 s (corresponding to a heart rate of 30 beats/min), it takes not more than 8 s to collect N (= 4) confirmed candidates. For this reason, a learning period of 8 s is allowed before the algorithm outputs any detected beats.
If (5.2) is met, the decision process proceeds to the next step considering scale 23:
d3n≡ max
n∈[nZ−W100,nZ+W100]
d3n
− min
n∈[nZ−W100,nZ+W100]
d3n (5:4)
d3n > ε3QRS (5:5)
whereε3QRSis an empirically determined threshold computed as in (5.3), for scale 23.
It shall be noted that, in (5.4),nspans the same window as in (5.1). Coefficients across different scales are time-aligned by accounting for the group delay computed in (4.1).
If (5.2) and (5.5) are met, the QRS-candidate is confirmed, and thresholdsε2QRSand
ε3
QRSare updated. Then, if the learning period is expired, the zero-crossing is marked
as the local peak (fiducial point) of a QRS-complex, and the algorithm proceeds for the delineation of P, QRS, T waves. It shall be noted that thresholds ε2QRS andε3QRS
extreme conditions such as lead-fail, cardiac arrest, poor signal-to-noise ratio, in which a longer time is required.
QRS delineation
QRS delineation is performed at scale 22. After detecting the QRS-complex, the QRS onset fiducial point is determined starting from the position npreof the modulus
maxi-mum preceding the zero-crossingnZof the QRS-complex at scale 22.
The following thresholds are defined, based on locald2ncoefficient values:
ε2
Q on,I=
d2
n pre+d2n post 32
ε2
Qon,II=
d2n pre+d2n post
16
(5:6)
wherenpostis the sample index of the modulus maximum followingnZ. The
delinea-tion algorithm searches back from nprefor negative minima or positive maxima, and
stores the first crossing of the thresholdε2Qon, I to be assigned to QRS onset in case
no modulus maxima are found within a fixed size window of 120 ms precedingnpre.
The algorithm stops when a modulus maximum is detected whose amplitude is lower than the thresholdε2Qon,II, or the end of the search window has been reached. If
at least one modulus maximum is found, a new threshold is defined:
ε2
Q on,III=
d2n left
4 (5:7)
where nleft is the sample index at which d2nhas its left-most modulus maximum.
The algorithm searches back from nleft until the first crossing of the new threshold
ε2
Qon,III or the end of the fixed-size window is reached. The value is assigned to QRS
onset. The symmetrical criterion is adopted for the determination of QRS offset, start-ing from the position npostof the modulus maximum following the zero-crossingnZ.
The threshold used for QRS offset delineation are:
ε2
Q off,I=
d2
n post 4
ε2
Qoff,II=
d2
n post 8
ε2
Qoff,III=
d2
n right 4
(5:8)
wherenright is the sample index of the right-most modulus maximum followingnpost
whose amplitude exceeds thresholdε2Qoff,II.
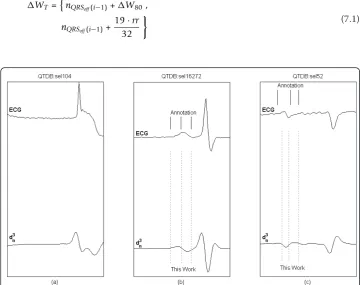
Figure 6 shows examples of different QRS morphologies from QTDB records, the related manual annotations and the automatic delineation markers.
P wave delineation
sub-portion of the window excluding the first (left-most) 100 ms which are only used for determining P onset. The zero crossing nZwith maximizesAMMp(nZ)is marked as
P wave dominant peak. To determine the mono- bi-phasic morphology of the P wave, specific conditions are tested:
1 2
d3n post ≤d3n pre≤2d3n post (6:1)
where |d3n pre| is the modulus maximum preceding the zero-crossingnZ, at scale 23,
and |d3n post| is the modulus maximum following nZ. If (6.1) is verified, and a
zero-crossing nLZprecedingnZis available within a distance of 100 ms, (6.1) is tested also
for nLZ. If such condition is verified, the following is also tested:
AMMp(nLZ)> 3
4AMMp(nZ) (6:2:1)
If (6.1) and (6.2.1) are verified fornLZ, the P wave is considered to be bi-phasic and
npre is defined as the sample corresponding to the left-most modulus maximum of
MMp(nLZ)otherwisenpre is defined as the sample corresponding to the left-most
mod-ulus maximum ofMMp(nZ).
The same procedure is adopted in the search of nRZfollowingnZwithin a distance of
100 ms. If (6.1) is verified fornRZ, the following condition is tested:
AMMp(nRZ)> 3
4AMMp(nZ) (6:2:2)
If (6.1) and (6.2.2) are verified for nRZ, the P wave is considered to be bi-phasic and
npostis defined as the sample corresponding to the right-most modulus maximum of
MMp(nRZ)otherwise npostis defined as the sample corresponding to the right-most
modulus maximum ofMMp(nZ).
The sample nprebecomes the starting point for searching back the first crossing of a
threshold:
ε3
P on=
d3n pre
4 (6:3)
If such crossing point is found within the search window, it is assigned to P onset. The algorithm then searches for P offset, namely the estimated end of P, adopting the same procedure described for P onset. The threshold adopted is:
ε3
P off = 35·d3
n post
64 (6:4)
If P onset, peak and offset are found within the search window, P wave delineation result is positive, otherwise the algorithm declares that P wave could not be delineated for the given beat.
Figure 7 shows examples of P morphologies from QTDB records, the related manual annotations and the automatic delineation markers.
T wave delineation
T wave delineation is performed at scale 23. The following possible morphologies are handled: positive (+), negative (-), biphasic (+/- or -/+), upward and downward. At each identified QRS-complex, T wave is delineated for the previous beat. The search is done over a window defined as:
WT=
nQRSoff(i−1)+W80,
nQRSoff(i−1)+ 19·rr
32
(7:1)
wherenQRS off (i-1)denotes the sample of the QRS offset of the previous beat
(assum-ing the ithbeat is the latest detected), rr is the distance in units of samples between the ith and the (i-1)thQRS fiducial point, and ΔW80represents an interval of 80 ms
expressed in units of samples. The T wave dominant peak is searched within a sub-window ofΔWT:
WTPK =
nQRSoff(i−1)+W80,
nQRSoff(i−1)+
rr
2
(7:2)
WithinΔWT PKall zero-crossings are stored. A zero-crossingnZis considered to have
a positive (negative)slopeif the first non-zero detail coefficient precedingnZis negative
(positive), and the first non-zero detail coefficient followingnZis positive (negative). For
zero-crossingsnZwith negative (positive) slopes, the maximum (minimum) valueMn pre
of positive (negative)d3ncoefficients precedingnZis stored, together with the minimum
(maximum) valueMn postof negative (positive)d3ncoefficients followingnZ. The
abso-lute value of the differenceΔMM(nZ)betweenMn preandMn postis computed and the
zero-crossingnZwith the highest value is considered. If an adjacent zero-crossingnLZto
the left ofnZexists and the following condition is met:
MM(nLZ)> 51
64MM(nZ) (7:3)
then the T wave is considered biphasic,nLZis marked as T wave dominant peakTpk,
nZis marked as the endToff of the dominant wave (i.e. the wave whose peak is
sur-rounded by the largest slopes), and the bi-phasic T wave end Tendis searched to the
right ofnpostfollowing nZ.Tendis then assigned to the first sample for whichd3nfalls
below a thresholdε3Tenddefined as:
ε3
T end= 19·d3
n post
64 (7:4)
If nLZdoes not exist or (7.3) is not verified, nZis marked asTpk, and the search
pro-ceeds to the right of npostfollowing nZ. Toff is assigned to the first sample for which
d3nfalls below a thresholdε3Toff, defined as;
ε3
T off =
19·d3n post
64 (7:5)
where npost refers tonZ. If an adjacent zero-crossing nRZexists to the right of nZ,
such that:
MM(nRZ)≥ 1
2MM(nZ) (7:6)
the T wave is considered to be bi-phasic andTendis defined as the first sample for
which d3nfalls below the threshold in (7.4) wherenpostnow refers tonRZ.
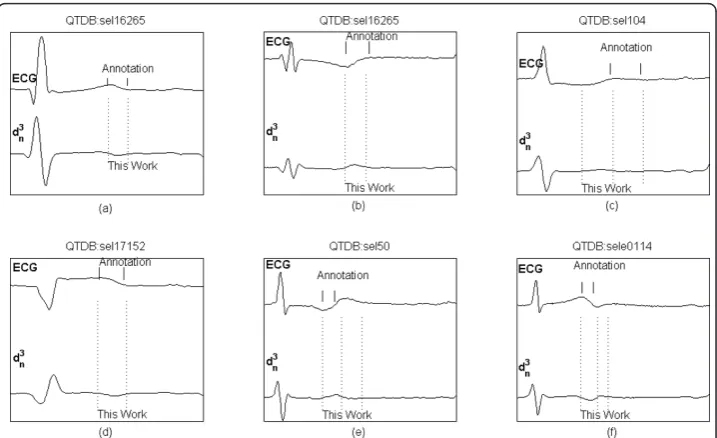
Figure 8 shows examples of various T wave morphologies from QTDB records, the related manual annotations and the automatic delineation markers.
Validation
(EDB), whereas the P-QRS-T delineation algorithm was validated on the QT Database (QTDB).
The MITDB database includes a selection of Holter recordings covering a broad spectrum of arrhythmias.
The EDB database contains annotated excerpts of ambulatory ECG recordings with a representative selection of ECG abnormalities including ST segment displacement and cardiac axis shifts.
The QTDB database contains records from MITDB and EDB, and from several other databases (Normal Sinus Rhythm, ST Change, Supraventricular Arrhythmia, Sudden Death, Long Term Recordings). This database was created for validation of waveform boundaries and contains annotations by cardiologists for at least 30 beats per record, including QRS-complex, P, T, U waves delineation.
For the QRS detector validation on MITDB and EDB, the first ECG channel was used and, for MITDB only, raw data were resampled at 250 samples/s before processing.
For the validation on QTDB, reference annotations of first cardiologist (q1c files from QTDB) were used in this work. Records from this database are sampled at 250 samples/s, therefore no resampling was required.
Table 3 summarizes the databases used for validation.
Figure 8Delineation of T wave. Examples of T waves from QTDB records, with manual annotations (top) and delineated characteristic points (bottom): dominant T peak, dominant T offset, T end. (a) positive T wave, (b) negative T wave, (c) upward T wave, (d) downward T wave, (e) and (f) bi-phasic T wave.
Table 3 Databases used for validation
Database #Annotated Beats Records Record Duration
MITDB 109010 48 30 min
EDB 788050 90 120 min
To assess QRS detection performance, sensitivity (Se) and positive predictive value (P+) were calculated:Se= TP/(TP+FN) where TP is the total number of true positives identi-fied in the given record, FN is the total number of false negatives;P+= TP/(TP+FP) where FP is the total number of false positives.
A true positive is achieved when the time difference between the given annotated beat and the detected beat is not greater than 150 ms, in compliance with ANSI/ AAMI-EC57:1998 standard.
For the validation of ECG delineation on QTDB, the metrics proposed in [13], [16] was adopted, where mis the mean value of the errors intended as the time difference between automatic and reference annotation, for all annotations, and sis the average standard deviation of the error, calculated by averaging the intra-recording standard deviations.
For each fiducial point delineation, the ECG channel with the least error was chosen, as in [13], [16]. Sensitivity was calculated for each characteristic point, for P wave, T wave and QRS-complex, separately. For T wave, manual annotations peak and T-offset, are matched to TpkanToffas defined in the delineation method, respectively.
A true positive is achieved when the wave is annotated and the delineation process detects the presence of such wave within a time distance not greater than 150 ms. (in [16] a window of 320 ms is used, in [13] the window size is not reported). A false posi-tive occurs when the delineation process locates a characteristic point which was not annotated. A false negative is considered when the delineation process fails to locate the annotated fiducial point within the above mentioned tolerance of 150 ms. Positive predictive value could not be calculated, as noted in [13]: when there is no annotation it is not possible to determine whether the cardiologist considered that there was no waveform to annotate or was not confident in annotating it (perhaps because of the noise level). Nevertheless, for points other than the QRS delineation,P+ was calculated under the assumption that an absent mark in the annotated beat means that there is no waveform. As a result, the calculatedP+ can be interpreted as a lower limit (P+min) of the actual one.
Results
QRS detection
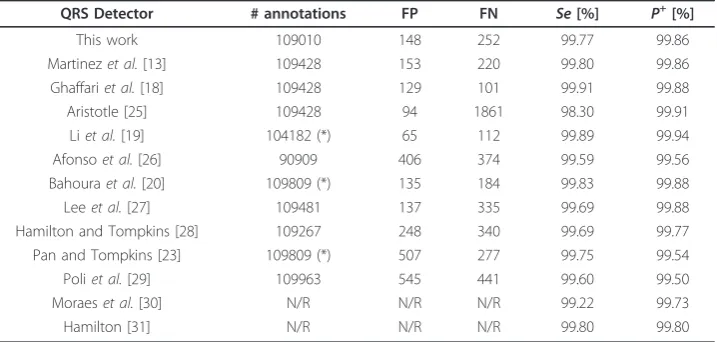
Table 4 and Table 5 show the QRS detector performance on MITDB and EDB data-bases, respectively. Results are compared to previous studies. As in [13] segments with ventricular flutter in record 207 of MITDB (for an overall length of approximately 2 min 20 s) and those marked as unreadable (in the pertaining annotation file) in EDB, were excluded.
ECG delineation
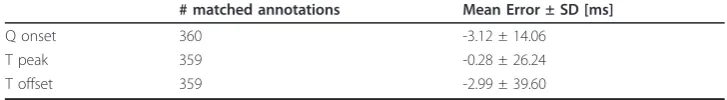
made on different experts annotations, is also reported in the bottom row of the table. Table 7 shows inter-cardiologist annotations variability calculated on the QTDB records that were annotated by two different cardiologists. Unfortunately, only eleven records include double annotations, and only for QRS and T wave, not for P wave.
Discussion
The proposed algorithm performs online QRS detection as well as P, QRS, T waves delineation. Unlike previous DWT based methods [13], [16], [19], the present only uses two scales (22, 23), for both QRS detection and ECG delineation. The QRS detec-tion showed an excellent performance on the MIT-BIH Arrhythmia Database, achiev-ing a sensitivity of 99.77% and a positive predictive value of 99.86% on 109010 annotated beats, and on the European ST-T Database, achieving a sensitivity of 99.81% and a positive predictive value of 99.56% on 788050 annotated beats. Sensitivity and positive predictive value reported for the ST-T database are the highest among pre-vious works, as shown in Table 5.
The validation on the QT Database showed very good performance in P, QRS, T waves delineation. The mean error (m) and the average standard deviation (s) were comparable to the ones obtained by other WT-based delineators, as shown in Table 6. Mean error (m) was lower than 6 ms (1.5 samples, at Fs= 250 samples/s) for all
charac-teristic points, whereas the average standard deviation (s) was around 8 ms (2 samples) for QRS delineation, and 12 ms (3 samples) for P wave and T peak delineation. Relatively high values ofsin T wave delineation are present in all algorithms, and may be caused
Table 4 Comparison of QRS Detection Performance with Published Methods (First ECG Channel of MITDB)
QRS Detector # annotations FP FN Se[%] P+[%]
This work 109010 148 252 99.77 99.86
Martinezet al.[13] 109428 153 220 99.80 99.86
Ghaffariet al.[18] 109428 129 101 99.91 99.88
Aristotle [25] 109428 94 1861 98.30 99.91
Liet al.[19] 104182 (*) 65 112 99.89 99.94
Afonsoet al.[26] 90909 406 374 99.59 99.56
Bahouraet al.[20] 109809 (*) 135 184 99.83 99.88
Leeet al.[27] 109481 137 335 99.69 99.88
Hamilton and Tompkins [28] 109267 248 340 99.69 99.77
Pan and Tompkins [23] 109809 (*) 507 277 99.75 99.54
Poliet al.[29] 109963 545 441 99.60 99.50
Moraeset al.[30] N/R N/R N/R 99.22 99.73
Hamilton [31] N/R N/R N/R 99.80 99.80
Inspired by [13], Table 2.
(*) a discrepancy was found in the original publication between reported total and record-by-record count. N/R: not reported.
Table 5 Comparison of QRS Detection Performance on the European ST-T Database (EDB)
QRS Detector # annotations FP FN Se[%] P+[%]
This work 788050 3511 1483 99.81 99.56
Martinezet al.[13] 787103 4077 3044 99.61 99.48
Aristotle [25] 787103 10405 38635 95.09 98.63
Table 6 Comparison of Delineation Performance with Published Methods (QT Database)
Method Param P onset P peak P offset QRS onset QRS offset T peak T offset
# annot 3194 3194 3194 3623 3623 3542 3542
This work Se[%] 98.15 98.15 98.15 100 100 99.72 99.77
P+
min[%] 91.00 91.00 91.00 N/A N/A 97.76 97.76
m ± s -4.5 ± 13.4 -4.7 ± 9.7 -2.5 ± 13.0 -5.1 ± 7.2 0.9 ± 8.7 -0.3 ± 12.8 1.3 ± 18.6
Martinezet al.[13] Se[%] 98.87 98.87 98.75 99.97 99.97 99.77 99.77
P+min[%] 91.03 91.03 91.03 N/A N/A 97.79 97.79
m ± s 2.0 ± 14.8 3.6 ± 13.2 1.9 ± 12.8 4.6 ± 7.7 0.8 ± 8.7 0.2 ± 13.9 -1.6 ± 18.1
Lagunaet al.[32] Se[%] 97.70 97.70 97.70 99.92 99.92 99.00 99.00
P+min[%] 91.17 91.17 91.17 N/A N/A 97.74 97.71
m ± s 14.0 ± 13.3 4.8 ± 10.6 -0.1 ± 12.3 -3.6 ± 8.6 -1.1 ± 8.3 -7.2 ± 14.3 13.5 ± 27.0
Boichatet al.[16] (*) Se[%] 99.87 99.87 99.91 99.97 99.97 99.97 99.97
P+
min[%] 91.98 92.46 91.70 98.61 98.72 98.91 98.50
m ± s 8.6 ± 11.2 10.1 ± 8.9 0.9 ± 10.1 3.4 ± 7.0 3.5 ± 8.3 3.7 ± 13.0 -2.4 ± 16.9
2sCSETolerance [24] 10.2 - 12.7 6.5 11.6 - 30.6
Partially inspired by [13], Table 3.
(*) 16-bit integer implementation. No. annotations not reported.SeandP+minuse 320 ms window.
N/A: not applicable, N/R: not reported.
Chiari
BioMedical
Engineer
ing
OnLine
2011,
10
:23
-engineering
-online.com/c
ontent/10/1/2
3
Page
16
of
by the difficulty in determining the exact fiducial points as confirmed by the large inter-cardiologist annotation variability, especially for T offset as shown in Table 7.
Comparing the average standard deviation (s) with the2sCSE tolerances, the
condi-tions <sCSE(referred to in [13] as “strict criterion”) is met for P peak, QRS offset, T
offset, whereas the condition s < 2sCSE(referred to in [13] as “loose criterion”) is not
met for any of the characteristic points. However, the “strict criterion” is not met by any methods, as shown in Table 6.
Sensitivity and positive predictive value of the ECG delineator for P, QRS, T waves were comparable to the values reported by others, as shown in Table 6. However, it shall be noted that the width of the search window adopted in the computation of true positives (TP) is not the same for all methods. In [13] the window width was not reported, in [16] it was set to 320 ms. In the present work, the window width was set to 150 ms. As a result,SesandP+minmay not be comparable across different methods.
Previous DWT-based methods [13], [16], compute the adaptive thresholds in QRS detectionεkQRS based on theroot mean square(RMS) ofdkncoefficients at the scales
of interest. In [13] RMS is computed over N = 216samples excerpts, for the first three scales (21, 22, 23). In [16] RMS is emulated over N = 29 samples excerpts for the first four scales. RMS is computationally demanding, as it requires squaring and summing N coefficients and calculating a square root. Although the square root was emulated in [16], a considerable amount of computations is required for squaring large data excerpts. In the present method, which uses only two scales, all thresholds are calcu-lated from few (local) coefficients, which dramatically reduces the computational effort. In particular, the computation ofε2QRSby (5.3) only requires N = 4 data-points,
com-pared to N = 29 in [16] and N = 216 in [13], and this computation does not require squaring as in RMS. This observation also applies to ε3QRS. Moreover, all thresholds
are expressed in the linear form of(A·v)/2B, where vis an integer variable (or the sum of integer variables), AandBare positive constant integer values. Thus all thresholds can be computed by elementary shift and add operations.
The ECG data used in this work were either originally sampled at 250 samples/s or resampled accordingly. Although many ECG front-end devices currently on the market offer data streams at 250 samples/s or 256 samples/s, there may be devices that pro-vide a fixed sample rate which is significantly different from 250 samples/s. In order to preserve an integer linear algebra implementation in these cases, depending on the sample rate different scales of the DWT filter bank (2) may be used, or the filter bank itself may need to be redesigned, either by using a different degree of the spline smoothing functionθ(t), or different scaling and wavelet functions.
Conclusions
In this paper, a WT-based single-lead ECG delineation algorithm, designed for online 32-bit integer linear algebra processing, with shift/add operations replacing
Table 7 Inter-Cardiologist Annotation Variability on QTDB (Annotation Files: q1c vs. q2c)
# matched annotations Mean Error ± SD [ms]
Q onset 360 -3.12 ± 14.06
T peak 359 -0.28 ± 26.24
multiplications and divisions, was presented. The algorithm complies with a sample resolution up to 24-bit/sample without any assumptions on the amplitude resolution of the ECG signal.
The algorithm detects the QRS-complex, delineates the onset, dominant peak, and offset of the mono- or bi-phasic P wave, the onset and offset of the QRS-complex, the dominant peak and offset of the mono- or bi-phasic T wave.
The QRS detector achieved excellent performance on the MIT-BIH Arrhythmia database (Se= 99.77%,P+ = 99.86%, 109010 annotated beats) and on the European ST-T Database, (Se = 99.81%,P+= 99.56%, 788050 annotated beats).
The proposed algorithm also exhibited very good accuracy in P, QRS, T delineator on QT Database, where the mean error between automatic and manual annotations was lower than 1.5 samples for all the characteristic points, and the associated average standard deviations were comparable to the ones reported from previous methods. However, the QTDB database contains a limited number of annotations, which makes the validation of an automatic ECG delineator not comprehensive.
Based on the results achieved on standard databases, the proposed algorithm exhibits reliable QRS detection as well as accurate ECG delineation. Reliability and accuracy are close to the highest among the ones obtained in other studies, in spite of a simpli-fied structure built on integer linear algebra which makes the proposed algorithm a suitable candidate for online QRS detection and ECG delineation under strict power constraints and limited computational resources, such as in wearable devices for long-term non-diagnostic ambulatory monitoring.
Acknowledgements
This work was supported by the EU-JTI grant No. 100008.
Authors’contributions
LYD designed and implemented the algorithm, carried out validation on the cited databases and participated in manuscript preparation and revisions. LC supervised manuscript preparation and revisions. All authors read and approved the final manuscript.
Competing interests
The authors declare that they have no competing interests.
Received: 22 November 2010 Accepted: 3 April 2011 Published: 3 April 2011
References
1. Hooper GS, Yellowlees P, Marwick TH, Currie PJ, Bidstrup BP:Telehealth and the diagnosis and management of cardiac disease.J Telemed Telecare2001,7:249-56.
2. Fairweather JAA, Johnston P, Luo S, Macfarlane PW:Computer analysis of implanted cardiac pacemaker rhythm. Comput Cardiol2007,34:193-196.
3. Causse M, Sénard JM, Démonet JF, Pastor J:Monitoring cognitive and emotional processes through pupil and cardiac response during dynamic versus logical task.Appl Psychophysiol Biofeedback2010,35:115-123.
4. Healey JA, Picard RW:Detecting stress during real-world driving tasks using physiological sensors.IEEE Trans Intell Transp Syst2005,6:156-166.
5. Higgins JP:Normal resting electrocardiographic variants in young athletes.Phys Sportsmed2008,36:69-75. 6. Corrado D,et al:Recommendations for interpretation of 12-lead electrocardiogram in the athlete.Eur Heart J2010,
31:243-259.
7. Mutikainen S, Rantanen T, Alén M, Kauppinen M, Karjalainen J, Ortega-Alonso A, Kaprio J, Kujala UM:
Electrocardiographic and other clinical correlates of walking ability in older women.Arch Gerontol Geriatr2009, 51:216-21.
8. Bowers EJ, Murray A, Langley P:Respiratory rate derived from principal component analysis of single lead electrocardiogram.Comput Cardiol2008,35:437-440.
9. Porges SW, Byrne EA:Research methods for measurement of heart rate and respiration.Biol Psychol1992,34:91-130. 10. Figueiredo CP, Becher K, Hoffmann KP, Mendes PM:Low power wireless acquisition module for wearable health
monitoring systems.Conf Proc IEEE Eng Med Biol Soc2010,1:704-7.
12. Mallat SG, Zhong S:Characterization of signals from multiscale edges.IEEE Trans Pattern Anal Machine Intell1992, 14:710-732.
13. Martinez J, Almeida R, Olmos S, Rocha A, Laguna P:A wavelet-based ECG delineator: evaluation on standard databases.IEEE Trans Biomed Eng2004,51:570-581.
14. Addison P:Wavelet transforms and the ECG: a review.Physiol Meas2005,26:155-199.
15. Sivannarayana N, Reddy DC:Biorthogonal wavelet transforms for ECG parameters estimation.Med Eng Phys1999, 21:167-174.
16. Boichat N, Khaled N, Rincon F, Atienza D:Wavelet-based ECG delineation on a wearable embedded sensor platform. Proc 6th IEEE Int Workshop on Body Sensor Networks2009, 256-261.
17. Sovilj S, Jeras M, Magjarevic R:Real time P-wave detector based on wavelet analysis.Proc 12th IEEE Mediterranean Electrotechnical Conf2004,1:403-406.
18. Ghaffari A, Homaeinezhad MR, Akraminia M, Atarod M, Daevaeiha M:A robust wavelet-based multi-lead Electrocardiogram delineation algorithm.Med Eng Phys2009,31:1219-27.
19. Li C, Zheng C, Tai C:Detection of ECG characteristic points using wavelet transforms.IEEE Trans Biomed Eng1995, 42:21-28.
20. Bahoura M, Hassani M, Hubin M:DSP implementation of wavelet transform for real time ECG wave forms detection and heart rate analysis.Comput Meth Programs Biomed1997,52:35-44.
21. Mallat S:Zero-crossings of a wavelet transform.IEEE Trans Inform Theory1991,37:1019-1033.
22. Clifford GD, Azuaje F, McSharry PE:Advanced methods and tools for ECG data analysis2006, 55-57, Ed. Artech House. 23. Pan J, Tompkins WJ:A real-time QRS detection algorithm.IEEE Trans Biomed Eng1985,32:230-236.
24. The CSE Working Party:Recomendations for measurement standards in quantitative electrocardiography.Eur Heart J1985,6:815-825.
25. Moody GB, Mark RG:Development and evaluation of a 2-lead ECG analysis program.Comput Cardiol1982,4:39-44. 26. Afonso VX, Tompkins WJ, Nguyen TQ, Luo S:ECG beat detection using filter banks.IEEE Trans Biomed Eng1999,
46:192-201.
27. Lee J, Jeong K, Yoon J, Lee M:A simple real-time QRS detection algorithm.Proc 18th Ann Int Conf IEEE Engineering in Medicine and Biology Soc1996, 1396-1398.
28. Hamilton PS, Tompkins W:Quantitative investigation of QRS detection rules using the MIT/BIH arrhythmia database.IEEE Trans Biomed Eng1986,33:1157-1165.
29. Poli R, Cagnoni S, Valli G:Genetic design of optimum linear and nonlinear QRS detectors.IEEE Trans Biomed Eng 1995,42:1137-1141.
30. Moraes J, Freitas M, Vilani F, Costa E:A QRS complex detection algorithm using electrocardiogram leads.Comput Cardiol2002,29:205-208.
31. Hamilton P:Open source ECG analysis.Comput Cardiol2002,29:101-104.
32. Laguna P, Jané R, Caminal P:Automatic detection of wave boundaries in multilead ECG signals: Validation with the CSE database.Comput Biomed Res1994,27:45-60.
doi:10.1186/1475-925X-10-23
Cite this article as:Di Marco and Chiari:A wavelet-based ECG delineation algorithm for 32-bit integer online processing.BioMedical Engineering OnLine201110:23.
Submit your next manuscript to BioMed Central and take full advantage of:
• Convenient online submission
• Thorough peer review
• No space constraints or color figure charges
• Immediate publication on acceptance
• Inclusion in PubMed, CAS, Scopus and Google Scholar
• Research which is freely available for redistribution