R E S E A R C H
Open Access
Acute effects of fine particulate air pollution on
ST segment height: A longitudinal study
Fan He
1, Michele L Shaffer
1, Sol Rodriguez-Colon
1, Edward O Bixler
2, Alexandros N Vgontzas
2, Ronald W Williams
3,
Rongling Wu
1, Wayne E Cascio
4, Duanping Liao
1*Abstract
Background:The mechanisms for the relationship between particulate air pollution and cardiac disease are not fully understood. Air pollution-induced myocardial ischemia is one of the potentially important mechanisms. Methods:We investigate the acute effects and the time course of fine particulate pollution (PM2.5) on myocardium ischemic injury as assessed by ST-segment height in a community-based sample of 106 healthy non-smokers. Twenty-four hour beat-to-beat electrocardiogram (ECG) data were obtained using a high resolution 12-lead Holter ECG system. After visually identifying and removing all the artifacts and arrhythmic beats, we calculated beat-to-beat ST-height from ten leads (inferior leads II, III, and aVF; anterior leads V3 and V4; septal leads V1 and V2; lateral leads I, V5, and V6,). Individual-level 24-hour real-time PM2.5concentration was obtained by a continuous personal PM2.5monitor. We then calculated, on a 30-minute basis, the corresponding time-of-the-day specific average exposure to PM2.5for each participant. Distributed lag models under a linear mixed-effects models framework were used to assess the regression coefficients between 30-minute PM2.5and ST-height measures from each lead; i.e., one lag indicates a 30-minute separation between the exposure and outcome.
Results:The mean (SD) age was 56 (7.6) years, with 41% male and 74% white. The mean (SD) PM2.5exposure was 14 (22)μg/m3. All inferior leads (II, III, and aVF) and two out of three lateral leads (I and V6), showed a significant association between higher PM2.5levels and higher ST-height. Most of the adverse effects occurred within two hours after PM2.5exposure. The multivariable adjusted regression coefficientsb(95% CI) of the cumulative effect due to a 10μg/m3increase in Lag 0-4 PM2.5on ST-I, II, III, aVF and ST-V6 were 0.29 (0.01-0.56) μV, 0.79 (0.20-1.39)
μV, 0.52 (0.01-1.05)μV, 0.65 (0.11-1.19)μV, and 0.58 (0.07-1.09)μV, respectively, with all p < 0.05.
Conclusions:Increased PM2.5concentration is associated with immediate increase in ST-segment height in inferior and lateral leads, generally within two hours. Such an acute effect of PM2.5may contribute to increased potential for regional myocardial ischemic injury among healthy individuals.
Background
Numerous studies have consistently found a significant association between exposures to fine particulate matter, defined as fine particles with aerodynamic diameter less or equal to 2.5 micrometers (PM2.5), and the risk of clinical cardiovascular disease (CVD) [1-4]. The mechanisms responsible for such an association have been the focus of recent environmental health studies. Several studies [5-10] have suggested that electrocardio-graphic (ECG) morphologies indicative of myocardial
ischemic damages are significantly associated with short-term increases in PM levels, thus air pollution-induced myocardial ischemia is one of the potentially important mechanisms. No studies have been published documenting the exact time course of action from PM2.5 exposure to myocardial ischemia. On the other hand, ST-height changes, including both ST depression and elevation, generally have been accepted as indicators of myocardial ischemic injury [11,12]. We therefore designed this study to systematically investigate the effects and the time course of individual-level exposures to PM2.5on the ST-height, an ECG marker of myocar-dial ischemia, in a community-based sample of middle-aged adults.
* Correspondence: [email protected]
1
Department of Public Health Sciences, Penn State University College of Medicine, A210, 600 Centerview Dr. Suite 2200, Hershey, PA, 17033, USA Full list of author information is available at the end of the article
Methods
Study Design
For this report, we used the data collected for the Air Pollution and Cardiac Risk and its Time Course (APACR) study, which we designed to investigate the mechanisms and the time course of the adverse effects of PM2.5 on cardiac electrophysiology, blood coagula-tion, and systemic inflammation. Recruitment methods and examination procedures for the APACR study have been published elsewhere [13,14]. Briefly, all study parti-cipants were recruited from communities in central Pennsylvania, primarily from the Harrisburg metropoli-tan area. All participants gave written informed consent prior to their participation in the study. The inclusion criteria for the study included nonsmoking adults ≥45 years old who had not been diagnosed with severe car-diac problems (defined as diagnosed valvular heart dis-ease, congenital heart disdis-ease, acute myocardial infarction or stroke within six months, or congestive heart failure). Community recruitment specialists from the Pennsylvania State University General Clinical Research Center (GCRC), which is funded by the National Institutes of Health, at the Penn State College of Medicine, and the GCRC-organized community out-reach activities, supported the recruitment of the partici-pants. The GCRC maintains a list of individuals who live in central Pennsylvania communities for various health-related studies. Approximately 75% of the indivi-duals who were contacted and who met our inclusion criteria were enrolled in the APACR study. Our targeted sample size was 100 individuals, and we enrolled and examined 106 individuals for the APACR study. The examination of two participants per week was con-ducted from November 2007 to June 2009 for the entire examination period except for major holidays.
Study participants were examined in the GCRC in the morning between 8:00 AM and 10:00 AM on Day-1. All participants fasted for at least eight hours before the clinical examination. After completing a health history questionnaire, a trained research nurse measured seated blood pressure three times, height, and weight, and drew 50 mL of blood for biomarker assays according to the blood sample preparation protocols. A trained inves-tigator connected the PM2.5and Holter ECG recorders. Participants were given an hourly activity log to record special events that occurred over the next 24 hours, including outdoor activities, exposure to traffic on the street, traveling in an automobile, and any physical activities. The entire clinical examination session lasted about one hour. Participants were then released to pro-ceed with their usual daily routines. The next morning, the participants returned to the GCRC to remove the PM2.5 and Holter monitors, deliver the completed
activity log, have another 50 mL of blood drawn, and a urine sample collected. Then, an exercise echocardiogra-phy was performed on each participant according to a standardized protocol to measure the participant’s ven-tricular function and structure. The entire Day-2 session lasted for about one hour and 45 minutes. Penn State University College of Medicine Institutional Review Board approved the study protocol.
Personal PM2.5Exposures
The APACR study used a personal PM2.5 DataRam
(pDR, model 1200, Thermo Scientific, Boston, MA) for real-time 24-hour personal PM2.5exposure assessment. Details of the exposure assessment [13,14] and of the instrument’s performance have been reported elsewhere [15-18]. Real-time PM2.5 concentrations were initially recorded at one-minute intervals. For each participant, we calculated the 30-minute segment-specific averages, based on the whole and half hours, as our PM2.5 expo-sure variable in the APACR study. Therefore, the PM2.5 exposure variables were treated as repeated measures, and each individual contributed 48 exposure data points.
Continuous Ambulatory ECG and ST-Height Variables
Heart Rate Variability (HRV) Variables
We performed time and frequency domain HRV analy-sis on the ECG recording, after removing artifacts with standardized visual inspection and statistical filters. We calculated HRV indices from 30-minute segment-speci-fic recordings using the SuperECG package (Mortara Instrument, Inc., Milwaukee, WI) according to current recommendations [20], and used the following HRV indices as measures of cardiac autonomic modulation (CAM): standard deviation of all RR intervals (SDNN, ms), square root of the mean of the sum of the squares of differences between adjacent RR (RMSSD, ms), power in the low frequency range (0.04-0.15 Hz, LF), power in the high frequency range (0.15-0.40 Hz, HF), and the ratio of LF and HF (LF/HF).
Weather Variables
We obtained individual-level real-time temperature and relative humidity using the HOBO H8 logger (Onset Computer Corporation, Bourne, MA). The real-time temperature and relative humidity were recorded at one-minute intervals initially. For each participant, we calculated 30-minute segment specific averages, corre-sponding to the PM2.5and Holter measures. Therefore, these weather covariables are treated as repeated mea-sures, and each individual contributed 48 data points for each variable.
Other Participant-Level Covariables
A standardized questionnaire administered on Day-1 of the study was used to collect the following individual-level information: (a) demographic variables, including age, race, sex, and highest education level; (b) medica-tion uses, including anti-anginal medicamedica-tion, anti-hyper-tensive medication, and anti-diabetic medication; and (c) physician diagnosed chronic disease history, including CVD (including revascularization procedures and myo-cardial infarction), hypertension, and diabetes. The averages of the second and third measures of seated
systolic and diastolic blood pressures on Day-1 were used to represent a participant’s blood pressure levels. Day-1 fasting glucose was measured by Penn State GCRC central laboratory. CVD was defined by anti-anginal medication use or a history of CVD. Hyperten-sion was defined by anti-hypertensive medication use, physician diagnosed hypertension, systolic blood pres-sure≥140 mmHg, or diastolic blood pressure≥ 90 mm Hg. Diabetes was defined by anti-diabetic medication use, physician diagnosed diabetes, or fasting glucose ≥ 126 mg/dl. Body mass index (BMI) was defined as the ratio of weight to height squared (BMI, kg/m2).
Statistical Analysis
Two-sample t tests or chi-square tests, as appropriate, were used to compare the distributions of basic demo-graphic variables between participants with and without chronic diseases. We perform a repeated measures ana-lysis using distributed lag models [21-23] under a linear mixed-effects models [24,25] framework, specifying a first-order autoregressive covariance structure to model the correlation between observations from the same par-ticipant, to estimate the regression coefficients between 30-minute PM2.5 and the ST-height measures. Time was included as a categorical variable to allow flexibility in modeling the relationship between ST-height measures and time. Residual diagnostics were used to assess the appropriateness of modeling assumptions, including normality and homogeneity of variance, and no sizeable departures were detected. In these models, one lag indi-cates a 30-minute separation between the exposure and outcome. Thus, Lag 0 indicates the spontaneous rela-tionships between PM2.5and the ST-height, and Lag 1 indicates 30 minutes between the PM2.5and ST-height, and so on. We chose a constrained distributed lag model, the polynomial distributed lag model, to reduce the potential collinearity of PM2.5 between individual lags using a second-degree polynomial. The linear mixed-effects model framework was chosen because it
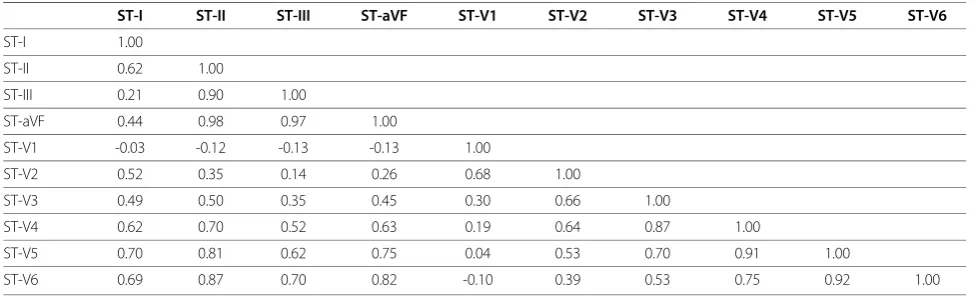
Table 1 Correlation coefficients for ST-height measurements
ST-I ST-II ST-III ST-aVF ST-V1 ST-V2 ST-V3 ST-V4 ST-V5 ST-V6
ST-I 1.00
ST-II 0.62 1.00
ST-III 0.21 0.90 1.00
ST-aVF 0.44 0.98 0.97 1.00
ST-V1 -0.03 -0.12 -0.13 -0.13 1.00
ST-V2 0.52 0.35 0.14 0.26 0.68 1.00
ST-V3 0.49 0.50 0.35 0.45 0.30 0.66 1.00
ST-V4 0.62 0.70 0.52 0.63 0.19 0.64 0.87 1.00
ST-V5 0.70 0.81 0.62 0.75 0.04 0.53 0.70 0.91 1.00
allows us to explicitly model the expected correlation between measurements taken from the same participant. As the measurements are equally spaced, we used the natural choice for correlation structure, autoregressive order one (AR1), throughout the analyses to account for the potential autocorrelation. A second-degree polyno-mial for the distributed lag model was used because the amount of variability in the outcomes of interest explained by the air pollution measures is not large, so that the degree of polynomial must be chosen parsimo-niously. In our experience, second-degree polynomials perform adequately, which is supported by Schwartz [23]. Another advantage of the distributed lag model is its ability to provide interpretation of the cumulative effects of the lags included in the model, as well as indi-vidual lag effects. Because the PM2.5and ECG variables were assessed in parallel over 48 lags (24 hour), we decided a prior to model no more than ten lags, which allowed us to fit the distributed lag model using at least 75% of the data. We started from the largest number of lags (lag 0-10), and reduced the total number of indivi-dual lags by back-eliminating the longer lags (e.g., lag 10) one lag at a time until a significant cumulative effect on ST-II was identified (lag 4 in this report). We then identified this model as our final model for all ST-height measurements. All results are expressed per 10μg/m3 increase in PM2.5. In the distributed lag models, basic demographic variables were included as the first step of covariable adjustment. We then included additional adjustment for diabetes, hypertension and CVD. To examine the impact of CAM on PM2.5 and ST-height associations, we repeated the models by adjusting for each of the HRV variables. In these models, all time-dependent covariables, such as weather and HRV vari-ables, were entered in the model using the same distrib-uted lag structure as the PM2.5variable. We used SAS statistical version 9 (SAS Institute, Inc., Cary, NC) for all analyses.
Results
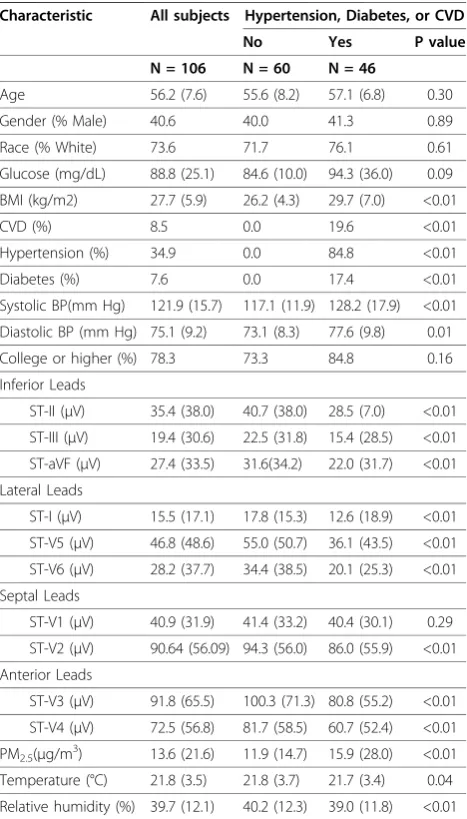
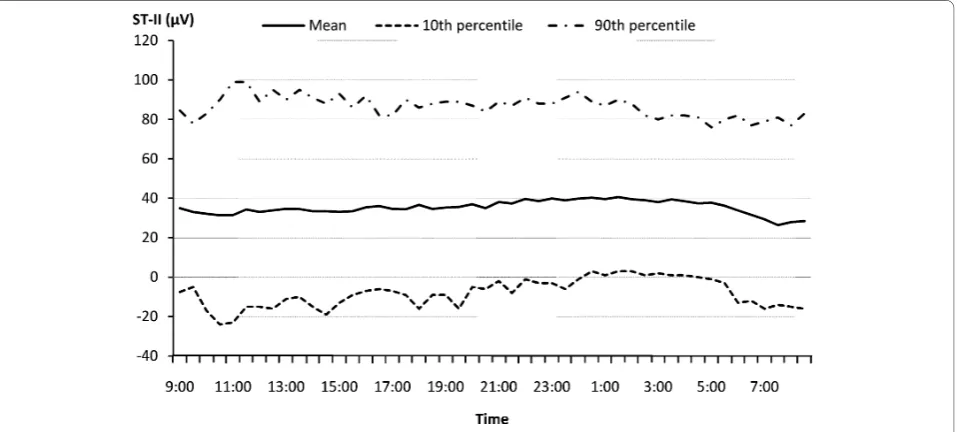
The demographic and cardiovascular disease risk pro-files of the study population are presented in Table 2. The mean age of the participants was 56 years, with 74% non-Hispanic white, 26% minorities (including Blacks, Hispanics, and Chinese), 59% female, and 43% having chronic diseases (primarily hypertension). The prevalence of hypertension, diabetes, and CVD were 34.9%, 7.6%, and 8.5% respectively. At the population level, the distribution of both PM2.5 exposure and height measures are approximately normal. The ST-height measures are significantly lower in subjects with chronic disease. Figure 1 and 2 show the time-of-the-day-specific distributions (mean, 10thand 90th percen-tile) of the PM2.5and ST-height from limb lead II
(ST-II), as an example of ST-height measures. Both the PM2.5and ST-height showed sufficient variation within 24 hours, and within time frame between individuals.
The cumulative effect and individual lag effects of PM2.5 on each of the ST-height measures are summar-ized in Table 3 as multivariable-adjusted regression coefficient b(95% CI) associated with a 10μg/m3 incre-ment of PM2.5 exposure. In summary, five leads (ST-I, II, III, aVF, and ST-V6), out of ten ECG leads analyzed, showed a significant positive association between PM2.5 exposure and ST-height. Examining the cumulative effect, most of the adverse effect occurred within two hours (lag0-4) after the elevation of PM2.5. Specifically, the cumulative effect due to a 10μg/m3 increase in Lag
Table 2 Demographic characteristics and health status of the study population
Characteristic All subjects Hypertension, Diabetes, or CVD
No Yes P value
N = 106 N = 60 N = 46
Age 56.2 (7.6) 55.6 (8.2) 57.1 (6.8) 0.30
Gender (% Male) 40.6 40.0 41.3 0.89
Race (% White) 73.6 71.7 76.1 0.61
Glucose (mg/dL) 88.8 (25.1) 84.6 (10.0) 94.3 (36.0) 0.09
BMI (kg/m2) 27.7 (5.9) 26.2 (4.3) 29.7 (7.0) <0.01
CVD (%) 8.5 0.0 19.6 <0.01
Hypertension (%) 34.9 0.0 84.8 <0.01
Diabetes (%) 7.6 0.0 17.4 <0.01
Systolic BP(mm Hg) 121.9 (15.7) 117.1 (11.9) 128.2 (17.9) <0.01
Diastolic BP (mm Hg) 75.1 (9.2) 73.1 (8.3) 77.6 (9.8) 0.01
College or higher (%) 78.3 73.3 84.8 0.16
Inferior Leads
ST-II (μV) 35.4 (38.0) 40.7 (38.0) 28.5 (7.0) <0.01
ST-III (μV) 19.4 (30.6) 22.5 (31.8) 15.4 (28.5) <0.01
ST-aVF (μV) 27.4 (33.5) 31.6(34.2) 22.0 (31.7) <0.01
Lateral Leads
ST-I (μV) 15.5 (17.1) 17.8 (15.3) 12.6 (18.9) <0.01
ST-V5 (μV) 46.8 (48.6) 55.0 (50.7) 36.1 (43.5) <0.01
ST-V6 (μV) 28.2 (37.7) 34.4 (38.5) 20.1 (25.3) <0.01
Septal Leads
ST-V1 (μV) 40.9 (31.9) 41.4 (33.2) 40.4 (30.1) 0.29
ST-V2 (μV) 90.64 (56.09) 94.3 (56.0) 86.0 (55.9) <0.01
Anterior Leads
ST-V3 (μV) 91.8 (65.5) 100.3 (71.3) 80.8 (55.2) <0.01
ST-V4 (μV) 72.5 (56.8) 81.7 (58.5) 60.7 (52.4) <0.01
PM2.5(μg/m3) 13.6 (21.6) 11.9 (14.7) 15.9 (28.0) <0.01
Temperature (°C) 21.8 (3.5) 21.8 (3.7) 21.7 (3.4) 0.04
Relative humidity (%) 39.7 (12.1) 40.2 (12.3) 39.0 (11.8) <0.01
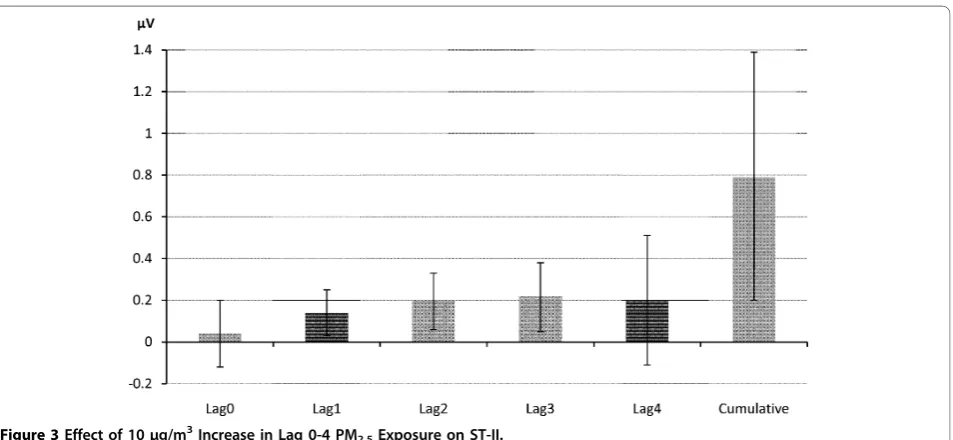
0-4 PM2.5 concentration on ST-I, II, III, aVF and ST-V6 were 0.29 (0.01-0.56) μV, 0.79 (0.20-1.39) μV, 0.52 (0.01-1.05)μV, 0.65 (0.11-1.19) μV, and 0.58 (0.07-1.09) μV, respectively. To visualize the acute effect of PM2.5 exposure on ST-height and its time course, both indivi-dual and cumulative effects of lag 0-4 PM on ST-II height are presented in Figure 3, as an example. Based on the cardiac anatomy, we find that all inferior leads (II, III, and aVF) and two out of three lateral leads (I and V6) show significant ST-height elevation. Therefore, our results also indicate that acute PM2.5exposure lead
to regional cardiac ischemic changes. Our data also revealed a less consistent individual lag effect. Addi-tional adjustment for chronic disease did not change the pattern of association from the models adjusted only for major demographic and weather-related variables.
The statistically significant final multivariable-adjusted models (M2, in Table 3) were repeated with additional adjustment for heart rate variability variables, one HRV variable at a time. The HRV adjusted regression coeffi-cients measuring the cumulative effects of PM2.5from 0-4 lags after adjusting for HRV variables are presented Figure 1Time Specific Distribution of PM2.5Exposure over 24 Hours in the APACR Study.
Table 3 Regression coefficient of ST-height associated with 10μg/m3increment of PM2.5concentration.
ST Variable Lag0 95% CI Lag1 95% CI Lag2 95% CI Lag3 95%CI Lag4 95% CI Cumulative 95% CI
Inferior Leads
ST-II M1 0.04 (-0.12,0.20) 0.13 (0.02,0.24) 0.19 (0.05,0.33) 0.21 (0.04,0.38) 0.19 (-0.12,0.50) 0.76 (0.17,1.36)
M2 0.04 (-0.12,0.20) 0.14 (0.03,0.25) 0.20 (0.06,0.33) 0.22 (0.05, 0.38) 0.20 (-0.11,0.51) 0.79 (0.20,1.39)
ST-III M1 0.02 (-0.13,0.16) 0.08 (-0.01,0.18) 0.13 (0.01,0.25) 0.14 (-0.01,0.30) 0.14 (-0.14,0.41) 0.50 (-0.02,1.03)
M2 0.02 (-0.12,0.16) 0.09 (-0.01,0.18) 0.13 (0.01,0.25) 0.15 (0.01,0.30) 0.14 (-0.13,0.41) 0.52 (0.01,1.05)
ST-aVF M1 0.03 (-0.12,0.18) 0.11 (0.01,0.21) 0.16 (0.03,0.28) 0.17 (0.02,0.33) 0.16 (-0.12,0.44) 0.63 (0.06,1.17)
M2 0.03 (-0.11,0.18) 0.11 (0.01,0.21) 0.16 (0.04,0.28) 0.18 (0.03,0.33) 0.17 (-0.11,0.45) 0.65 (0.11,1.19)
Lateral Leads
ST-I M1 0.03 (-0.05,0.10) 0.05 (0.01,0.10) 0.06 (0.01,0.13) 0.07 (-0.01,0.15) 0.06 (-0.08,0.21) 0.27 (-0.01,055)
M2 0.03 (-0.05,0.10) 0.05 (0.01,0.10) 0.07 (0.01,0.13) 0.07 (-0.01,0.15) 0.07 (-0.08,0.21) 0.29 (0.01,0.56)
ST-V5 M1 -0.01 (-0.20,0.17) 0.05 (-0.08,0.17) 0.10 (-0.05,0.26) 0.15 (-0.04,0.34) 0.19 (-0.16,0.54) 0.48 (-0.20,1.15)
M2 -0.01 (-0.19,0.18) 0.06 (-0.07,0.18) 0.11 (-0.04,0.27) 0.16 (-0.03,0.35) 0.20 (-0.15,0.55) 0.52 (-0.16,1.20)
ST-V6 M1 -0.01 (-0.14,0.13) 0.04 (-0.05,0.14) 0.10 (-0.02,0.55) 0.17 (0.02,0.31) 0.25 (-0.02,0.51) 0.55 (0.04,1.06)
M2 0.01 (-0.14,0.14) 0.05 (-0.05,0.14) 0.10 (-0.01,0.22) 0.17 (0.03,0.32) 0.25 (-0.01,0.52) 0.58 (0.07,1.09)
Spetal Leads
ST-V1 M1 -0.01 (-0.16,0.15) 0.05 (-0.06,0.15) 0.08 (-0.05,0.21) 0.08 (-0.08,0.25) 0.06 (-0.23,0.36) 0.26 (-0.31,0.83)
M2 -0.01 (-0.16,0.15) 0.05 (-0.06,0.15) 0.08 (-0.05,0.21) 0.09 (-0.08,0.25) 0.07 (-0.23,0.36) 0.27 (-0.30,0.84)
ST-V2 M1 -0.07 (-0.31,0.17) 0.11 (-0.04,0.27) 0.22 (0.02,0.42) 0.24 (0.01,0.49) 0.19 (-0.27,0.64) 0.69 (-0.17,1.56)
M2 -0.06 (-0.30,0.17) 0.12 (-0.04,0.28) 0.22 (0.02,0.42) 0.25 (0.01,0.50) 0.19 (-0.26,0.65) 0.72 (-0.14,1.59)
Anterior Leads
ST-V3 M1 -0.11 (-0.43,0.21) 0.06 (-0.15,0.27) 0.14 (-0.13,0.40) 0.12 (-0.21,0.05) 0.01 (-0.61,0.62) 0.20 (-0.94,1.35)
M2 -0.09 (-0.41,0.23) 0.08 (-0.13,0.29) 0.16 (-0.11,0.43) 0.14 (-0.19,0.47) 0.04 (-0.58,0.65) 0.33 (-0.82,1.47)
ST-V4 M1 -0.09 (-0.27,0.09) 0.03 (-0.09,0.16) 0.11 (-0.04,0.26) 0.14 (-0.05,0.33) 0.13 (-0.21,0.48) 0.33 (-0.34,1.00)
M2 -0.08 (-0.26,0.10) 0.04 (-0.09,0.16) 0.12 (-0.04,0.27) 0.15 (-0.04,0.34) 0.14 (-0.20,0.49) 0.37 (-0.30,1.04)
M1: Adjusted for age, sex, race, temperature, and relative humidity
2: Adjusted for age, sex, race, temperature, and relative humidity, diabetes, hypertension, and CVD
Figure 3Effect of 10μg/m3Increase in Lag 0-4 PM
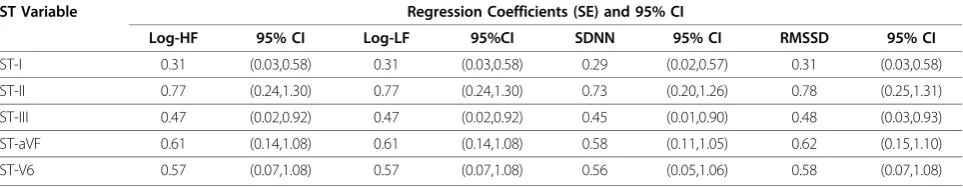
in Table 4. In summary, the overall pattern of associa-tions between PM2.5and ST-height did not change sub-stantially with additional adjustment for HRV variables as measures of cardiac autonomic modulation. There-fore, the ST-segment elevation we observed is indepen-dent of sympathetic and parasympathetic nervous activity.
We tested the interaction terms between PM2.5 and chronic condition, and none were statistically significant at the 0.05 level (data not shown). Therefore, the effects of PM2.5 on ST-height did not differ depending on whether a person had previous health problems. We also performed stratified analysis according to chronic disease status, using M1 in Table 3. We found similar associations by chronic disease status (data not shown). It should be noted that the sample size of this study is small, and individuals with chronic conditions consisted mostly of well-controlled hypertensives. Therefore, the statistical power was limited to detect significant effect modification by chronic disease status.
Discussion
A large number of epidemiologic studies have found an association between short-term exposure to increased particulate air pollution and CVD morbidity and mortal-ity [1-4,26,27]. However, the mechanisms responsible for such an association have not been fully identified. Pre-vious studies have suggested several promising
underly-ing mechanisms, including cardiac autonomic
impairment as measured by lower HRV [13,28-32], ven-tricular repolarization [5,14,33-37], arrhythmia [38-41], and myocardial ischemia [6-9,42]. The actual time-course from PM exposure to effects on cardiac measures has not been investigated systematically in a commu-nity-based sample. Cavallari and coworkers reported an early- and a later-phase HRV response, with the early effects at two hours and delayed effects at nine to thir-teen hours after exposure [43]. We reported a sub-acute PM2.5 effect on HRV at approximate in four to six hours [13], and an acute PM2.5 effect on ventricular repolarization at three to four hours [14]. No studies to date have investigated whether the PM and myocardial
ischemia association is mediated through its adverse effects on other ECG parameters, such as CAM.
In this study of community-based individuals, we examined the acute effect and time course of PM2.5on myocardial ischemia. However, we did not limit our examination to the characteristics of clinically manifest ischemia (e.g. ≥100μV for limb leads and≥200μV for precordial leads of ST-segment elevation), since air pol-lution could possibly induce ischemic changes to a les-ser degree. Our results reveal that PM2.5 had a significant positive effect on ST-height from five out of ten leads, supporting that elevated PM2.5 levels can lead to higher ST-height in inferior and lateral leads, which can be considered as indications of potential for regional myocardial ischemic damage. These findings are consis-tent with previous reports [6-9,42], and extend the adverse PM2.5effects from special populations to a com-munity-based sample of healthy individuals, and from ambient-based estimated PM exposures to individual-level measured exposures to PM.
We examined whether the PM and ST-height relation-ship is chiefly mediated through its adverse effect on CAM. As evidenced by the results presented in Table 4, the PM and ST-height associations in all five leads remained unchanged after adjusting for HRV variables as measures of CAM. Thus, our data did not support that the PM2.5and myocardial ischemia association was majorly mediated through its adverse effects on CAM, at least not from the same lagged effects that we ana-lyzed. However several other mechanisms could explain the adverse effects of PM on myocardial ischemia. First, PM may induce a constriction in the coronary artery. Supporting this hypothesis, Brook and coworkers reported a sudden conduit vasoconstriction after a short-term PM2.5 and O3 exposure in a sample of healthy volunteers [44]. Mills and coworkers also reported similar patterns supporting the vascular dys-function effects of PM exposures [45]. Second, PM may also decrease the oxygen-carrying capacity of the blood, as supported by studies reported by several investigators [46-48]. Third, it is also possible that the ST-height changes in response to elevated PM2.5in parallel to its
Table 4 HRV adjusted Lag0-4 cumulative effect of ST-height associated with 10μg/m3increment of PM2.5.
ST Variable Regression Coefficients (SE) and 95% CI
Log-HF 95% CI Log-LF 95%CI SDNN 95% CI RMSSD 95% CI
ST-I 0.31 (0.03,0.58) 0.31 (0.03,0.58) 0.29 (0.02,0.57) 0.31 (0.03,0.58)
ST-II 0.77 (0.24,1.30) 0.77 (0.24,1.30) 0.73 (0.20,1.26) 0.78 (0.25,1.31)
ST-III 0.47 (0.02,0.92) 0.47 (0.02,0.92) 0.45 (0.01,0.90) 0.48 (0.03,0.93)
ST-aVF 0.61 (0.14,1.08) 0.61 (0.14,1.08) 0.58 (0.11,1.05) 0.62 (0.15,1.10)
ST-V6 0.57 (0.07,1.08) 0.57 (0.07,1.08) 0.56 (0.05,1.06) 0.58 (0.07,1.08)
well documented adverse effects on CAM. This is simi-lar to the electrophysiological changes seen in Brugada Syndrome, which is associated with high incidence of sudden cardiac death [49] by means of alternation in repolarizing currents presented on ECG as lower HRV and ST-segment elevation in the right precordial ECG leads V1-V3. Lastly, it is also plausible that PM has a direct adverse effect on cardiac electrophysiological parameters, such as ST-height. More mechanistic stu-dies are needed to investigate the exact pathways from PM exposure to the adverse cardiac electrophysiological effects.
On the time course of PM2.5effects on myocardial ischemia measures, our data consistently indicate that the time course of the adverse effect is within four lags of the exposure window - approximately two hours of elevated PM2.5exposure, similar to that reported by Mills and coworkers [45] on the acute effects of diesel exhaust on vascular dysfunction and impaired endogen-ous fibrinolysis. Our findings on the time-course of PM2.5 effects on ischemia are also consistent with that reported by Cavallari and coworkers [43] on the early effects of PM exposure on HRV. In the same popula-tion, time course of PM2.5 effects on myocardial ische-mia measures are more acute than the effects on HRV [13] and on ventricular repolarization [14]. To our knowledge, this is the first study to demonstrate the time-course of the acute effects of PM2.5on myocardial ischemia in healthy middle aged individuals sampled from communities.
It is worthwhile noting that most of the effect sizes of individual lags within the two hour time frame (lag0-lag4) are smaller than the cumulative effects. As expected, some of the associations between individual lag PM exposure and ST-height are not statistically sig-nificant. While individual lag effects may be too small to show an important contribution to the ST-height, the sum of such small effects is large enough to show a sig-nificant impact on the ST-height measures. This can be clearly illustrated by Figure 3 as well. On the other hand, the cumulative effect sizes we identified in this study are also relatively small. For example, for every 10 μg/m3
increase in Lag 0-4 PM2.5 exposure, the asso-ciated increases in ST-II is only 0.79μV, corresponding to 2% increase in this variable, which has a mean of 35 and SD of 38μV. Therefore, such small effects on ST-height may not be clinically meaningful. On the other hand, it can be argued that the entire population is exposed to PM2.5on a continuous basis daily. Thus, ele-vated PM2.5 levels can have a huge public health impact. Moreover, the minor effect observed in ST-height in this study was measured in generally healthy individuals. It is possible that PM2.5effect on myocardial ischemia might be greater in individuals with underlying
structural heart disease or ischemic heart disease. Future studies should target these clinical subgroups likely to be more susceptible to the effects of PM2.5, especially those made more vulnerable by residing near sources of PM2.5, e.g. highways.
increase in the true PM2.5 exposure, if pDR systemati-cally overestimates the true exposure by 10-50%, i.e., the reported effect sizes in this study were systematically underestimated.
Conclusions
In summary, acute exposure to PM2.5at the individual level, is directly associated with higher ST-height mea-sures in inferior and lateral leads, which is indicative of regional ischemic damage potential to the myocardium. Moreover, the time to effects is about two hours after elevated PM2.5. The effect of PM on ST-height is inde-pendent of major confounding factors and cannot be attributed solely to its effects on HRV as measures of CAM. Overall, these findings support that PM may affect myocardial ischemia, and partly through such a mechanism, PM increases cardiovascular risk, such as sudden cardiac death and myocardial infarction.
Abbreviations
AR(1): Autoregressive order one; BMI: Body Mass Index; CAM: Cardiac Autonomic Modulation; CVD: Cardiovascular Diseases; ECG:
Electrocardiography; GCRC: General Clinical Research Center; HF: Power in the High-Frequency range (0.15-0.40 Hz); HRV: Heart Rate Variability; LF: Power in the Low-Frequency range (0.04-0.15 Hz); PM: Particulate Matter; RMSSD: Square Root of the Mean of the Sum of the Squares of Differences between adjacent RR intervals; SD: Standard Deviation; SDNN: Standard Deviation of Normal-to-Normal RR intervals.
Acknowledgements
This study is funded by NIEHS (1 R01 ES014010). The authors wish to thank Dr. David Mortara of Mortara Instrument, Inc. for providing the SuperECG software for the analysis of the electrocardiographic data.
The research described in this article by the United States Environmental Protection Agency has not been subjected to Agency review and, therefore, does not necessarily reflect the review of the Agency and no official endorsement should be inferred.
Author details
1Department of Public Health Sciences, Penn State University College of
Medicine, A210, 600 Centerview Dr. Suite 2200, Hershey, PA, 17033, USA.
2
Sleep Research & Treatment Center, Department of Psychiatry, Penn State University College of Medicine, 500 University Dr., Hershey, PA, 17033, USA.
3
Exposure Measurements and Analysis Branch, Human Exposure and Atmospheric Sciences Division, U.S. EPA, MD-E205-04, Research Triangle Park, NC, 27711, USA.4Department of Cardiovascular Sciences, Brody School of Medicine, and the East Carolina Heart Institute and East Carolina University, Ste C, 2315 Executive Cir, Greenville, NC, 27834, USA.
Authors’contributions
FH performed statistical analysis and drafted the manuscript. MLS built the statistical models and wrote the statistical methods section. RS contributed to the data collection and revision of the manuscript. EOB and ANV suggested major revisions of the manuscript. RWW contributed to the air pollution data collection and revision of the paper. RW contributed to the interpretation and methods of the statistical modeling. WEC contributed in the revision of the paper and interpretation of the ECG variables. DL, principle investigator of the APACR study, conceptualized the hypothesis and conducted the data collection, made major contributions in the interpretation of the results, and writing of the paper. All authors read and approved the final manuscript.
Competing interests
The authors declare that they have no competing interests.
Received: 21 July 2010 Accepted: 8 November 2010 Published: 8 November 2010
References
1. Franklin M, Zeka A, Schwartz J:Association between PM2.5 and all-cause and specific-cause mortality in 27 US communities.J Expo Sci Environ Epidemiol2007,17:279-287.
2. Franklin M, Koutrakis P, Schwartz P:The role of particle composition on the association between PM2.5 and mortality.Epidemiology2008,
19:680-689.
3. Ostro B, Broadwin R, Green S, Feng W, Lipsett M:Fine particulate air pollution and mortality in nine California counties: results from CALFINE.
Environ Health Perspect2006,114:29-33.
4. Zanobetti A, Schwartz J:The effect of fine and coarse particulate air pollution on mortality: a national analysis.Environ Health Perspect2009,
117:898-903.
5. Campen MJ, McDonald JD, Reed MD, Seagrave J:Fresh gasoline emissions, not paved road dust, alter cardiac repolarization in ApoE-/- mice.
Cardiovasc Toxicol2006,6:199-210.
6. Gold DR, Litonjua AA, Zanobetti A, Coull BA, Schwartz J, MacCallum G, Verrier RL, Nearing BD, Canner MJ, Suh H, Stone PH:Air pollution and ST-segment depression in elderly subjects.Environ Health Perspect2005,
113:883-887.
7. Wellenius GA, Coull BA, Godleski JJ, Koutrakis P, Okabe K, Savage ST, Lawrence JE, Murthy GGK, Verrier RL:Inhalation of concentrated ambient air particles exacerbates myocardial ischemia in conscious dogs.Environ Health Perspect2003,111:402-408.
8. Zareba W, Nomura A, Couderc JP:Cardiovascular effects of air pollution: what to measure in ECG?Environ Health Perspect2001,109(Suppl 4):533-538.
9. Zhang Z, Whitsel EA, Quibrera PM, Smith RL, Liao D, Anderson GL, Prineas RJ:Ambient fine particulate matter exposure and myocardial ischemia in the Environmental Epidemiology of Arrhythmogenesis in the Women’s Health Initiative (EEAWHI) study.Environ Health Perspect 2009,117:751-756.
10. Pekkanen J, Peters A, Hoek G, Tiittanen P, Brunekreef B, de Hartog J, Heinrich J, Ibald-Mulli A, Kreyling WG, Lanki T, Timonen KL, Vanninen E:
Particulate air pollution and risk of ST-segment depression during repeated submaximal exercise tests among subjects with coronary heart disease: the Exposure and Risk Assessment for Fine and Ultrafine Particles in Ambient Air (ULTRA) study.Circulation2002,106:933-938. 11. Deanfield JE, Shea M, Ribiero P, de Landsheere CM, Wilson RA, Horlock P,
Selwyn AP:Transient ST-segment depression as a marker of myocardial ischemia during daily life.Am J Cardiol1984,54:1195-1200.
12. Kleber AG:ST-segment elevation in the electrocardiogram: a sign of myocardial ischemia.Cardiovasc Res2000,45:111-118.
13. He F, Shaffer ML, Li X, Rodriguez-Colon S, Wolbrette DL, Williams R, Cascio WE, Liao D:Individual-level PM2.5exposure and the time course of
impaired heart rate variability: the APACR Study.J Expo Sci Environ Epidemiol2010.
14. Liao D, Shaffer ML, Rodriguez-Colon S, He F, Li X, Wolbrette DL, Yanosky J, Cascio WE:Acute adverse effects of fine particulate air pollution on ventricular repolarization.Environ Health Perspect2010,118:1010-1015. 15. Howard-Reed C, Rea AW, Zufall MJ, Burke JM, Williams RW, Suggs JC,
Sheldon LS, Walsh D, Kwok R:Use of a continuous nephelometer to measure personal exposure to particles during the U.S. Environmental Protection Agency Baltimore and Fresno Panel studies.J Air Waste Manag Assoc2000,50:1125-1132.
16. Rea AW, Zufall MJ, Williams RW, Sheldon L, Howard-Reed C:The influence of human activity patterns on personal PM exposure: a comparative analysis of filter-based and continuous particle measurements.J Air Waste Manag Assoc2001,51:1271-1279.
17. Wallace L, Williams R, Rea A, Corghan C:Continuous weeklong measurements of personal exposures and indoor concentrations of fine particles for 37 health-impaired North Carolina residents for up to four seasons.Atmos Environ2006,40:399-414.
19. Hamlett A, Ryan L, Serrano-Trespalacios P, Wolfinger R:Mixed models for assessing correlation in the presence of replication.J Air Waste Manag Assoc2003,53:442-450.
20. Task Force of the European Society of Cardiology and the North American Society of Pacing and Electrophysiology:Heart rate variability: standards of measurement, physiological interpretation and clinical use.Circulation 1996,93:1043-1065.
21. Almon S:The distributed lag between capital appropriations and expenditures.Econometrica1965,33:178-196.
22. Pope CA, Schwartz J:Time series for the analysis of pulmonary health data.Am J Respir Crit Care Med1996,154:S229-S233.
23. Schwartz J:The distributed lag between air pollution and daily deaths.
Epidemiology2000,11:320-326.
24. Laird NM, Ware JH:Random-effects models for longitudinal data.
Biometrics1982,38:963-974.
25. Fitzmaurice GM, Laird NM, Ware JH:Applied Longitudinal Analysis.
Hoboken, New Jersey: John Wiley & Sons; 2004.
26. Brook RD, Franklin B, Cascio W, Hong Y, Howard G, Lipsett M, Luepker R, Mittleman M, Samet J, Smith SCJ, Tager I:Air pollution and cardiovascular disease: a statement for healthcare professionals from the Expert Panel on Population and Prevention Science of the American Heart Association.Circulation2004,109:2655-2671.
27. Berger A, Zareba W, Schneider A, Ruckerl R, Ibald-Mulli A, Cyrys J, Wichmann H, Peters A:Runs of ventricular and supraventricular tachycardia triggered by air pollution in patients with coronary heart disease.J Occup Environ Med2006,48:1149-1158.
28. Creason J, Neas L, Walsh D, Williams R, Sheldon L, Liao D, Shy C:Particulate matter and heart rate variability among elderly retirees: the Baltimore 1998 PM study.J Expo Anal Environ Epidemiol2001,11:116-122. 29. Gold DR, Litonjua A, Schwartz J, Lovett E, Larson A, Nearing B, Allen G,
Verrier M, Cherry R, Verrier R:Ambient pollution and heart rate variability.
Circulation2000,101:1267-1273.
30. Liao D, Creason J, Shy C, Williams R, Watts R, Zweidinger R:Daily variation of particulate air pollution and poor cardiac autonomic control in the elderly.Environ Health Perspect1999,107:521-525.
31. Liao D, Duan Y, Whitsel EA, Zheng Z, Heiss G, Chinchilli VM, Lin H:
Association of higher levels of ambient criteria pollutants with impaired cardiac autonomic control: a population-based study.Am J Epidemiol 2004,159:768-777.
32. Pope CA, Verrier RL, Lovett EG, Larson AC, Raizenne ME, Kanner RE, Schwartz J, Villegas GM, Gold DR, Dockery DW:Heart rate variability associated with particulate air pollution.Am Heart J1999,138:890-899. 33. Ghelfi E, Rhoden CR, Wellenius GA, Lawrence J, Gonzalez-Flecha B:Cardiac
oxidative stress and electrophysiological changes in rats exposed to concentrated ambient particles are mediated by TRP-dependent pulmonary reflexes.Toxicol Sci2008,102:328-336.
34. Henneberger A, Zareba W, Ibald-Mulli A, Ruckerl R, Cyrys J, Couderc J, Mykins B, Woelke G, Wichmann H, Peters A:Repolarization changes induced by air pollution in ischemic heart disease patients.Environ Health Perspect2005,113:440-446.
35. Lux RL, Pope CA:Air pollution effects on ventricular repolarization.Res Rep Health Eff Inst2009,141:3-20, discussion 21-8.
36. Samet JM, Rappold A, Graff D, Cascio WE, Berntsen JH, Huang YT, Herbst M, Bassett M, Montilla T, Hazucha MJ, Bromberg PA, Devlin RB:Concentrated ambient ultrafine particle exposure induces cardiac changes in young healthy volunteers.Am J Respir Crit Care Med2009,179:1034-1042. 37. Yue W, Schneider A, Stolzel M, Ruckerl R, Cyrys J, Pan X, Zareba W,
Koenig W, Wichmann H, Peters A:Ambient source-specific particles are associated with prolonged repolarization and increased levels of inflammation in male coronary artery disease patients.Mutat Res2007,
621:50-60.
38. Dockery DW, Luttmann-Gibson H, Rich DQ, Link MS, Mittleman MA, Gold DR, Koutrakis P, Schwartz JD, Verrier RL:Association of air pollution with increased incidence of ventricular tachyarrhythmias recorded by implanted cardioverter defibrillators.Environ Health Perspect2005,
113:670-674.
39. Liao D, Whitsel EA, Duan Y, Lin H, Quibrera PM, Smith R, Peuquet DJ, Prineas RJ, Zhang Z, Anderson G:Ambient particulate air pollution and ectopy–the environmental epidemiology of arrhythmogenesis in Women’s Health Initiative Study, 1999-2004.J Toxicol Environ Health A 2009,72:30-38.
40. Peters A, Liu E, Verrier RL, Schwartz J, Gold DR, Mittleman M, Baliff J, Oh JA, Allen G, Monahan K, Dockery DW:Air pollution and incidence of cardiac arrhythmia.Epidemiology2000,11:11-17.
41. Vedal S, Rich K, Brauer M, White R, Petkau J:Air pollution and cardiac arrhythmias in patients with implantable cardioverter defibrillators.Inhal Toxicol2004,16:353-362.
42. Campen MJ, Babu NS, Helms GA, Pett S, Wernly J, Mehran R, McDonald JD:
Nonparticulate components of diesel exhaust promote constriction in coronary arteries from ApoE-/- mice.Toxicol Sci2005,88:95-102. 43. Cavallari JM, Fang SC, Eisen EA, Schwartz J, Hauser R, Herrick RF,
Christiani DC:Time course of heart rate variability decline following particulate matter exposures in an occupational cohort.Inhal Toxicol 2008,20:415-422.
44. Brook RD, Brook JR, Urch B, Vincent R, Rajagopalan S, Silverman F:
Inhalation of fine particulate air pollution and ozone causes acute arterial vasoconstriction in healthy adults.Circulation2002,105:1534-1536. 45. Mills NL, Tornqvist H, Robinson SD, Gonzalez M, Darnley K, MacNee W,
Boon NA, Donaldson K, Blomberg A, Sandstrom T, Newby DE:Diesel exhaust inhalation causes vascular dysfunction and impaired endogenous fibrinolysis.Circulation2005,112:3930-3936.
46. Clarke RW, Coull B, Reinisch U, Catalano P, Killingsworth CR, Koutrakis P, Kavouras I, Murthy GG, Lawrence J, Lovett E, Wolfson JM, Verrier RL, Godleski JJ:Inhaled concentrated ambient particles are associated with hematologic and bronchoalveolar lavage changes in canines.Environ Health Perspect2000,108:1179-1187.
47. Savage ST, Lawrence JE, Coull BA, Okabe K, Wolde-Mariam W, Wellenius GA:
Hematologic response to inhalation of concentrated air particles (CAPs) and transient myocardial ischemia (MI) [abstract].Am J Respir Crit Care Med2002,165:A304.
48. Seaton A, Soutar A, Crawford V, Elton R, McNerlan S, Cherrie J, Watt M, Agius R, Stout R:Particulate air pollution and the blood.Thorax1999,
54:1027-1032.
49. Brugada P, Brugada J:Right bundle branch block, persistent ST segment elevation and sudden cardiac death: a distinct clinical and
electrocardiographic syndrome. A multicenter report.J Am Coll Cardiol 1992,20:1391-1396.
doi:10.1186/1476-069X-9-68
Cite this article as:Heet al.:Acute effects of fine particulate air pollution on ST segment height: A longitudinal study.Environmental Health20109:68.
Submit your next manuscript to BioMed Central and take full advantage of:
• Convenient online submission
• Thorough peer review
• No space constraints or color figure charges
• Immediate publication on acceptance
• Inclusion in PubMed, CAS, Scopus and Google Scholar
• Research which is freely available for redistribution