R E S E A R C H
Open Access
Integrated analysis of gene expression
changes associated with coronary
artery disease
Liu Miao
1, Rui-Xing Yin
1,2,3*, Feng Huang
1,2,3, Shuo Yang
1, Wu-Xian Chen
1and Jin-Zhen Wu
1Abstract
Background:This study investigated the pathways and genes involved in coronary artery disease (CAD) and the associated mechanisms.
Methods:Two array data sets of GSE19339 and GSE56885 were downloaded. The limma package was used to analyze the differentially expressed genes (DEGs) in normal and CAD specimens. Examination of DEGs through Kyoto Encyclopedia of Genes and Genomes (KEGG) pathway enrichment and Gene Ontology annotation was achieved by Database for Annotation, Visualization and Integrated Discovery (DAVID). The Cytoscape software facilitated the establishment of the protein-protein interaction (PPI) network and Molecular Complex Detection (MCODE) was performed for the significant modules.
Results:We identified 413 DEGs (291 up-regulated and 122 down-regulated). Approximately 256 biological processes, only 1 cellular component, and 21 molecular functions were identified by GO analysis and 10 pathways were enriched by KEGG. Moreover, 264 protein pairs and 64 nodes were visualized by the PPI network. After the MCODE analysis, the top 4 high degree genes, including interleukin 1 beta (IL1B, degree = 29), intercellular adhesion molecule 1 (ICAM1, degree = 25), Jun proto-oncogene (JUN, degree = 23) and C-C motif chemokine ligand 2 (CCL2, degree = 20) had been identified to validate in RT-PCR and Cox proportional hazards regression between CAD and normals.
Conclusions:The relative expression ofIL1B,ICAM1andCCL2was higher in CAD than in normal controls (P< 0.05–0. 001), but onlyIL1BandCCL2genes were confirmed after testing the gene expression in blood and/or analyzing in Cox proportional hazards regression (P< 0.05–0.001), and the proper mechanism may involve in the AGE-RAGE signaling pathway, fluid shear stress, the tumor necrosis factor (TNF) and cytokine-cytokine receptor interaction.
Keywords:Array data, Gene ontology annotation, Kyoto encyclopedia of genes and genomes (KEGG) pathway, Database for annotation, Visualization and integrated discovery, Protein-protein interaction (PPI) network, Gene expression and cox proportional hazards regression
Background
As the number one cause of mortality, coronary artery disease (CAD) contributes to approximately 17 million deaths every year across the world [1], and almost 700,000 deaths due to CAD are recorded annually in China [2].
Being a complicated and multifactorial condition, CAD results from a variety of environmental exposures and genetic variation, including gender, age, diabetes, hyper-tension, dyslipidemia, cigarette smoking, and family his-tory [3–7]. To some extent reaching an agreement about the early prevention of CAD would be effective.
As a practical way to identify gene expression changes, a microarray analysis may be a useful method to help in the early diagnosis of CAD [8]. However, numerous previous studies reveal that microarray results are not reproducible or sensitive to the changes in information [9, 10]. Even worse, when over 50 thousand probes in a microarray
© The Author(s). 2019Open AccessThis article is distributed under the terms of the Creative Commons Attribution 4.0 International License (http://creativecommons.org/licenses/by/4.0/), which permits unrestricted use, distribution, and reproduction in any medium, provided you give appropriate credit to the original author(s) and the source, provide a link to the Creative Commons license, and indicate if changes were made. The Creative Commons Public Domain Dedication waiver (http://creativecommons.org/publicdomain/zero/1.0/) applies to the data made available in this article, unless otherwise stated. * Correspondence:[email protected]
1Department of Cardiology, Institute of Cardiovascular Diseases, The First
Affiliated Hospital, Guangxi Medical University, Nanning 530021, Guangxi, People’s Republic of China
2Guangxi Key Laboratory Base of Precision Medicine in
Cardio-cerebrovascular Disease Control and Prevention, 6 Shuangyong Road, Nanning 530021, Guangxi, People’s Republic of China
were used to analyze hundreds of samples, only the in-accuracy of potential predictors was found.
With these situations, an integrated analysis may be used to increase the integrality and reliability of the con-clusions. In this way, we wanted to achieve a more pre-cise method of detecting differentially expressed genes, and aimed to find their potential biological functions. The Gene Expression Omnibus (GEO, http://www.ncbi. nlm.nih.gov/geo/) [11] is a global free-access repository of next-generation sequence functional genomic data sets and high-throughput microarray deposited by re-searchers worldwide. The information in these databases can be freely downloaded in many formats. In the current study, we analyzed two public microarray datasets from the GEO repository to determine the genes that had dif-ferential expression in individuals suffering from CAD compared to controls using combined P values and we attempted to provide advice on the bio-labelling for on time safeguarding and therapy according to the features of these genes.
Materials and methods Affymetrix microarray data
There were two gene expression profile data sets. GSE19339 was retrieved from GPL570 Affymetrix Human Genome U133 Plus 2.0 array. GSE56885 was derived from the GPL15207 Affymetrix Human Genome array. The present study included 14 samples, which comprised 8 CAD samples and 6 normal/healthy samples. However, the specific results of each sample were not supported. In the current research, all of these samples were selected. The CEL files were transformed into the expression value matrix using the Affy package in R with RMA methods to normalize the expression value matrix [12]. Afterwards, the Bioconductor in R was used to convert the probe data to gene [13]. Any gene that corresponded to multiple probes, the mean expression value of such a gene should be chosen.
Differentially expressed genes (DEGs) analysis
The limma package [14] in R enabled identification of DEGs based on the comparison between the control and the CAD samples. The threshold values were |log2fold-change| > 2 and adjustedP< 0.05.
GO and pathway enrichment analyses
Studies on large-scale transcription data or genomic data were usually performed based on Gene Ontology (GO) analyses [15]. The Kyoto Encyclopedia of Genes and Ge-nomes (KEGG) pathway database harbors information relating to the networks among genes or molecules, which was used for genetic studies [16]. The Database for Annotation, Visualization and Integrated Discovery (DAVID) contained analytical tools and integrated
biological information which was used to interpret the functions of large protein or gene pools [17]. Here, DA-VID (version 6.8) was used to enrich the GO functions and pathways of specific DEGs in the KEGG (http:// www.genome.ad.jp/kegg/) and GO ( http://www.geneon-tology.org) databases and the R package Goplot [18] with an adjustedP-value (q-value) of < 0.05.
Construction of PPI interaction network
The Search Tool for the Retrieval of Interacting Genes (STRING V10.5) [19] database (https://string-db.org/) is a useful platform to study the interactions between ex-perimental and predicted proteins. The predictive cap-acity of STRING is based on text mining, databases, co-expression experiments, co-occurrence, gene fusion and neighborhood which are achieved using the Cytos-cape (version 3.60) [20]. Then, a combined score was assigned to the interactions among protein pairs in the database. To examine the key genes in the network and potential PPI correlations, the DEGs were mapped on the data and the cut-off value was set as a combined score of > 0.9 [21]. The significance of protein nodes in the network was described using a degree. All of the three protocols were handled by R software package igraph version 1.0.1 [22].
Module analysis
Protein networks such as the network module contain useful information regarding the biological functions of biological molecules. The outstanding clustering module was determined using the Cytoscape software package Molecular Complex Detection (MCODE) [23] . Subse-quently, the DAVID online tool was used to analyze the KEGG pathway enriched by the DEGs among the mod-ules. Count ≥2 and EASE ≤0.05 were chosen as the cut-off values and MCODE score > 6 as the threshold for the subsequent analysis.
Study population and follow-up
their major branches (branch diameter≥2 mm). To analyze the influence of hub gene on the prognosis of CAD, after coronary angiography, we divided the individuals into two groups, including CAD patients and controls. Patients with a previous CAD attack, type I diabetes mellitus and con-genital heart disease were excluded [24]. The absence of CAD in healthy individuals was confirmed through clinical examination, medical history and questionnaires. The med-ical history and general information of all subjects were ob-tained by a standard questionnaire. All protocols followed the guidelines of the revised (in 2008) Declaration of Helsinki of 1975 (http://www.wma.net/en/30publications/ 10policies/b3/). Informed consent was obtained from all subjects involved in the genetic analysis and epidemiologic investigation. Our study was approved by the Ethics Com-mittee of the First Affiliated Hospital, Guangxi Medical University (No: Lunshen-2011-KY-Guoji-001; Mar. 7, 2011) [25]. During the initial examination, clinical information was obtained from the medical records.
Serum hub gene determination
RT-qPCR was used to validate the four significantly dys-regulated mRNAs obtained from the microarray results out of the 206 researchers. The PBMCs extracted from blood samples were used to isolate total RNAs were using TRIzol reagent (Invitrogen). The TransScript R Frist-Strand cDNA Synthesis SuperMix (Transgen, China) was used to synthesize cDNA as per the manu-facturer’s protocols. Additional file1 Table S1 shows the sequences of primers used to probe the specific genes which were designed by Sangon Biotech (Shanghai, China) together with the reaction conditions. All sam-ples were put into a 96-well plates and run in triplicate using the LightCycler R 96 and FastStart Essential DNA Green Master (Roche Diagnostics GmbH, Germany). The fit point method was used to calculate the Quantifi-cation cycles (Cq) by the LightCycler R 96 Software, (Version 1.1 provided by Roche). The mRNA levels of the genes were normalized to the expression of GAPDH as a reference. All methods (qPCR normalization, primer design, collection, preparation and storage of sample) were carried out in line with the MIQE guidelines.
Statistical analyses
SPSS 21.0 package (SPSS Inc. Chicago, IL, USA) was used for statistical analysis. Differences in the rates be-tween groups were compared using a chi-square. Con-tinuous data are presented as the means ± SD. Nominal significance was considered for a raw P value of < 0.05. Multivariate Cox proportional-hazards regression and univariate analyses were used to determine the correl-ation between the clinical variables and genes with the end point of cardiac adverse events. The univariate and
multivariate tests were carried out using two-sided Cox univariate analyses.
Results Preprocessing
After analysis of GSE19339 and GSE56885, from each gene expression and profile, we obtained a total of 54,560 expression probes. The preprocessed data are shown in Additional file 2 Figure S1. When all of the median values were in the same horizontal line, the data were comfortable normalized.
Identified differentially expressed genes (DEGs)
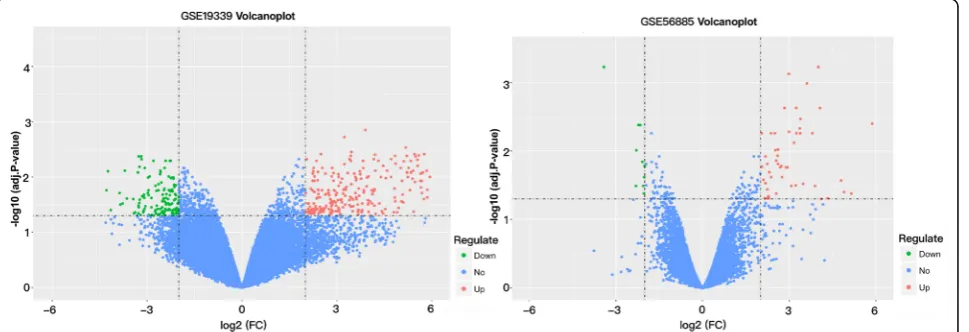
Heat map of differentially expressed genes is presented in Fig. 1. As shown in Fig.2, with |log 2 (fold change) |≥2, and an adjusted-P value < 0.05. A sum of 402 DEGs were obtained, of which 140 were down-regulated while 262 were up-regulated in GSE19339. At the same time, 71 DEGs in GSE56885 were found: 10 genes were down-regulated and 61 were up-regulated. Some probes were too high or too low to be expressed. We have deter-mined such probes as outliers and need to be removed without further analysis. In cases where many probes cor-responded to one gene, we used the average expression value to screen for differential genes. After quality control and removing numerous incorrect expression values, we took all of the 413 DEGs (122 down-regulated and 291 up-regulated) into consideration.
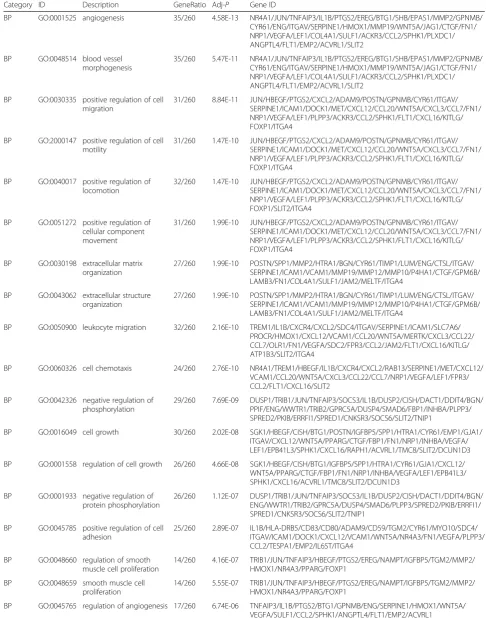
Analysis of gene ontology functions and KEGG pathways enrichment of DEGs
Protein-protein interaction (PPI) network construction
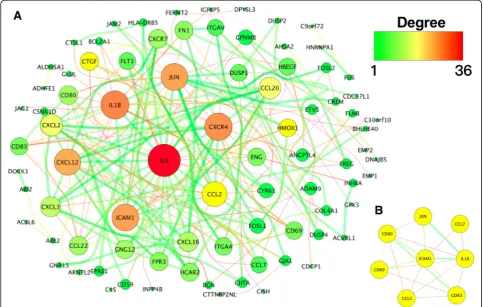
Data analysis was performed on the STRING database out of which 264 protein pairs and 64 nodes were re-vealed with a combined score > 0.9. The top 7 high de-gree genes, including interleukin 8 (IL8, dede-gree = 34), interleukin 1 beta (IL1B, degree = 29), C-X-C motif che-mokine receptor 4 (CXCR4, degree = 27), intercellular ad-hesion molecule 1 (ICAM1, degree = 25), Jun proto-oncogene (JUN, degree = 23), C-X-C motif chemo-kine ligand 12 (CXCL12, degree = 21) and C-C motif che-mokine ligand 2 (CCL2, degree = 20), are shown in Fig.6a.
Module analysis
For the detection by MCODE with Cytoscape app, only one module with a score > 6 was found. As shown in
Fig. 6b, the degrees of hub nodes of the ICAM, IL1B, JUNandCCL2were the highest in this module.
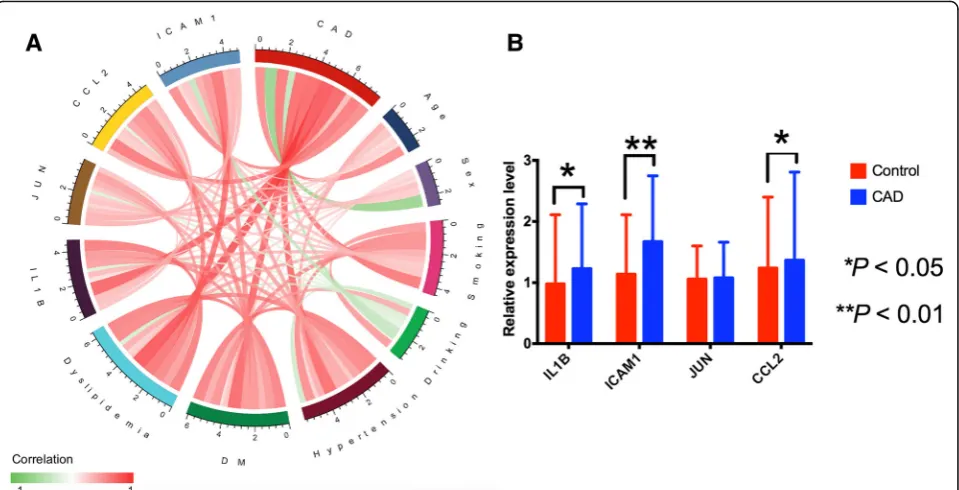
Association of serum hub gene levels with CAD
Figure7a shows the relationship among CAD, genes and environmental exposures and scale represents the specific correlation coefficient. Validation of the hypothesized data was done by RT-qPCR. The mRNA levels of IL1B, JUN, ICAM1 and CCL2 were determined to verify the major conclusions derived from the microarray results of the peripheral blood specimen. In general, results of the microarray analysis were consistent with those of RT-qPCR analysis. But, RT-RT-qPCR results showed that the ex-pression of IL1B, ICAM1and CCL2was higher in CAD patients than in normal controls (Fig.7b).
Fig. 1Heat map of differentially expressed genes. The depth of color reflects the level of differential expression (represents by log FC).aGSE19339; (b): GSE56885
Table 1GO for differentially expressed genes
Category ID Description GeneRatio Adj-P Gene ID
BP GO:0001525 angiogenesis 35/260 4.58E-13 NR4A1/JUN/TNFAIP3/IL1B/PTGS2/EREG/BTG1/SHB/EPAS1/MMP2/GPNMB/ CYR61/ENG/ITGAV/SERPINE1/HMOX1/MMP19/WNT5A/JAG1/CTGF/FN1/ NRP1/VEGFA/LEF1/COL4A1/SULF1/ACKR3/CCL2/SPHK1/PLXDC1/ ANGPTL4/FLT1/EMP2/ACVRL1/SLIT2
BP GO:0048514 blood vessel morphogenesis
35/260 5.47E-11 NR4A1/JUN/TNFAIP3/IL1B/PTGS2/EREG/BTG1/SHB/EPAS1/MMP2/GPNMB/ CYR61/ENG/ITGAV/SERPINE1/HMOX1/MMP19/WNT5A/JAG1/CTGF/FN1/ NRP1/VEGFA/LEF1/COL4A1/SULF1/ACKR3/CCL2/SPHK1/PLXDC1/ ANGPTL4/FLT1/EMP2/ACVRL1/SLIT2
BP GO:0030335 positive regulation of cell migration
31/260 8.84E-11 JUN/HBEGF/PTGS2/CXCL2/ADAM9/POSTN/GPNMB/CYR61/ITGAV/ SERPINE1/ICAM1/DOCK1/MET/CXCL12/CCL20/WNT5A/CXCL3/CCL7/FN1/ NRP1/VEGFA/LEF1/PLPP3/ACKR3/CCL2/SPHK1/FLT1/CXCL16/KITLG/ FOXP1/ITGA4
BP GO:2000147 positive regulation of cell motility
31/260 1.47E-10 JUN/HBEGF/PTGS2/CXCL2/ADAM9/POSTN/GPNMB/CYR61/ITGAV/ SERPINE1/ICAM1/DOCK1/MET/CXCL12/CCL20/WNT5A/CXCL3/CCL7/FN1/ NRP1/VEGFA/LEF1/PLPP3/ACKR3/CCL2/SPHK1/FLT1/CXCL16/KITLG/ FOXP1/ITGA4
BP GO:0040017 positive regulation of locomotion
32/260 1.47E-10 JUN/HBEGF/PTGS2/CXCL2/ADAM9/POSTN/GPNMB/CYR61/ITGAV/ SERPINE1/ICAM1/DOCK1/MET/CXCL12/CCL20/WNT5A/CXCL3/CCL7/FN1/ NRP1/VEGFA/LEF1/PLPP3/ACKR3/CCL2/SPHK1/FLT1/CXCL16/KITLG/ FOXP1/SLIT2/ITGA4
BP GO:0051272 positive regulation of cellular component movement
31/260 1.99E-10 JUN/HBEGF/PTGS2/CXCL2/ADAM9/POSTN/GPNMB/CYR61/ITGAV/ SERPINE1/ICAM1/DOCK1/MET/CXCL12/CCL20/WNT5A/CXCL3/CCL7/FN1/ NRP1/VEGFA/LEF1/PLPP3/ACKR3/CCL2/SPHK1/FLT1/CXCL16/KITLG/ FOXP1/ITGA4
BP GO:0030198 extracellular matrix organization
27/260 1.99E-10 POSTN/SPP1/MMP2/HTRA1/BGN/CYR61/TIMP1/LUM/ENG/CTSL/ITGAV/ SERPINE1/ICAM1/VCAM1/MMP19/MMP12/MMP10/P4HA1/CTGF/GPM6B/ LAMB3/FN1/COL4A1/SULF1/JAM2/MELTF/ITGA4
BP GO:0043062 extracellular structure organization
27/260 1.99E-10 POSTN/SPP1/MMP2/HTRA1/BGN/CYR61/TIMP1/LUM/ENG/CTSL/ITGAV/ SERPINE1/ICAM1/VCAM1/MMP19/MMP12/MMP10/P4HA1/CTGF/GPM6B/ LAMB3/FN1/COL4A1/SULF1/JAM2/MELTF/ITGA4
BP GO:0050900 leukocyte migration 32/260 2.16E-10 TREM1/IL1B/CXCR4/CXCL2/SDC4/ITGAV/SERPINE1/ICAM1/SLC7A6/ PROCR/HMOX1/CXCL12/VCAM1/CCL20/WNT5A/MERTK/CXCL3/CCL22/ CCL7/OLR1/FN1/VEGFA/SDC2/FPR3/CCL2/JAM2/FLT1/CXCL16/KITLG/ ATP1B3/SLIT2/ITGA4
BP GO:0060326 cell chemotaxis 24/260 2.76E-10 NR4A1/TREM1/HBEGF/IL1B/CXCR4/CXCL2/RAB13/SERPINE1/MET/CXCL12/ VCAM1/CCL20/WNT5A/CXCL3/CCL22/CCL7/NRP1/VEGFA/LEF1/FPR3/ CCL2/FLT1/CXCL16/SLIT2
BP GO:0042326 negative regulation of phosphorylation
29/260 7.69E-09 DUSP1/TRIB1/JUN/TNFAIP3/SOCS3/IL1B/DUSP2/CISH/DACT1/DDIT4/BGN/ PPIF/ENG/WWTR1/TRIB2/GPRC5A/DUSP4/SMAD6/FBP1/INHBA/PLPP3/ SPRED2/PKIB/ERRFI1/SPRED1/CNKSR3/SOCS6/SLIT2/TNIP1
BP GO:0016049 cell growth 30/260 2.02E-08 SGK1/HBEGF/CISH/BTG1/POSTN/IGFBP5/SPP1/HTRA1/CYR61/EMP1/GJA1/ ITGAV/CXCL12/WNT5A/PPARG/CTGF/FBP1/FN1/NRP1/INHBA/VEGFA/ LEF1/EPB41L3/SPHK1/CXCL16/RAPH1/ACVRL1/TMC8/SLIT2/DCUN1D3
BP GO:0001558 regulation of cell growth 26/260 4.66E-08 SGK1/HBEGF/CISH/BTG1/IGFBP5/SPP1/HTRA1/CYR61/GJA1/CXCL12/ WNT5A/PPARG/CTGF/FBP1/FN1/NRP1/INHBA/VEGFA/LEF1/EPB41L3/ SPHK1/CXCL16/ACVRL1/TMC8/SLIT2/DCUN1D3
BP GO:0001933 negative regulation of protein phosphorylation
26/260 1.12E-07 DUSP1/TRIB1/JUN/TNFAIP3/SOCS3/IL1B/DUSP2/CISH/DACT1/DDIT4/BGN/ ENG/WWTR1/TRIB2/GPRC5A/DUSP4/SMAD6/PLPP3/SPRED2/PKIB/ERRFI1/ SPRED1/CNKSR3/SOCS6/SLIT2/TNIP1
BP GO:0045785 positive regulation of cell adhesion
25/260 2.89E-07 IL1B/HLA-DRB5/CD83/CD80/ADAM9/CD59/TGM2/CYR61/MYO10/SDC4/ ITGAV/ICAM1/DOCK1/CXCL12/VCAM1/WNT5A/NR4A3/FN1/VEGFA/PLPP3/ CCL2/TESPA1/EMP2/IL6ST/ITGA4
BP GO:0048660 regulation of smooth muscle cell proliferation
14/260 4.16E-07 TRIB1/JUN/TNFAIP3/HBEGF/PTGS2/EREG/NAMPT/IGFBP5/TGM2/MMP2/ HMOX1/NR4A3/PPARG/FOXP1
BP GO:0048659 smooth muscle cell proliferation
14/260 5.55E-07 TRIB1/JUN/TNFAIP3/HBEGF/PTGS2/EREG/NAMPT/IGFBP5/TGM2/MMP2/ HMOX1/NR4A3/PPARG/FOXP1
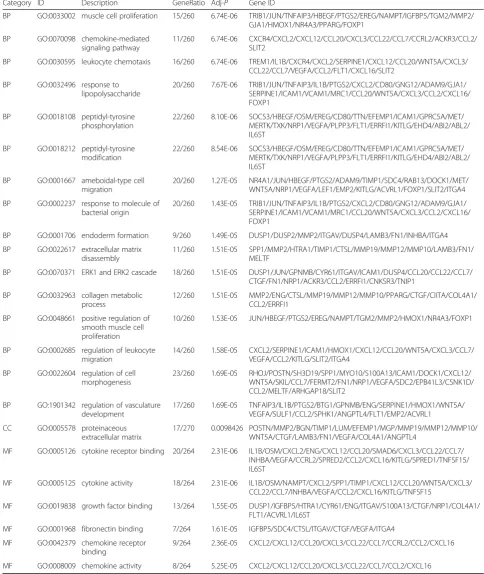
Table 1GO for differentially expressed genes(Continued)
Category ID Description GeneRatio Adj-P Gene ID
BP GO:0033002 muscle cell proliferation 15/260 6.74E-06 TRIB1/JUN/TNFAIP3/HBEGF/PTGS2/EREG/NAMPT/IGFBP5/TGM2/MMP2/ GJA1/HMOX1/NR4A3/PPARG/FOXP1
BP GO:0070098 chemokine-mediated signaling pathway
11/260 6.74E-06 CXCR4/CXCL2/CXCL12/CCL20/CXCL3/CCL22/CCL7/CCRL2/ACKR3/CCL2/ SLIT2
BP GO:0030595 leukocyte chemotaxis 16/260 6.74E-06 TREM1/IL1B/CXCR4/CXCL2/SERPINE1/CXCL12/CCL20/WNT5A/CXCL3/ CCL22/CCL7/VEGFA/CCL2/FLT1/CXCL16/SLIT2
BP GO:0032496 response to lipopolysaccharide
20/260 7.67E-06 TRIB1/JUN/TNFAIP3/IL1B/PTGS2/CXCL2/CD80/GNG12/ADAM9/GJA1/ SERPINE1/ICAM1/VCAM1/MRC1/CCL20/WNT5A/CXCL3/CCL2/CXCL16/ FOXP1
BP GO:0018108 peptidyl-tyrosine phosphorylation
22/260 8.10E-06 SOCS3/HBEGF/OSM/EREG/CD80/TTN/EFEMP1/ICAM1/GPRC5A/MET/ MERTK/TXK/NRP1/VEGFA/PLPP3/FLT1/ERRFI1/KITLG/EHD4/ABI2/ABL2/ IL6ST
BP GO:0018212 peptidyl-tyrosine modification
22/260 8.54E-06 SOCS3/HBEGF/OSM/EREG/CD80/TTN/EFEMP1/ICAM1/GPRC5A/MET/ MERTK/TXK/NRP1/VEGFA/PLPP3/FLT1/ERRFI1/KITLG/EHD4/ABI2/ABL2/ IL6ST
BP GO:0001667 ameboidal-type cell migration
20/260 1.27E-05 NR4A1/JUN/HBEGF/PTGS2/ADAM9/TIMP1/SDC4/RAB13/DOCK1/MET/ WNT5A/NRP1/VEGFA/LEF1/EMP2/KITLG/ACVRL1/FOXP1/SLIT2/ITGA4
BP GO:0002237 response to molecule of bacterial origin
20/260 1.43E-05 TRIB1/JUN/TNFAIP3/IL1B/PTGS2/CXCL2/CD80/GNG12/ADAM9/GJA1/ SERPINE1/ICAM1/VCAM1/MRC1/CCL20/WNT5A/CXCL3/CCL2/CXCL16/ FOXP1
BP GO:0001706 endoderm formation 9/260 1.49E-05 DUSP1/DUSP2/MMP2/ITGAV/DUSP4/LAMB3/FN1/INHBA/ITGA4
BP GO:0022617 extracellular matrix disassembly
11/260 1.51E-05 SPP1/MMP2/HTRA1/TIMP1/CTSL/MMP19/MMP12/MMP10/LAMB3/FN1/ MELTF
BP GO:0070371 ERK1 and ERK2 cascade 18/260 1.51E-05 DUSP1/JUN/GPNMB/CYR61/ITGAV/ICAM1/DUSP4/CCL20/CCL22/CCL7/ CTGF/FN1/NRP1/ACKR3/CCL2/ERRFI1/CNKSR3/TNIP1
BP GO:0032963 collagen metabolic process
12/260 1.51E-05 MMP2/ENG/CTSL/MMP19/MMP12/MMP10/PPARG/CTGF/CIITA/COL4A1/ CCL2/ERRFI1
BP GO:0048661 positive regulation of smooth muscle cell proliferation
10/260 1.53E-05 JUN/HBEGF/PTGS2/EREG/NAMPT/TGM2/MMP2/HMOX1/NR4A3/FOXP1
BP GO:0002685 regulation of leukocyte migration
14/260 1.58E-05 CXCL2/SERPINE1/ICAM1/HMOX1/CXCL12/CCL20/WNT5A/CXCL3/CCL7/ VEGFA/CCL2/KITLG/SLIT2/ITGA4
BP GO:0022604 regulation of cell morphogenesis
23/260 1.69E-05 RHOJ/POSTN/SH3D19/SPP1/MYO10/S100A13/ICAM1/DOCK1/CXCL12/ WNT5A/SKIL/CCL7/FERMT2/FN1/NRP1/VEGFA/SDC2/EPB41L3/CSNK1D/ CCL2/MELTF/ARHGAP18/SLIT2
BP GO:1901342 regulation of vasculature development
17/260 1.69E-05 TNFAIP3/IL1B/PTGS2/BTG1/GPNMB/ENG/SERPINE1/HMOX1/WNT5A/ VEGFA/SULF1/CCL2/SPHK1/ANGPTL4/FLT1/EMP2/ACVRL1
CC GO:0005578 proteinaceous extracellular matrix
17/270 0.0098426 POSTN/MMP2/BGN/TIMP1/LUM/EFEMP1/MGP/MMP19/MMP12/MMP10/ WNT5A/CTGF/LAMB3/FN1/VEGFA/COL4A1/ANGPTL4
MF GO:0005126 cytokine receptor binding 20/264 2.31E-06 IL1B/OSM/CXCL2/ENG/CXCL12/CCL20/SMAD6/CXCL3/CCL22/CCL7/ INHBA/VEGFA/CCRL2/SPRED2/CCL2/CXCL16/KITLG/SPRED1/TNFSF15/ IL6ST
MF GO:0005125 cytokine activity 18/264 2.31E-06 IL1B/OSM/NAMPT/CXCL2/SPP1/TIMP1/CXCL12/CCL20/WNT5A/CXCL3/ CCL22/CCL7/INHBA/VEGFA/CCL2/CXCL16/KITLG/TNFSF15
MF GO:0019838 growth factor binding 13/264 1.55E-05 DUSP1/IGFBP5/HTRA1/CYR61/ENG/ITGAV/S100A13/CTGF/NRP1/COL4A1/ FLT1/ACVRL1/IL6ST
MF GO:0001968 fibronectin binding 7/264 1.61E-05 IGFBP5/SDC4/CTSL/ITGAV/CTGF/VEGFA/ITGA4
MF GO:0042379 chemokine receptor binding
9/264 2.36E-05 CXCL2/CXCL12/CCL20/CXCL3/CCL22/CCL7/CCRL2/CCL2/CXCL16
Fig. 3Functional enrichment analysis for the up-regulated DEGs. The y-axis indicates the identified Adj-Pvalue. The x-axis represents the Z-score. The light green background represents the biological process, and 34 functional enrichments are also shown in this. The light blue background represents the molecular function, and 6 functional enrichments are also shown in this
Demographic and cox regression analysis in patients with CAD
The demographic and biochemical characteristics of the participants in the two groups are presented in Table 2. Compared to CAD patients, there were more patients with
hypertension and those who smoked cigarettes in the controls. But age, dyslipidemia, diabetes mellitus, alcohol drinking, height, weight, body mass index (BMI), waist cir-cumference (WC), the level of systolic blood pressure (SBP), diastolic blood pressure (DBP), pulse pressure (PP), serum Fig. 5The enriched gene ontology terms and pathways of the differentially expressed genes (DEGs).abar plot is shown in the inner ring, with the color corresponding to the z-score and the height of the bar representing the significance of the term. The scatter plots of the expression levels (logFC) of the genes in each term are shown in the outer ring.bribbons linking the genes with their assigned terms. The logFC is represented by the blue-to-red coding near the marked genes
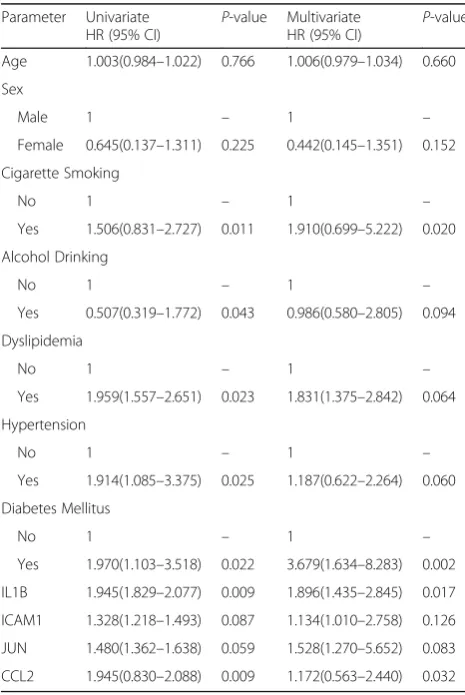
glucose, total cholesterol (TC), triglyceride (TG), low-density lipoprotein cholesterol (LDL-C) and high-density lipoprotein cholesterol (HDL-C) did not differ between controls and CAD patients. The predictors of CAD were further analyzed by univariate and multivariate Cox proportional hazards re-gression (Table 3). Following adjustment for variety clin-ical pathologclin-ical factors and social economic factors, we confirmed that cigarette smoking [95% confidence interval (CI), 0.831–2.727, hazard ratio (HR): 1.506;P= 0.020], dia-betes mellitus (95% CI, 1.634–8.283, P= 0.002 for HR: 3.679), and the overexpression of serum IL1B (95% CI, 1.435–2.845,P= 0.017 for HR: 1.896) andCCL2(95% CI, 0.563–2.440,P= 0.032 for HR: 1.172) genes were still con-sidered independent predictors for CAD.
Discussion
With the remarkable improvement in microarray expres-sion data, identifying abnormally expressed genes may help us to find and treat diseases. However, microarray data are not always reproducible or are too sensitive to errors [8]. With these situations, it may be a smart choice to remove the false positives by utilizing various datasets of parallel experimental designs. In the current study, we combined two different datasets of CAD to analyze their GO enrichments, KEGG pathways and PPI networks and modules to identify four significant and reproducible genes (IL1B, ICAM1, JUN and CCL2), which showed differential expression between the
patients and controls. However, when these genes were replicated in our CAD samples, we found that serum JUN expression levels were not significantly changed and only two genes (IL1B and CCL2) were verified through the Cox proportional hazards regression.
heart failure and dyspnea [34,35]. In our current study, we demonstrated that IL1B participated in four of the main biological processes (Fig. 5b), including angiogenesis, smooth muscle cell proliferation, positive regulation of angio-genesis and cytokine metabolic process. All of these bio-logical processes give rise to chronic immunoinflammatory pathological changes and finally result in atherosclerosis.
C-C motif chemokine ligand 2 (CCL2) participates in the genesis and progress of atherosclerosis [36–38]. The current study demonstrated thatCCL2participated in two of the main biological processes (Fig.5b), including angio-genesis and the positive regulation of angioangio-genesis. These two biological processes also contribute to atherosclerosis. Moreover,CCL2is considered as a risk factor for the pro-motion of atherosclerosis and for patients with CAD. Nu-merous studies reveal that high CCL2 levels in patients with CAD are associated with enhanced incidence of ad-verse cardiac outcomes and increased risk of long-term mortality [39,40]. Recently, a study showed whenCCL2 levels increased, plasma HDL2 levels decreased andCCL2
was negatively correlated with HDL2 [41]. This may be another mechanism of howCCL2results in CAD.
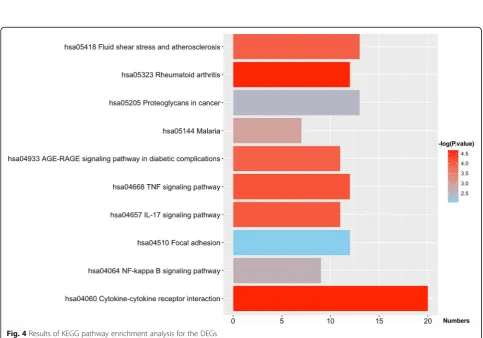
There were seven pathways containingIL1BandCCL2, ac-cording to the KEGG analysis, including rheumatoid arth-ritis, cytokine-cytokine receptor interaction, TNF signaling pathway, the IL-17 signaling pathway, the AGE-RAGE sig-naling pathway in diabetic complications and malaria, ath-erosclerosis and fluid shear stress. Shanmugam et al. reported that TNF-αsignaling exerted adverse effects to the cardiovascular tissues although it ameliorated chronic in-flammatory disease [42]. In atherosclerosis, Tuenter et al. found that presence of intraplaque haemorrhage and calcifi-cations was associated with elevated maximum shear stress [43]. Moreover, RAGE expression in many types of cell, in-cluding smooth muscle cells, endothelial cells and macro-phages may result in the pathogenesis of atherosclerosis, and give rise to the pathogenesis of myocardial dysfunction [44]. These findings demonstrate thatIL1BandCCL2cause ath-erosclerosis and finally result in CAD. Furthermore, when we repeated the validation in our experimental samples, Table 2Comparison of the demographics and lifestyle characteristics and the prevalence of related disease between the two groups
Parameter CAD Control test-statistic P
Number 110 96 – –
Male/female 57.53 ± 12.51 58.22 ± 12.83 1.682 0.195
Age (years)a 86/24 72/24 0.145 0.703
Height (cm) 155.64 ± 7.13 153.13 ± 6.93 1.495 0.181
Weight (kg) 60.71 ± 10.22 51.82 ± 7.94 24.419 1.65E-006
Body mass index (kg/m2) 31.44 ± 4.52 29.51 ± 3.22 29.224 1.97E-008
Waist circumference (cm) 84.55 ± 9.47 71.23 ± 6.91 20.321 2.98E-005
Smoking status [n(%)]b 62(64.6) 36(32.7) 10.429 0.001
Alcohol consumption [n(%)] 68(70.8) 78(70.9) 0.009 0.993
Systolic blood pressure (mmHg) 136.47 ± 22.16 128.24 ± 18.18 43.136 6.13E-012
Diastolic blood pressure (mmHg) 86.49 ± 13.15 81.54 ± 10.16 18.250 7.39E-005
Pulse pressure (mmHg) 52.42 ± 17.59 49.64 ± 14.28 28.317 3.63E-07
Glucose (mmol/L) 7.15 ± 2.45 5.94 ± 1.83 19.817 5.91E-005
Total cholesterol (mmol/L) 5.14 ± 1.07 4.94 ± 1.13 7.121 0.029
Triglyceride (mmol/L)c 1.78(1.22) 1.49(0.51) 8.441 0.021
HDL-C (mmol/L) 1.06 ± 0.27 1.51 ± 0.49 8.668 0.013
LDL-C (mmol/L) 2.88 ± 0.79 2.82 ± 0.84 9.497 0.007
ApoA1 (g/L) 1.29 ± 0.27 1.35 ± 0.25 0.364 0.558
ApoB (g/L) 0.86 ± 0.20 0.82 ± 0.19 1.492 0.233
ApoA1/ApoB 1.66 ± 0.57 1.67 ± 0.50 0.095 0.758
Dyslipidemia[n%] 60(62.5) 60(54.5) 0.667 0.414
Hypertension[n%] 82(85.4) 64(58.2) 9.201 0.002
Diabetes Mellitus[n%] 70(72.9) 72(65.5) 0.679 0.402
HDL-Chigh-density lipoprotein cholesterol,LDL-Clow-density lipoprotein cholesterol,ApoApolipoprotein a
Continuous data were presented as means ± SD and determined by two sidet-test b
A chi-square analysis was used to evaluate the difference of the rate between the groups c
using a blood gene expression and/or Cox proportional hazards regression, we obtained the same results, which might increase the credibility of the conclusions.
Conclusions
Two CAD microarray datasets from the GEO series were systematically analyzed in this study. Based on the expression level, GO enrichment, enriched pathway and protein-protein interaction analyses, four genes (IL1B, ICAM1, JUN and CCL2) were found to be significant meaning, but only two genes (IL1B andCCL2) were replicated in our samples by testing the gene expression in blood and/or analyzing with a Cox proportional hazards regression. The mechanism may be involved in the cytokine-cytokine receptor interaction, the TNF signaling pathway, fluid shear stress and the AGE-RAGE signaling pathway. But, additional experiments are warranted to validate these findings.
Additional files
Additional file 1:Table S1.PCR primers for quantitative real-time PCR. (PDF 70 kb)
Additional file 2:Figure S1.Box figure of gene expression data of normalization. (PDF 703 kb)
Abbreviations
Apo:Apolipoprotein; BMI: Body mass index; COL1A1: Collagen type I alpha 1 chain; DBP: Diastolic blood pressure; GEO: Gene Expression Omnibus; GO: Gene Ontology annotation; HDL-C: High-density lipoprotein cholesterol; HTG: Hypertriglyceridemia; KEGG: Kyoto Encyclopedia of Genes and Genomes pathway enrichment analyses; LDL-C: Low-density lipoprotein cholesterol; MCODE: Molecular Complex Detection; MetS: Metabolic syndrome; NCBI: National Center For Biotechnology Information; PP: Pulse pressure; PPI: Protein-protein interaction; SBP: Systolic blood pressure; SNP: Single nucleotide polymorphism; T2D: Type 2 diabetes mellitus; TG: Triglyceride; WC: Waist circumference
Acknowledgments
We are grateful to all the participants of this study and the staff from the Guangxi Key Laboratory Base of Precision Medicine in Cardio-cerebrovascular Disease Control and Prevention.
Funding
The authors acknowledge the essential role of the funding of the National Natural Science Foundation of China (No: 81460169) and the Innovation Project of Guangxi Graduate Education in this motif.
Availability of data and materials
The datasets used and/or analysed during the current study are available from the corresponding author on reasonable request.
Authors' contributions
L.M. conceived the study, participated in the design, undertook genotyping, performed the statistical analyses, and drafted the manuscript. R.-X.Y. conceived the study, participated in the design, carried out the epidemiological survey, collected the samples, and helped to draft the manuscript. F.H. and S.Y. collaborated to the genotyping. F.H., S.Y., W.-X.C. and J.-Z.W. carried out the epidemiological survey and collected the samples. All authors read and approved the final manuscript.
Ethics approval and consent to participate
The research design was approved by the Ethics Committee. The First Affiliated Hospital of Guangxi Medical University (No: Lunshen-2011-KY-Guoji-001; March 7, 2011). All procedures are conducted in conformity to ethical standards.
Consent for publication
Not applicable.
Competing interests
The authors declare that they have no competing interests.
Publisher’s Note
Springer Nature remains neutral with regard to jurisdictional claims in published maps and institutional affiliations.
Author details
1Department of Cardiology, Institute of Cardiovascular Diseases, The First
Affiliated Hospital, Guangxi Medical University, Nanning 530021, Guangxi, People’s Republic of China.2Guangxi Key Laboratory Base of Precision
Medicine in Cardio-cerebrovascular Disease Control and Prevention, 6 Shuangyong Road, Nanning 530021, Guangxi, People’s Republic of China.
3Guangxi Clinical Research Center for Cardio-cerebrovascular Diseases, 6
Shuangyong Road, Nanning 530021, Guangxi, People’s Republic of China. Table 3Univariate and multivariate Cox hazards regression
analysis of CAD
Parameter Univariate
HR (95% CI) P
-value Multivariate
HR (95% CI) P -value
Age 1.003(0.984–1.022) 0.766 1.006(0.979–1.034) 0.660
Sex
Male 1 – 1 –
Female 0.645(0.137–1.311) 0.225 0.442(0.145–1.351) 0.152
Cigarette Smoking
No 1 – 1 –
Yes 1.506(0.831–2.727) 0.011 1.910(0.699–5.222) 0.020
Alcohol Drinking
No 1 – 1 –
Yes 0.507(0.319–1.772) 0.043 0.986(0.580–2.805) 0.094
Dyslipidemia
No 1 – 1 –
Yes 1.959(1.557–2.651) 0.023 1.831(1.375–2.842) 0.064
Hypertension
No 1 – 1 –
Yes 1.914(1.085–3.375) 0.025 1.187(0.622–2.264) 0.060
Diabetes Mellitus
No 1 – 1 –
Yes 1.970(1.103–3.518) 0.022 3.679(1.634–8.283) 0.002
IL1B 1.945(1.829–2.077) 0.009 1.896(1.435–2.845) 0.017
ICAM1 1.328(1.218–1.493) 0.087 1.134(1.010–2.758) 0.126
JUN 1.480(1.362–1.638) 0.059 1.528(1.270–5.652) 0.083
CCL2 1.945(0.830–2.088) 0.009 1.172(0.563–2.440) 0.032
Received: 23 November 2018 Accepted: 26 March 2019
References
1. Smith SC Jr, Jackson R, Pearson TA, Fuster V, Yusuf S, Faergeman O, Wood DA, Alderman M, Horgan J, Home P, et al. Principles for national and regional guidelines on cardiovascular disease prevention: a scientific statement from the world heart and stroke forum. Circulation. 2004;109: 3112–21.
2. Wang F, Xu CQ, He Q, Cai JP, Li XC, Wang D, Xiong X, Liao YH, Zeng QT, Yang YZ, et al. Genome-wide association identifies a susceptibility locus for coronary artery disease in the Chinese Han population. Nat Genet. 2011;43: 345–9.
3. Consortium CAD, Deloukas P, Kanoni S, Willenborg C, Farrall M, Assimes TL, Thompson JR, Ingelsson E, Saleheen D, Erdmann J, et al. Large-scale association analysis identifies new risk loci for coronary artery disease. Nat Genet. 2013;45:25–33.
4. Souiden Y, Mallouli H, Meskhi S, Chaabouni Y, Rebai A, Cheour F, Mahdouani K. MnSOD and GPx1 polymorphism relationship with coronary heart disease risk and severity. Biol Res. 2016;49:22.
5. Yamada Y, Matsui K, Takeuchi I, Fujimaki T. Association of genetic variants with coronary artery disease and ischemic stroke in a longitudinal population-based genetic epidemiological study. Biomed Rep. 2015;3:413–9. 6. Ding H, Xu Y, Wang X, Wang Q, Zhang L, Tu Y, Yan J, Wang W, Hui R, Wang
CY, Wang DW. 9p21 is a shared susceptibility locus strongly for coronary artery disease and weakly for ischemic stroke in Chinese Han population. Circ Cardiovasc Genet. 2009;2:338–46.
7. Banerjee A, Lim CC, Silver LE, Welch SJ, Banning AP, Rothwell PM. Familial history of stroke is associated with acute coronary syndromes in women. Circ Cardiovasc Genet. 2011;4:9–15.
8. Sinnaeve PR, Donahue MP, Grass P, Seo D, Vonderscher J, Chibout SD, Kraus WE, Sketch M Jr, Nelson C, Ginsburg GS, et al. Gene expression patterns in peripheral blood correlate with the extent of coronary artery disease. PLoS One. 2009;4:e7037.
9. Ein-Dor L, Kela I, Getz G, Givol D, Domany E. Outcome signature genes in breast cancer: is there a unique set? Bioinformatics. 2005;21:171–8. 10. Ntzani EE, Ioannidis JP. Predictive ability of DNA microarrays for cancer
outcomes and correlates: an empirical assessment. Lancet. 2003;362: 1439–44.
11. Barrett T, Wilhite SE, Ledoux P, Evangelista C, Kim IF, Tomashevsky M, Marshall KA, Phillippy KH, Sherman PM, Holko M, et al. NCBI GEO: archive for functional genomics data sets--update. Nucleic Acids Res. 2013;41:D991–5. 12. Gautier L, Cope L, Bolstad BM, Irizarry RA. Affy--analysis of Affymetrix
GeneChip data at the probe level. Bioinformatics. 2004;20:307–15. 13. Gentleman RC, Carey VJ, Bates DM, Bolstad B, Dettling M, Dudoit S, Ellis B,
Gautier L, Ge Y, Gentry J, et al. Bioconductor: open software development for computational biology and bioinformatics. Genome Biol. 2004;5:R80. 14. Smyth GK, Gentleman RCV, Dudoit S, Irizarry R, Huber W. Limma: linear
models for microarray data. New Yotk, NY: Bioinformatics and
computational biology solutions using R and bioconductor. Springer; 2005. p. 397–420.
15. Hulsegge I, Kommadath A, Smits MA. Globaltest and GOEAST: two different approaches for Gene Ontology analysis. BMC Proc. 2009;3(Suppl 4):S10. 16. Kanehisa M, Goto S. KEGG: Kyoto encyclopedia of genes and genomes.
Nucleic Acids Res. 2000;28:27–30.
17. da Huang W, Sherman BT, Lempicki RA. Systematic and integrative analysis of large gene lists using DAVID bioinformatics resources. Nat Protoc. 2009;4: 44–57.
18. Walter W, Sanchez-Cabo F, Ricote M. GOplot: an R package for visually combining expression data with functional analysis. Bioinformatics. 2015;31: 2912–4.
19. Szklarczyk D, Franceschini A, Wyder S, Forslund K, Heller D, Huerta-Cepas J, Simonovic M, Roth A, Santos A, Tsafou KP, et al. STRING v10: protein-protein interaction networks, integrated over the tree of life. Nucleic Acids Res. 2015;43:D447–52.
20. Shannon P, Markiel A, Ozier O, Baliga NS, Wang JT, Ramage D, Amin N, Schwikowski B, Ideker T. Cytoscape: a software environment for integrated models of biomolecular interaction networks. Genome Res. 2003;13:2498–504.
21. Jeong H, Mason SP, Barabasi AL, Oltvai ZN. Lethality and centrality in protein networks. Nature. 2001;411:41–2.
22. Csardi GNT. The igraph software package for complex network research. InterJournal. Complex Systems. 2006;1695:1–9.
23. Bader GD, Hogue CW. An automated method for finding molecular complexes in large protein interaction networks. BMC Bioinformatics. 2003;4:2.
24. Wu DF, Yin RX, Cao XL, Chen WX, Aung LH, Wang W, Huang KK, Huang P, Zeng XN, Wu J. Scavenger receptor class B type 1 gene rs5888 single nucleotide polymorphism and the risk of coronary artery disease and ischemic stroke: a case-control study. Int J Med Sci. 2013;10:1771–7. 25. Wu DF, Yin RX, Cao XL, Chen WX. Association between single nucleotide
polymorphism rs1044925 and the risk of coronary artery disease and ischemic stroke. Int J Mol Sci. 2014;15:3546–59.
26. Pasternak RC, Criqui MH, Benjamin EJ, Fowkes FG, Isselbacher EM, McCullough PA, Wolf PA, Zheng ZJ, American HA. Atherosclerotic vascular disease conference: writing group I: epidemiology. Circulation. 2004;109: 2605–12.
27. Libby P, Okamoto Y, Rocha VZ, Folco E. Inflammation in atherosclerosis: transition from theory to practice. Circ J. 2010;74:213–20.
28. Libby P, Warner SJ, Friedman GB. Interleukin 1: a mitogen for human vascular smooth muscle cells that induces the release of growth-inhibitory prostanoids. J Clin Invest. 1988;81:487–98.
29. di Giovine FS, Duff GW. Interleukin 1: the first interleukin. Immunol Today. 1990;11:13–20.
30. Cozzolino F, Torcia M, Aldinucci D, Ziche M, Almerigogna F, Bani D, Stern DM. Interleukin 1 is an autocrine regulator of human endothelial cell growth. Proc Natl Acad Sci U S A. 1990;87:6487–91.
31. Grames M, Breviario F, Pintucci G, Millet I, Dejana E, van Damme J, Donati MB, Mussoni L. Enhancement by interleukin-1 (IL-1) of plasminogen activator inhibitor (PA-I) activity in cultured human endothelial cells. Biochem Biophys Res Commun. 1986;139:720–7.
32. Offner FA, Feichtinger H, Stadlmann S, Obrist P, Marth C, Klingler P, Grage B, Schmahl M, Knabbe C. Transforming growth factor-beta synthesis by human peritoneal mesothelial cells. Induction by interleukin-1. Am J Pathol. 1996;148:1679–88.
33. Bochner BS, Luscinskas FW, Gimbrone MA Jr, Newman W, Sterbinsky SA, Derse-Anthony CP, Klunk D, Schleimer RP. Adhesion of human basophils, eosinophils, and neutrophils to interleukin 1-activated human vascular endothelial cells: contributions of endothelial cell adhesion molecules. J Exp Med. 1991;173:1553–7.
34. Ciccone MM, Cortese F, Gesualdo M, Riccardi R, Di Nunzio D, Moncelli M, Iacoviello M, Scicchitano P. A novel cardiac bio-marker: ST2: a review. Molecules. 2013;18:15314–28.
35. Marzullo A, Ambrosi F, Inchingolo M, Manca F, Devito F, Angiletta D, Zito A, Scicchitano P, Ciccone MM. ST2L transmembrane receptor expression: an immunochemical study on endarterectomy samples. PLoS One. 2016;11: e0156315.
36. Parissis JT, Adamopoulos S, Venetsanou KF, Mentzikof DG, Karas SM, Kremastinos DT. Serum profiles of C-C chemokines in acute myocardial infarction: possible implication in postinfarction left ventricular remodeling. J Interf Cytokine Res. 2002;22:223–9.
37. Gawaz M, Neumann FJ, Dickfeld T, Koch W, Laugwitz KL, Adelsberger H, Langenbrink K, Page S, Neumeier D, Schomig A, Brand K. Activated platelets induce monocyte chemotactic protein-1 secretion and surface expression of intercellular adhesion molecule-1 on endothelial cells. Circulation. 1998;98: 1164–71.
38. Prosser HC, Ng MK, Bursill CA. The role of cholesterol efflux in mechanisms of endothelial protection by HDL. Curr Opin Lipidol. 2012;23:182–9. 39. de Lemos JA, Morrow DA, Sabatine MS, Murphy SA, Gibson CM, Antman
EM, McCabe CH, Cannon CP, Braunwald E. Association between plasma levels of monocyte chemoattractant protein-1 and long-term clinical outcomes in patients with acute coronary syndromes. Circulation. 2003;107: 690–5.
40. de Lemos JA, Morrow DA, Blazing MA, Jarolim P, Wiviott SD, Sabatine MS, Califf RM, Braunwald E. Serial measurement of monocyte chemoattractant protein-1 after acute coronary syndromes: results from the a to Z trial. J Am Coll Cardiol. 2007;50:2117–24.
42. Shanmugam G, Narasimhan M, Sakthivel R, Kumar RR, Davidson C, Palaniappan S, Claycomb WW, Hoidal JR, Darley-Usmar VM, Rajasekaran NS. A biphasic effect of TNF-alpha in regulation of the Keap1/Nrf2 pathway in cardiomyocytes. Redox Biol. 2016;9:77–89.
43. Tuenter A, Selwaness M, Arias Lorza A, Schuurbiers JCH, Speelman L, Cibis M, van der Lugt A, de Bruijne M, van der Steen AFW, Franco OH, et al. High shear stress relates to intraplaque haemorrhage in asymptomatic carotid plaques. Atherosclerosis. 2016;251:348–54.