M E T H O D O L O G Y
Open Access
On the use of data mining for estimating carbon
storage in the trees
Carlos Roberto Sanquetta
1†, Jaime Wojciechowski
2†, Ana Paula Dalla Corte
1*†, Aurélio Lourenço Rodrigues
3†and Greyce Charllyne Benedet Maas
3†Abstract
Forests contribute to climate change mitigation by storing carbon in tree biomass. The amount of carbon stored in this carbon pool is estimated by using either allometric equations or biomass expansion factors. Both of the methods provide estimate of the carbon stock based on the biometric parameters of a model tree. This study calls attention to the potential advantages of the data mining technique known as instance-based classification, which is not used currently for this purpose. The analysis of the data on the carbon storage in 30 trees of Brazilian pine (Araucaria angustifolia) shows that the instance-based classification provides as relevant estimates as the conventional methods do. The coefficient of correlation between the estimated and measured values of carbon storage in tree biomass does not vary significantly with the choice of the method. The use of some other measures of method performance leads to the same result. In contrast to the convention methods the instance-based classification does not presume any specific form of the function relating carbon storage to the biometric parameters of the tree. Since the best form of such function is difficult to find, the instance-based classification could outperform the conventional methods in some cases, or simply get rid of the questions about the choice of the allometric equations.
Keywords:Biomass, Biomass expansion factor, Euclidean distance, Regression equations, Root-to-shoot ratio
Background
Forests play an important role in the global carbon bal-ance, fixing carbon from the atmosphere, but can also become a source of emissions [1-3]. Therefore, their function is critical to global efforts to combat climate change. Quantifying carbon storage in forest ecosystems and the resulting changes stemming from human activ-ities is a first step to better represent forests in climate policy at regional, national and global scales [4].
The estimates of biomass and carbon in forests can be made by direct and indirect methods [5-9]. Direct methods consist of weighing all biomass, which is typic-ally a destructive process. This approach is not feasible for large-scale applications, due to time and implemen-tation cost constraints. Meanwhile traditional indirect methods imply the use of some type of biomass and
carbon modeling, using expansion factors and/or regres-sion equations. However, such factors or equations need to be fitted using primary empirical data.
Regression equations whose dependent variable is in-dividual tree carbon (C) and whose independent vari-ables are tree measurement parameters, are often called allometric equations [10]. In most instances they are ap-propriate because they offer direct estimates of C as functions of tree measurements, which are easy to meas-ure and apply. However, they are not always satisfactory in terms of accuracy, and result in error levels beyond tolerance thresholds in forestry measurements.
The other traditional method consists of fitting bole volume (V) equations, which is commonly estimated in conventional forest inventories and usually obtained with high precision and accuracy, combined with factors that extrapolate the bole mass to estimate the entire aboveground as well as below ground biomass. These factors are called the Biomass Expansion Factor (BEF) and the Root-to-Shoot Ratio(R)[11].
* Correspondence:[email protected] †Equal contributors
1
Department of Forest Science, Federal University of Paraná, Rua Simão Brante, 103, sob. 5, Uberaba, Curitiba, Paraná 81.570-340, Brazil Full list of author information is available at the end of the article
According to Soares & Tomé [10], allometric equa-tions are recommended when estimating forest carbon, but if not available we can make use of expansion factors specific to different ages of forest stands. The limitations of biomass expansion factors are discussed by the authors.
Data mining aims to discover useful information in a data set [12]. This technique, used in learning algorithms whose metrics can be found in [13] and Bradzil et al. [14], is now widespread in many areas and applications. However, its potential has not been exploited to estimate carbon stocks in forests. We decided to evaluate this technique because it allows one to better explore the na-ture of the numerical data, is simpler and more flexible than classical regression modeling because it did not re-quire testing preconceived mathematical formulae, and also because it may yield estimates of individual tree car-bon as accurate as those obtained from classical allometry.
This study aims to evaluate the technique of data min-ing against the two most common procedures for esti-mating carbon in forests. The species A. angustifolia, Brazil’s most important native conifer, was used as a case study.
Results and discussion
Descriptive statistics and correlation matrix
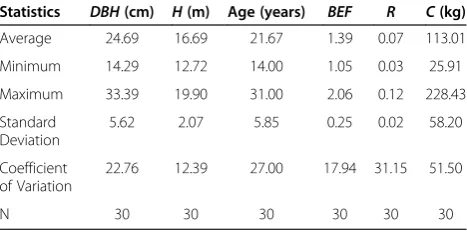
Table 1 shows the descriptive statistics of the data used in this study. For trees aged 14 to 31 years, their diame-ters ranged from 14.29 to 33.39 cm and their height ranged from 12.72 to 19.90 m. The carbon stock of indi-viduals ranged from 25.91 to 228.43 kg. TheBEFranged from 1.05 to 2.06, indicating some trees have low canopy biomass while others have much more since this fraction is larger than that of the bole itself. R in turn ranged from 0.03 to 0.12, indicating that the expression of underground biomass also varies among individuals.
Silveira [15] points out that studies on the use of BEF to estimate forest carbon are scarce in Brazil. The author has worked with a wide range of native species in dense rain forest in the state of Santa Catarina, Brazil.
Watzlawick [16], Sanquetta et al. [17] and Schumacher
et al. [18] studied A. angustifolia biomass and carbon
storage without evaluating BEF and R.In inferring bio-mass values presented by the authors, mean BEFand R values were 1.34 and 0.18 for stands aged 24–32 years in the the municipality of General Carneiro, Brazil [16]. Mean BEF and R values of 1.32 and 0.15, respectively, were found for a 27-year-old stand that had been clearcut in the Quedas do Iguaçu municipality [18] and 1.39 for BEF in General Carneiro, in forest plantations with ages ranging from 14 to 32 years [17]. In Pinus stands in the state ofParaná, Sanquettaet al.[11] found averageRand BEF values of 1.43 and 0.17, respectively, ranging from 0.05 to 0.63 for R and from 1.09 to 3.74 for BEF. Studies investigating biomass proportions in other species include that of Schneider and Finger [19]
in Acacia mearnsii and Miranda et al. [20] in Euterpe
oleracea.
The correlation matrix between variables (Table 2) showed that the total individual carbon stock (C) is more strongly correlated to DBH, and then to tree height and age. These correlations were positive and sta-tistically significant (p<0.05). This means that the larger and older the tree, the greater its carbon stock, which is to be expected. The correlation between Cand BEFwas negative but the correlation betweenCandRwas positive, though neither were statistically significant (p<0.05). This means that carbon stocks of the individual were not af-fected by the canopy proportions (branches + foliage) nor underground biomass (roots) in this case.BEFand Rdid not share significant correlations.BEFwas negatively cor-related with age and R, and positively correlated with DBH. That is, with increasing age the proportion of can-opy biomass tends to decrease, and as the tree grows with respect to DBH, so does the relative proportion of the roots. The data presented by Watzlawick [16] suggest similar behavior. Results forPinus taedainParaná show a reduction in BEFand Rwith age and with DBH [11]. This possibly results from the fact that the minimum age considered in this study was 14 years.
Ratuchne [21] studied several species in Araucaria For-est and found correlation coefficients of total individual biomass with tree measurement variables similar to this
Table 1 Descriptive statistics for the variables analyzed forA. angustifolia
Statistics DBH(cm) H(m) Age (years) BEF R C(kg)
Average 24.69 16.69 21.67 1.39 0.07 113.01
Minimum 14.29 12.72 14.00 1.05 0.03 25.91
Maximum 33.39 19.90 31.00 2.06 0.12 228.43
Standard Deviation
5.62 2.07 5.85 0.25 0.02 58.20
Coefficient of Variation
22.76 12.39 27.00 17.94 31.15 51.50
N 30 30 30 30 30 30
Table 2 Simple correlation matrix for the variablesDBH,
H, Age,BEF,RandCforA. angustifolia
Variable DBH H Age BEF R C
DBH 1
H 0.86 1
Age 0.57 0.63 1
BEF −0.36 −0.45 −0.67 1
R 0.73 0.55 0.38 −0.44 1
study, but lower than those presented here. The reason is that the author analyzed a wide range of species.
Regression equations
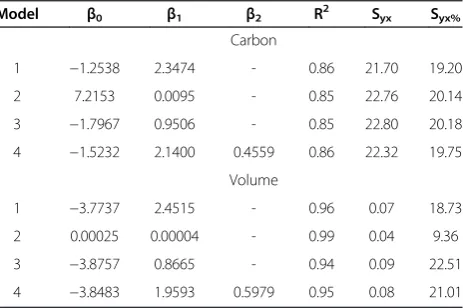
The fitted carbon equations yielded coefficients of deter-mination of between 0.85 and 0.86, and standard errors of the estimate near 20%. Among the models we tested the one resulting in the best fit was equation 1, though all four were satisfactory (Table 3). Schumacher et al. [18] obtained higher R2values and lower Syx% values in modeling the total biomass ofA. angustifoliaindividuals. This is likely due to the fact that the authors used data from a homogeneously aged stand, e.g. 27 years. Sanquetta et al. [17] found satisfactory fits for the bio-mass in the bole as a function ofDBH and H, with low standard errors of the estimate and high coefficients of determination, though unsatisfactory in making partial biomass estimates in each of the compartments.
The volume equations yielded coefficients of deter-mination from 0.94 to 0.99, with standard errors of the estimate ranging from 9 to 22%. The model with the highest R2 and lowest Syx% was Equation 2 (Table 3). The best performing residuals of carbon and volume models are shown in Figures 1 and 2. Several authors have conducted studies on fitting volume equations for the species we studied, such as De Oliveira et al. [22], De Mattos et al. [23], Schneider & Finger [19], among others. In most cases fits are satisfactory and comparable to this study, primarily due to the regular shape of the bole of the species.
Data mining
The three data mining methods analyzed in this study yielded similar results, with standard errors (Syx%) of 24.85% for the first procedure (one nearest neighbor), 24.10% for the 2nd procedure (inverse Euclidean dis-tance weighted with 3 neighbors) and 24.32% for the 3rd procedure (inverse of the squared Euclidean distance
weighted with 3 neighbors). All the R2values were also similar, near 0.85. This suggests that any of the methods can be used satisfactorily. A graphical analysis of resid-uals revealed that there were no trends nor atypical dis-persion in the residuals in any of the three methods (Figure 3).
Comparative analyses
When the carbon stock estimates for individuals of the species were analyzed by using the best regression equa-tion (Ĉ1) and the respective real values of this variable,
we found that the average difference was −1.22%, i.e., the average real value was 113.01 and the average esti-mated value was 111.63 kg (p = 0.7248). When compar-ing the estimates with Eq. 3 (Ĉ2), which were based on
combining the estimated volume (in this case the second model was used as it performed better) and the expan-sion factors(BEFandR)and the respective real values of C, an average difference of 5.28% was found, with aver-age estimated value of 118.98 kg (p= 0.0859). Compar-ing the alternative method of data minCompar-ing (Ĉ3) resulted
in a difference of 1.20%, with an estimated value of the variable of interest of 114.37 kg (p= 0.7556).
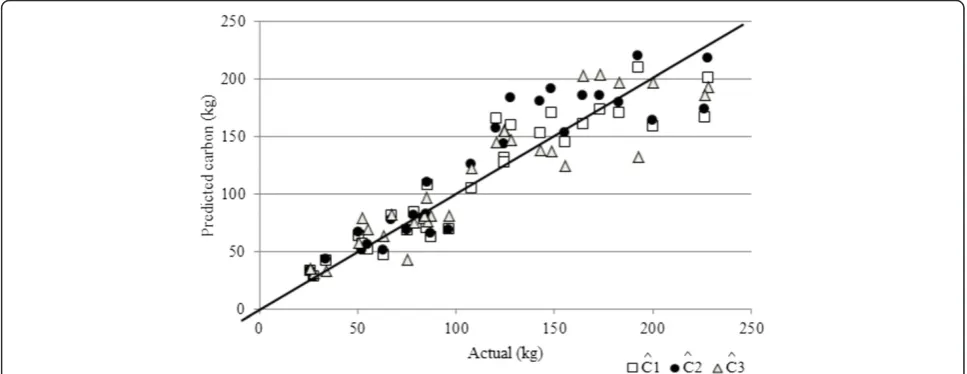
These differences, when analyzed by paired t test (p <0.05) were considered not significant, i.e., both esti-mates (Ĉ1, Ĉ2andĈ3) were not statistically different from
the actual value ofC. Figure 4 illustrates the ratio of the actual values ofCand its estimates by traditional methods (regression of the carbon equation and the volume equa-tion combined with volume expansion factors) and the al-ternative method (data mining). The simple Pearson correlation’s coefficients of actual C and the three esti-mates were 0.9308; 0.9232, and 0.91455, respectively for Ĉ1,Ĉ2, forĈ3.
Obtaining the forest carbon stock is not feasible using direct methods. Therefore it is important to consider the relationships between tree dimensions that are easily obtained, such as diameter, height and age. There are several ways to estimate the carbon stocks in trees. The most traditional uses allometric equations and the applicatin of expansion factors [10]. According to the au-thors, using allometric equations to estimate biomass is preferable, but when unavailable, expansion factors for dif-ferent ages can be used. Sanquettaet al.[3] found a clear dependent relationship between bothBEFandRand age, revealing negative curvilinear trends forPinusin the state of Paraná. Similar results were obtained forBEFby Soares & Tomé [10] inEucalyptus globulus,although its meaning is somewhat different (total aerial biomass divided by the volume of the bole).
Due to their simplicity and immediate application, bothBEFand Rhave been employed alternatively to es-timate biomass and hence carbon. They represent a sim-ple way to extrapolate from the carbon in the bole,
Table 3 Statistical values of the fitted equations of total carbon forA. angustifolia
Model β0 β1 β2 R2 S
yx Syx%
Carbon
1 −1.2538 2.3474 - 0.86 21.70 19.20
2 7.2153 0.0095 - 0.85 22.76 20.14
3 −1.7967 0.9506 - 0.85 22.80 20.18
4 −1.5232 2.1400 0.4559 0.86 22.32 19.75
Volume
1 −3.7737 2.4515 - 0.96 0.07 18.73
2 0.00025 0.00004 - 0.99 0.04 9.36
3 −3.8757 0.8665 - 0.94 0.09 22.51
which is generally more easily obtained and estimated by multiplying the volume by the density of the timber, to the living biomass of the entire tree. TypicallyBEFand Rare assumed to be constant, which is not always the case. The IPCC (Intergovernmental Panel on Climate Change) itself publishes tables with default medium(default)for various forests of the world IPCC - Intergovernmental Panel on Climate Change [24], since research onBEFandRis lack-ing for most of the world's forests, especially in the tro-pics. The use of default values (average) could pose problems for estimates of biomass and carbon, but often the only values available, since in many cases allometric equations are not available.
In the present study the estimates by the two trad-itional methods closely approximated each other. This occurred because a clear dependent relationship between R and BEF and age could not be observed nor indeed between the tree measurement variables DBHand H, as opposed to the previously mentioned studies (Figure 4).
The arguments of Soares & Tomé [10] are relevant when considering tree stands of varying tree ages. How-ever it is important to note that the greatest variations in BEF and R occur at younger ages, due to the faster growth rates and the differences in allocation of biomass to different plant tissues as the plant matures. On the other hand, in intermediate and older stands that whose growth rates have stabilized and assume some archetypal form, BEFand Roften remain constant with advancing age (as seen in the aforementioned studies). In this case the supposed advantage of allometric equations does not manifest as in the case of our study, which showed no statistical difference between the two methods for esti-mating the carbon stock inA. angustifoliaindividuals.
It is important to note that estimates of volume are al-ways more accurate than estimates of carbon. Therefore, potential advantages of the methods may emerge from future discussion of this work. If the variable carbon does not depend on age and size of the trees(DBHand Figure 1Residual graphical analysis of the best performing carbon equation forA. angustifolia.
H),statistical gains are possible using the second carbon estimation method presented here, which is also rela-tively straightforward. The influence of the wood density variable in this context warrants further exploration.
An alternative method, which has rarely been explored in forest science, is data mining. The technique consists of an information management tool used to facilitate the access and organization of knowledge structures that as-sist decision-making. In practice it amounts to explora-tory data analysis and modeling. According to Cardoso and Machado [25], it represents one of the most effect-ive alternateffect-ives to extracting information from large vol-umes of data, revealing hidden relationships, patterns and generating rules to predict and correlate data that can help institutions make decisions faster and with a higher degree of certainty. The technique has been used
in the health sciences [26] and business Marcanoo Aular & Talavera Pereira [27] industries, among others, with some forestry applications such as the prediction of fires [28] and mapping forest cover [29]. This technique al-lows one to better explore the nature of the data, is more flexible than the classical regression modeling be-cause it requires testing preconceived mathematical for-mulations, and yields comparable and often more reliable estimates than classical allometry. Unfortunately there have been no studies applying the method to mod-eling forest carbon.
The results of this research indicate that the technique of data mining can be used to accurately estimate the carbon stock of A. angustifolia individuals. Its imple-mentation is simple and yields estimates as satisfactory as those obtained by traditional methods of modeling Figure 3Residual graphical analysis of three data mining methods for estimating carbon inA. angustifoliaindividuals.
Figure 4Predicted vs. actual values of carbon stock ofA. angustifoliaindividuals of the three methods tested (Ĉ1: regression equation;
carbon, such as equations fitted directly by linear regres-sion or volume equations combined with expanregres-sion factors.
The use of data mining is shown as an initiative of the forest area to search techniques in other areas of knowledge that contribute in estimates of interest among researchers and foster the idea of diversifying methods in order to find better results, leaving the known techniques traditional and commonly used. Be-yond data mining, other AI techniques have been studied with the same purpose. In Gorgens [30], Arti-ficial Neural Networks were used to estimate tree vol-ume and gave results compatible with traditional methods of fitting commonly used linear regression equations.
In other disciplines data mining has been used to clas-sify dangerous parts of Brazilian cities, where useful in-formation was found by employing decision trees for the attributes related to a particular characteristic such as infrastructure conditions, hydrology, soil, recreation area, community characteristics, among others. The goal of Malucelli et al. [31] was to classify parts of the city according to the degree of risk of residing in that area, indicating the potential for AI tools to be applied in any discipline including Forestry.
Conclusions
In contrast to the convention methods the instance-based classification does not presume any specific form of the function relating carbon storage to the biometric parameters of the tree. Since the best form of such func-tion is difficult to find, the instance-based classificafunc-tion could outperform the conventional methods in some cases, or simply get rid of the questions about the choice of the allometric equations.
Methods Field data
The data used in this study come from pure stands of Araucaria angustifoliaBert. O. Ktze. located in the mu-nicipalities of Foz do Iguaçu and General Carneiro, southern Paraná, Brazil. The forest stand of Iguaçu Falls is located between the geographical coordinates 25° 20’ 58” a 25° 34’ 55” South and 52° 36’ 24” e 53° 07’ 43” West, and was installed between 1987 and 1988. Mean-while the forest stand inGeneral Carneirois located be-tween the geographical coordinates 26° 20’35”a 26° 26’ 13” South and 51° 19’ 49” a 51° 25’ 29” West, and was installed between 1969 and 1987.
Thirty trees were used for this study and were felled and weighed directly. Wet weights of all biomass were determined in the field in separate compartments: bole without bark, bark, branches, foliage and roots. Data from DBH (diameter at breast height) and total height
(H) of trees were also collected. Samples of biomass of each compartment 300 to 500 g were collected for la-boratory analysis. Samples were collected between the years 2003 and 2004.
Laboratory analysis
The fresh biomass samples were removed from the field and oven-dried to constant weight at a temperature of 70°C. Based on the relationship between wet weight and dry weight, the dry weights of all compartments of the biomass collected in the field were calculated. The sam-ples were then chipped for analysis of carbon content (T) using the dry combustion method in an infrared chamber. Based on the carbon contents the carbon stocks in all compartments of the biomass were calcu-lated, which together resulted in the total carbon (C) stock of the individual tree, the primary variable of this research.
Expansion factors and wood density
From the field data Biomass Expansion Factors (BEF) and the Root Ratio(R)of trees were calculated using the following formulas IPCC - Intergovernmental Panel on Climate Change [32]:
BEF¼PcanopyþPbole
Pbole ¼
Paerial
Pbole ð1Þ
R¼ Proots
Paerial ð
2Þ
Where:
BEF= biomass expansion factor (dimensionless);
R= root ratio (dimensionless);
Pcanopy= dry weight of the tree canopy (kg); Pbole= dry weight of the tree bole (kg);
Paerial= dry weight of the tree bole + dry weight of the
tree canopy (kg).
Proots= dry weight of the tree roots (kg).
Conceptually, the BEF is a factor used to extrapolate the weight of the tree bole to the whole biomass, consid-ering the branches and foliage. It is usually used to cal-culate the entire aboveground biomass using only volume (usually estimated in conventional forest inven-tories) and the wood density. Meanwhile the Root Ratio (R) is a factor that expresses the ratio of the below ground biomass to the above ground biomass, and en-ables one to calculate the weight of the whole tree's biomass.
and volume was used to calculate individual carbon stock based on bole volume and expansion factors(BEF andR),as will be discussed below.
Descriptive statistics and correlation analysis
We calculated descriptive statistics for the variables: DBH, H, Age (I),BEF, R andCand analyzed their corre-lations using a simple correlation matrix.
Methods for estimating carbon stock of individuals
Three different methods were used to estimate carbon (C) stock of the individual. The first two methods are traditionally used to that end, while an alternative method has been applied in other fields but never before been used to estimate forest carbon:
1. Estimation of Carbon Stock of Individuals from Regression Equations
In this approachCwas estimated directly from a regression equation fitted to the field data,i.e. Cwas estimated directly as a function ofDBHandH(see Eqs.4,5,6and7).
Estimation of Carbon Stock of Individuals from Bole Volume and Expansion Factors
The carbon(C)stock estimates of individuals were calculated using the following mathematical expression, whereVwas estimated based on equations4,5,6and7:
C¼VDBEFð1þRÞ T ð3Þ
In both approaches the following regression models were tested:
logY ¼β0þβ1logDBH ð4Þ
Y ¼β0þβ1DBH2H ð5Þ
logY ¼β0þβ1logDBH2H ð6Þ
logY ¼β0þβ1logDBHþβ2logH ð7Þ
2. Where: Y = individual carbon stock(C)in method 1 or total bole volume(V)in method 2;DBH= diameter at breast height,H= total height;βi=
coefficients of the models.
One of the fitted equations was selected for compara-tive analyses. The following statistics were used as selec-tion criteria: adjusted coefficient of determinaselec-tion (R2), standard error of the absolute estimate (Syx) and per-centage (Syx%),as well as graphical analysis of residuals.
Data mining
In this study we used a data mining technique known as Instance-Based Classification, which uses its own data-base instances to make estimates of new cases. The tech-nique is based on the premise that certain instances, i.e. whose dimensions form vectors that approximate each other, tend to belong to the same class. This proximity can be measured as the distance between the vectors formed by the independent variables related to the ob-ject of study (in the case of this study, sampled trees with dimensionsDBH, HandI).
To calculate the distance between vectors, we used classical Euclidean Distance:
d pð ;qÞ ¼
ffiffiffiffiffiffiffiffiffiffiffiffiffiffiffiffiffiffiffiffiffiffiffiffiffi ∑N
i¼1ðpi−qiÞ 2
q
ð8Þ
Where:
piandqi= measures of any two data points
In this case the formula was applied to DBH, H and I of the sampled trees, namely:
d pð ;qÞ ¼
ffiffiffiffiffiffiffiffiffiffiffiffiffiffiffiffiffiffiffiffiffiffiffiffiffiffiffiffiffiffiffiffiffiffiffiffiffiffiffiffiffiffiffiffiffiffiffiffiffiffiffiffiffiffiffiffiffiffiffiffiffiffiffiffiffiffiffiffiffiffiffiffiffiffiffiffiffiffiffiffiffiffiffi DBHp−DBHq
2
þ Hp−Hq
2
þ Ip−Iq
2
q
ð9Þ
Where:
DBHp= diameter of a tree bolep DBHq= diameter of a tree boleq Hp= total height of treep Hq= total height of treeq Ip= age of treep
Iq= age of treeq
The method uses a technique known as cross
valid-ationwhere each instance is compared to the others in
the sample and the closest (shortest distance) instance is selected from among the rest. In this case the estimated carbon (C)of the individual for a given instance will be that value which is least distant.
considered legitimate data values and would lie beyond the normal range, causing errors in the estimate. To minimize the vulnerability of relying on information from instances with these characteristics, a variation in the Instance-Based Classification technique was used. Thus, one can use one nearest neighbor (more susceptible to noise) or create a weighted measure using 3 (or more) nearest neighbors in order to dilute the error. In this case, we use the information from three (or more) nearest neighbors, but favor the closest since it is weighted by the inverse of the distance. This method was recommended in the study by Bradzil et al. [14], in which estimates using between one and five nearest neighbors were made.
The three variations of the method used in this study were:
nearest neighbor:
in this case,Cwas estimated for the tree nearest the one in question;
three nearest neighbors with inverse distance weighting (1/d):
in this case, dimensionsDBHandHof the three trees closest to the one in question were used to calculate the inverse Euclidean distance between them as weights in estimatingC;
three nearest neighbors with inverse distance squared (1/d2) weighting:
analogous method to the previous, weighted by the inverse of the squared Euclidean distance.
Comparative analyses
To compare the three approaches to estimating the car-bon stock of individuals, a paired t test (α = 0.05) was used, comparing the actual value ofCwith its estimates Ĉ1
(regression) Ĉ2(Volume combined with BEFand R) andĈ3(data mining).
Competing interests
The authors declare that they have no competing interests. The views expressed in this publication are those of the authors.
Authors’contributions
CRS, J Wojciechowski, A P D Corte, A L Rodrigues, G C B Maas conceived, drafted the manuscript and developed the methodological approaches. All authors read and approved the final manuscript.
Acknowledgements
We would like to thank Conselho Nacional de Desenvolvimento Científico e Tecnológico (CNPq) of Brazil for financial support.
Author details 1
Department of Forest Science, Federal University of Paraná, Rua Simão Brante, 103, sob. 5, Uberaba, Curitiba, Paraná 81.570-340, Brazil.2Sector of
Professional and Technological Education, Federal University of Paraná, Curitiba, PR, Brazil.3Graduate Programme in Forestry, Federal University of
Paraná, Curitiba, PR, Brazil.
Received: 15 February 2013 Accepted: 1 June 2013 Published: 10 June 2013
References
1. Houghton RA:Aboveground forest biomass and the global carbon balance.Glob Chang Biol2005,11:945–958.
2. Broadmeadow M, Matthews R:Forests, carbon and climate change: the UK contribution, Forestry Commission. Information Note, Volume 12; 2003. 3. Sanquetta CR, Corte APD, Maas GCB:The role of forests in climate change.
Quebracho2011,19(2):84–96.
4. Watson C:Forest carbon accounting: overview and principles.UNEP: UNDP; 2009:39.
5. Brown S, Gillespie AJR, Lugo AE:Biomass estimation methods for tropical forests with applications to forest inventory data.Forest Sci 1989,35:881–902.
6. Wharton EH, Griffith DM:Methods to estimate total forest biomass for extensive inventories. Inapplications in the northeastern U.S.U.S: USDA Forest Service Research Paper NE-681; 1993:161.
7. Etienne M:Non-destructive methods for evaluating shrub biomass: a review.Acta Oecologica1989,10:115–128.
8. Sanquetta CR:Metodologias para determinação de biomassa florestal. In Gomes f dos s asflorestas e o carbono.Edited by Sanquetta CR, Watzlawick LF, Balbinot R, Ziliotto MAB. Curitiba: UFPR; 2002:264.
9. Cerrillo RMN, Oyonarte PB:Estimation of above-ground biomass in shrubland ecosystems of southern Spain.Invest Agrar: Sist Recur For2006, 15:197–207.
10. Soares P, Tomé M:Analysis of the effectiveness of biomass expansion factors to estimate stand biomass. InModeling forest production. proc. conf. vienna, 19–21 april (department of forest and soil sciences.Edited by Hasenauer H, Makela A. Vienna: BOKU University of Natural Resources and Applied Life Sciences; 2004:368–374.
11. Sanquetta CR, Corte APD, Silva F:Biomass expansion factor and root-to-shoot ratio forPinusin Brazil.Carbon Balance and Management2011,6(6):1–8. 12. Tan P-N, Steinbach M, Kumar V:Introduction to data mining.Winter:
Stanford University; 2009:108.
13. Albert MK, Kibler D, Aha DW:Instance-based learning algorithms, Machine learning, Volume 6. University of California: Kluver Academic Publishers; 1991:37–66.
14. Bradzil P, Soares CC, Joaquim P:Ranking learning algorithms: using IBL and a meta-learning on accuracy and time results. kluver academic publishers. university of Porto.Mach Learn2003,50:251–277. 15. Silveira P:Estimativa da biomassa e carbono acima do solo em um
fragmento de floresta ombrófila densa utilizando o método da derivação do volume comercial.Floresta2010,40(4):789–800. 16. Watzlawick LF:Tese (doutorado em engenharia florestal).Curitiba, PR:
Universidade Federal do Paraná; 2003:120. Estimativa de biomassa e carbono em Floresta Ombrófila Mista e plantações florestais a partir de dados de imagens do satélite IKONOS II.
17. Sanquetta CR, Watzlawick LF, Schumacher MV, Mello AA:Relações individuais de biomassa e conteúdo de carbono em plantações de Araucaria angustifoliaePinus taedano sul do estado do Paraná Brasil. Acadêmica.Ciências Agrárias e Ambientais2003,1(3):33–40.
18. Schumacher MV, Finger CAG, Sobrinho VG, Schneider PSP:Produção de biomassa no corte raso em plantio deAraucaria angustifolia(Bertol.) Kuntze de 27 anos de idade em Quedas do Iguaçu, PR.Ciência Florestal 2011,21(1):53–62.
19. Schneider PR, Finger CAG:Manejo sustentado de florestas inequiâneas heterogêneas. Santa Maria, RS: UFSM, Departamento de Ciências Florestais; 2000:195. 20. Miranda DLC, Sanquetta CR, Costa LGS, Corte APD:Biomassa e carbono
emEuterpe oleraceaMart., na Ilha do Marajó–PA.Floresta e Ambiente 2012,19(3):336–343.
21. Ratuchne LC:Dissertação (mestrado em agronomia).Guarapuava, PR: Universidade Estadual do Centro-Oeste; 2010:111. Equações alométricas para estimativa de biomassa, carbono e nutrientes em uma Floresta Ombrófila Mista.
22. De Oliveira MF, De Mattos PP, Braz EM, Rosot MAD, Rosot NC, Santos WC: Equação de volume para um plantio deAraucaria angustifoliaem Rio Negro. InPR. Comunicado Técnico, Volume 275. Colombo: EMBRAPA; 2011:4. 23. De Mattos PP, De Bortoli C, Marchesan R, Rosot NC: InCaracterização física,
química e anatômica da madeira de Araucaria angustifolia (Bert.), Comunicado Técnico, Volume 160. Edited by O. Kuntze. Colombo: Embrapa; 2006:4. 24. IPCC - Intergovernmental Panel on Climate Change:Emissions factor
25. Cardoso ONP, Machado RTM:Gestão do conhecimento usando data mining: estudo de caso na Universidade Federal de Lavras, Volume 42. Rio de Janeiro: Revista Administração Pública; 2008:3.
26. Galvão ND, Marin HF:Técnica de mineração de dados: uma revisão da literatura.Acta Paulista de Enfermagem2009,22:686–690.
27. Marcanoo Aular YJ, Talavera Pereira R:Minería de datos como soporte a la toma de decisiones empresariales.Opcion2007,23(52):104–108. 28. Cortez P, Morais A:A Data Mining Approach to Predict Forest Fires using
Meteorological Data. InNew Trends in Artificial Intelligence, Proceedings of the 13th EPIA 2007 - Portuguese Conference on Artificial Intelligence Decembe.Edited by Neves J, Santos MF, Machado J. Guimarães, Portugal; 2007:512–523. 29. Mithal VA, Garg S, Boriah M, Steinbach V, Kumar C, Potter SK, Castilla-Rubio
JC:Monitoring global forest cover using data mining.ACM Transactions on Intelligent Systems and Technology2011,2:24–36.
30. Gorgens E:Estimação do volume de árvores utilizando redes neurais artificiais, Dissertação, Volume 94. Viçosa: Universidade Federal de Viçosa; 2006. 31. Malucelli A, Stein AVJ, Bastos L, Carvalho D, Cubas MR, Paraíso EC:
Classificação de Microáreas de risco com uso de Mineração de Dados.
Revista Saúde Pública, Pontifícia Universidade Católica do Paraná–PUCPR 2010,44(2):292–300.
32. IPCC - Intergovernmental Panel on Climate Change:Guidelines for national greenhouse gas inventories, Good Practice Guidance; 2006. www.ipcc.ch/. Acesso em: 11.01.2013.
33. Aha DW, Kibler D, Albert MK:Instance-Based Learning Algorithms, Machine Learning, Volume 6. Irvine, CA: Kluver Academic Publishers, Department of Information and Computer Science, University of California; 1991:37–66.
doi:10.1186/1750-0680-8-6
Cite this article as:Sanquettaet al.:On the use of data mining for estimating carbon storage in the trees.Carbon Balance and Management 20138:6.
Submit your next manuscript to BioMed Central and take full advantage of:
• Convenient online submission
• Thorough peer review
• No space constraints or color figure charges
• Immediate publication on acceptance
• Inclusion in PubMed, CAS, Scopus and Google Scholar
• Research which is freely available for redistribution