R E S E A R C H A R T I C L E
Open Access
Effects of mycophenolate mofetil on kidney
function and phosphorylation status of renal
proteins in Alport COL4A3-deficient mice
Darinka Todorova Petrova
1*, Frank Christian Schultze
2, Gunnar Brandhorst
3, Klaus-Dieter Luchs
4, Christof Lenz
3,5,
Henning Urlaub
3,5, Diana Rubel
6, Oliver Gross
6, Philip D Walson
4and Michael Oellerich
4Abstract
Background:We investigated the effects of mycophenolate mofetil (MMF) on kidney function and on protein phosphorylation in a mouse model for the human Alport syndrome.
Methods:COL4A3-deficient (COL4A3−/−) mice were randomly allocated to receive a placebo (PLC COL4A3−/−) or MMF treatment (MMF COL4A3−/−). Wild type mice (WT) were used as controls. Changes in serum creatinine, total protein and blood urea nitrogen (BUN), concentrations of mycophenolic acid (MPA) and its glucuronide metabolite (MPAG), serum protein electrophoresis, urine dipstick chemistry and sediment were measured. Changes in the phosphorylation status of renal proteins and histology were analyzed.
Results:MMF influenced kidney function and protein phosphorylation. Serum creatinine and BUN were lower in MMF treated compared to PLC treated COL4A3−/−mice. Serum albumin and alpha-1 globulins were significantly decreased while serum creatinine, alpha-2 globulins, urine dipstick protein, leukocyte esterase, hemoglobin and red blood cells were all increased in both COL4A3−/−groups compared to WT. Differential 2DE-gel analysis identified six phosphorylated kidney protein spots that were significantly altered by MMF.
Conclusions:These data suggest that the MMF treatment in this murine model moderately improved kidney function and reversed the phosphorylation status of six renal phosphoprotein spots to that seen in WT mice.
Keywords:Mycophenolic acid, Kidney fibrosis, Protein phosphorylation, Alport syndrome
Introduction
Mycophenolic acid (MPA) is the active metabolite of the pro-drug mycophenolate mofetil (MMF). It effectively and non-competitively inhibits inosine monophosphate dehydrogenase (IMPDH, EC 1.1.1.205). Human IMPDH is present in two isoforms: type I (expressed in nearly all cells) and type II (expressed in activated lymphocytes). IMPDH type II is about 5-fold more sensitive to MPA compared to IMPDH type I [1-3]. MPA inhibits the proliferation of T- and B-lymphocytes through the de-pletion of the nucleotides guanosine and deoxyguanosine thereby suppressing purine synthesis. It also inhibits the
production of immunoglobulins [4]. MMF is one of the most commonly used immunosuppressive drugs either alone or in combination with other immunosuppressive drugs (e.g. corticosteroids and/or calcineurin inhibitors) for the prevention of organ rejection after solid organ transplantation as well as in the therapy of autoimmune and neoplastic diseases [3,5-8]. It is known that MPA, through a nonspecific mechanism of action, can also influence non-lymphatic cells such as fibroblasts [3,9-14]. It has been proposed that MPA also has a positive effect on the progression of human kidney fibrosis [15-17] based on numerous in vivo [9,17-22] and in vitro studies [10,12,17,23]. However, the mechanisms responsible for the effects of MMF on renal fibrosis, especially changes in the phosphoproteome, have not been adequately studied. The aim of the current study was to examine the effects of MMF treatment on kidney function * Correspondence:darinka.petrova@med.uni-goettingen.de
1Department of Clinical Pharmacology, Institute of Clinical Chemistry,
University Medical Center Goettingen, Robert-Koch-Str. 40, 37099 Goettingen, Germany
Full list of author information is available at the end of the article
and on the phosphorylation status of renal proteins in COL4A3-deficient (COL4A3−/−) mice, which represent an in vivo, non-hypertensive model for the autosomal form of Alport syndrome.
Results
During the study period no severe MMF-related toxicity such as diarrhea was observed. However, animals were excluded from the study that became somnolent, exhib-ited a decrease in body weight of more than 20%, and/or had a total body weight of less than 16 g (n = 7). At the end of the 14 days of MMF treatment the COL4A3-deficient mice had lost less mean body weight than those treated with placebo (10% vs. 14%). The mean+/−SD body weight on the last day of the MMF treatment was 19+/−3 g in the MMF group, 18+/−1 g in the PLC group and 26+/−1 g in the wild-type control group (Additional file 1: Table S1A).
Two observers, independently and blinded to the treat-ment groups of COL4A3-deficient mice, examined the in-filtration of mesangial matrix in 3653 areas after staining with hematoxylin and eosin. The tubulointerstitial fibrosis
present after 2-weeks treatment of COL4A3−/− mice was only slightly inhibited by MMF in comparison to the PLC COL4A3 −/− mice as would be expected for this relatively short period of MMF treatment (WT: all areas with score = <1+; PLC: 13% - score 0, 34% - score 1+, 33% - score 2+, 20% - score 3+; MMF: 11% - score 0, 45% - score 1+, 31% - score 2+, 13% - score 3+), and glomerulosclerosis appeared to be unchanged by MMF (Additional file 2: Figure S1).
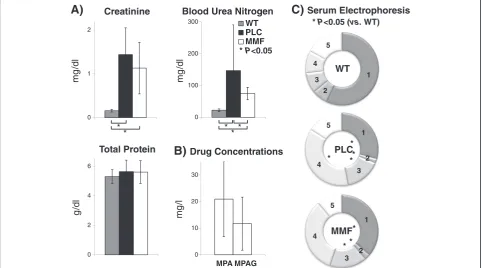
Clinical chemistry protocols for routine measurements in human samples are applicable even for the small murine sample volumes used. Serum and urine bio-chemical parameters are shown in Figure 1 and in Additional file 1: Table S1. Serum creatinine concen-trations were significantly increased (P< 0.05; Figure 1A; Additional file 1: Table S1B) in both COL4A3-deficient groups compared to WT mice (WT: 0.16+/−0.03; PLC: 1.44+/−0.61; MMF: 1.13+/−0.59 mg/dl). Total protein did not show any significant differences (P> 0.05; Figure 1A; Additional file 1: Table S1B) between the three experimen-tal groups (WT: 5.30+/−0.47; PLC: 5.64+/−0.78; MMF: 5.61+/−0.77 g/dl) but blood urea nitrogen was significantly
A)
0 1 2
1
mg
/dl
Creatinine
0 100 200 300
mg
/dl
WT PLC MMF Blood Urea Nitrogen
*P<0.05
1
2
3 4
5
PLC* * * *
1
2 3 4
5
MMF* * *
C)
Serum Electrophoresis * P<0.05 (vs. WT)1
2 3 4
5
WT
0 2 4 6
g
/dl
Total Protein
B)
Drug Concentrations0 10 20 30
mg
/l
MPA MPAG
*
* ***
Figure 1Murine serum analysis using routine diagnostic methods. A)Clinical chemistry on an automated Roche system: The concentrations of serum creatinine, blood urea nitrogen, and total protein are stratified for all three experimental groups (WT n = 3; PLC n = 10; MMF n = 10) and presented as the mean and standard deviation.B)Drug concentrations: The serum pre-dose concentrations of mycophenolic acid (MPA) and mycophenolic acid glucuronide (MPAG) are presented for the treatment group (MMF n = 10) as the mean and standard deviation.C)
Serum electrophoresis: The first fraction (1) stands for albumin, second (2) - alpha-1 globulins, third (3) - alpha-2 globulins, forth (4) - beta globulins and the fifth (5) gamma globulins. The rings show the mean relative proportion of each separated fraction for all three experimental groups (WT n = 3; PLC n = 6; MMF n = 8). Legends: wild-type 129/SvJ mice (WT); placebo COL4A3−/−mice (PLC); COL4A3−/−mice treated with 100 mg/kg mycophenolate mofetil per day (MMF);P< 0.05 using the Mann–Whitney-Utest (*).
Petrovaet al. Proteome Science2014,12:56 Page 2 of 10
lower (P< 0.05; Figure 1A; Additional file 1: Table S1B) in the WT group compared to both COL4A3-defitient groups (WT: 22.47+/−3.97; PLC: 147.00+/−143.61; MMF: 74.75+/−19.67 mg/dl).
Pre-dose MPA and mycophenolic acid glucuronide (MPAG) serum concentrations were below the lower limit of quantification (<0.5 mg/l MPA and 5 mg/l MPAG for 1:5 diluted samples) in the WT and PLC groups. However, MPA concentrations were between 20 and 41 mg/L (mean+/−SD = 21+/−14) and MPAG con-centrations were between 9 and 26 mg/l (12+/−10) in the MMF group of COL4A3−/−mice (Figure 1B; Additional file 1: Table S1C).
Results of the serum electrophoresis (presented in Figure 1C and in Additional file 1: Table S1D) revealed a sig-nificant decrease (P< 0.05) in albumin (WT: 3.02+/−0.26; PLC: 1.72+/−0.44; MMF: 2.10+/−0.53 g/dl) and alpha-1 fractions (WT: 0.37+/−0.04; PLC: 0.11+/−0.05; MMF: 0.15+/−0.07 g/dl) in both COL4A3-deficient groups but a significant increase (P< 0.05) in the alpha-2 fractions (WT: 0.48+/−0.04; PLC: 0.93+/−0.30; MMF: 0.95+/−0.28 g/dl) but no significant difference (P> 0.05) in the beta fraction (WT: 0.53+/−0.13; PLC: 2.18+/−1.06; MMF: 1.95+/−1.23 g/dl) or gamma fraction (WT: 0.89+/−0.07; PLC: 0.94+/−0.49; MMF: 0.64+/−0.33 g/dl).
Urine chemistry (Additional file 1: Table S1E) dem-onstrated increases in total urine protein in both COL4A3-deficient groups (MMF & PLC: 100–300 mg/dl; WT: < 15 mg/dl). Hemoglobin and leucocyte esterase were consistently negative in the WT group in contrast to both COL4A3-deficient groups (hemoglobin: ca. 100 mg/dl; leucocyte esterase: ca. 250 leucocytes/μl). None of the other urine chemistry results showed any significant differences (glucose, bilirubin, urobilinogen, nitrite, ketones, pH, and specific gravity). The urine sediment also showed differences between experimen-tal groups (Additional file 1: Table S1F). Erythrocytes were observed microscopically only in urine samples from both COL4A3-deficient groups and these mice also had less bacteria and amorphous phosphates than was seen in the WT group. In addition, leucocytes were detected in urine from WT and MMF-treated COL4A3−/− mice as well as yeasts and occasionally hyaline cylinders were found in samples from WT and PLC COL4A3−/−mice.
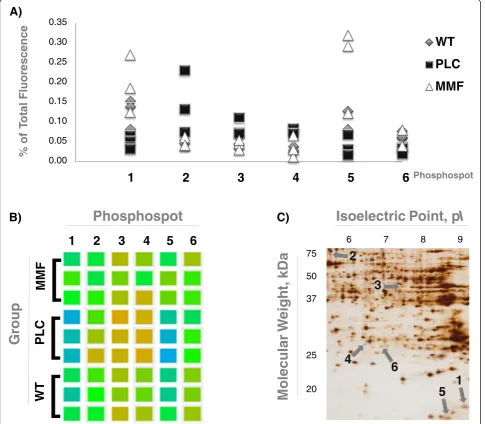
Differential 2-DE analysis of kidney proteins using a phosphorylation-specific stain revealed six protein spots (out of ca. 500) that exhibited significant phosphoryl-ation changes in WT vs. PLC and MMF vs. PLC (P< 0.05) groups. There were no significant differences; however, between WT and MMF groups (P> 0.05; Figure 2; Additional file 1: Table S1G). Three differentially phos-phorylated protein spots (numbers 1, 5 and 6) were down-regulated in PLC COL4A3−/−mice, while another three spots (numbers 2, 3 and 4) were up-regulated. MMF
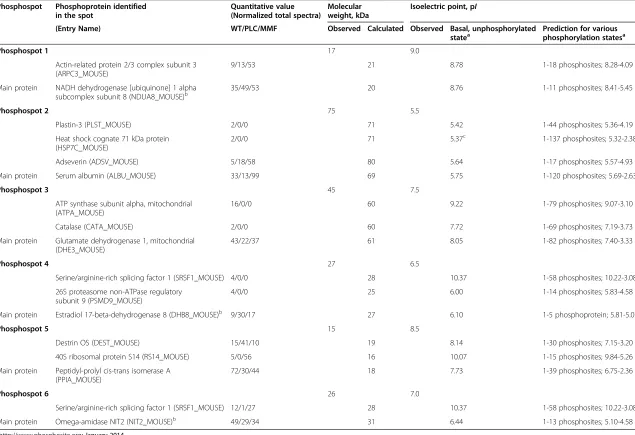
treatment reversed the phosphorylation of all six spots to match that seen in WT mice (Figure 2). These spots were identified in duplicate samples using mass spec-trometry from three replicate 2DE-gels each from one representative WT, one PCL and one MMF mouse. Identified proteins were considered only if the total unique peptide count was > = 3. For all replicates, comparable sets of protein species were identified (see Additional file 3: Table S2 for a list of proteins derived from the WT mice). Even after removal of laboratory contaminants such as human keratin, all of the 2-DE spots examined contained more than one protein, indi-cating a potential overlay with neighboring spots. From the results lists, known phosphoproteins were selected as potential markers and checked for plausibility by comparing the observed molecular weight and isoelec-tric point to the expected values (Table 1).
Discussion
Alport glomerulonephritis is a hereditary disorder lead-ing to kidney fibrosis that is associated with mutations in genes encoding for COL4A3, COL4A4 or COL4A5, a gene necessary for the normal structure of the glomeru-lar basement membrane. If these genes are mutated, the glomerular basement membrane will be altered [24]. In this in vivo study, COL4A3−/− mice served as a model for progressive renal disease seen in the human Alport syndrome [25]. Untreated COL4A3 −/− mice die from renal failure typically after 66 to 71 days [22,26-28], whereas the normal life span of WT mice is 565 days [27]. COL4A3−/−mice have previously been used to study the nephroprotective and antifibrotic effects of different drugs. The life span has been reported to be prolonged by 13% after treatment with paricalcitol [29], by 19% after treat-ment with etanercept [26], by 25% after treattreat-ment with BX471 [30], by 28% after treatment with cerivastatin [28], by >50% after treatment with ramipril [29], by >68% after combined treatment with paricalcitol and ramipril [29], or even by >100% after treatment with ramipril [27]. Previ-ously, we were able to demonstrate improved kidney func-tion in MMF-treated COL4A3−/− mice although the overall survival was not improved [22] and we therefore suggested that, in contrast to the other drugs studied, MMF might have an inhibitory effect on the initial tubu-lointerstitial fibrosis but not on glomerulosclerosis. The proteome changes we found supported this suggestion [31]. To explore the cause of these contradictory findings further, we investigated the effects of MMF on renal func-tion with a special focus on screening for phosphoproteo-mic differences using total protein extracts from the kidneys of 7-week old male WT, PLC treated COL4A3−/− and MMF-treated COL4A3−/−mice.
inter-individual variability as previously reported [22]. The mean MPA concentration was ca. 21 mg/l and the mean MPA and MPAG concentrations were ca. 12 mg/l without any signs of toxicity in these experimental mice as has previously been reported after treatment with 10, 50, 100 and 150 mg MMF/kg/day [22]. Interestingly, MPA and MPAG concentrations in the COL4A3−/−mice were much higher than seen in patients following solid organ trans-plantation. A preliminary therapeutic range for pre-dose MPA concentrations in renal transplantation patients
during the first 3 months post-surgery (when used in asso-ciation with cyclosporine) was only 1.0 to 3.5 mg/l [32]. In a previous study, female Wistar rats aged 12 weeks were treated with 20, 30 or 40 mg/kg MMF once daily using gastric feeding tubes and the group receiving the highest dose of 40 mg/kg developed diarrhea after 26–28 days of treatment [33]. This adverse effect was neither seen in our previous study [22], nor in the present study with COL4A 3−/−mice suggesting a higher tolerance for MMF in our male mouse model as compared to female Wistar rats.
Gr
oup
1
2
3
4
5
6
]
]
]
WT
PL
C
MMF
Phosphospot
B)
1
5
3
2
6
4
75
50
37
25
20
6 7 8 9
Molecular
W
e
igh
t,
kDa
Isoelectric Point, p
I
C)
A)
0.00 0.05 0.10 0.15 0.20 0.25 0.30 0.35
0
1
2
3
4
5
6
%
o
f
T
ot
al
Fluor
escence
Phosphospot
WT
PLC
MMF
0.35
0.30
0.25
0.20
0.15
0.10
0.05
0.00
Figure 2Differentially phosphorylated protein spots in fibrotic kidneys reversed by mycophenolate mofetil. A)Fluorescence: The point diagram presents the percentage of the relative fluorescence of the whole gel (100%), as well as stratification for all three experimental groups (WT n = 3 in gray; PLC n = 3 in black; MMF n = 3 in white).B)Cluster check: The hit phosphospots are shown as squares in different colors, depending on the fluorescence in the original scans of the phospho-stained 2DE gels (using the analysis tool of the Delta2D software). The stratification is done for all three experimental groups (WT n = 3; PLC n = 3; MMF n = 3).C)Silver-stained 2DE gel: The picture visualizes the phosphospots of one representative WT mouse, as well as the isoelectric point (pI) and the molecular weight (kDa) in this zoomed-in area. Legends: wild-type 129/SvJ mice (WT); placebo treated COL4A3−/−mice (PLC); and COL4A3−/−mice treated with 100 mg/kg mycophenolate mofetil per day (MMF).
Petrovaet al. Proteome Science2014,12:56 Page 4 of 10
statea phosphorylation statesa
Phosphospot 1 17 9.0
Actin-related protein 2/3 complex subunit 3 (ARPC3_MOUSE)
9/13/53 21 8.78 1-18 phosphosites; 8.28-4.09
Main protein NADH dehydrogenase [ubiquinone] 1 alpha subcomplex subunit 8 (NDUA8_MOUSE)b
35/49/53 20 8.76 1-11 phosphosites; 8.41-5.45
Phosphospot 2 75 5.5
Plastin-3 (PLST_MOUSE) 2/0/0 71 5.42 1-44 phosphosites; 5.36-4.19
Heat shock cognate 71 kDa protein (HSP7C_MOUSE)
2/0/0 71 5.37c 1-137 phosphosites; 5.32-2.38c
Adseverin (ADSV_MOUSE) 5/18/58 80 5.64 1-17 phosphosites; 5.57-4.93
Main protein Serum albumin (ALBU_MOUSE) 33/13/99 69 5.75 1-120 phosphosites; 5.69-2.63
Phosphospot 3 45 7.5
ATP synthase subunit alpha, mitochondrial (ATPA_MOUSE)
16/0/0 60 9.22 1-79 phosphosites; 9.07-3.10
Catalase (CATA_MOUSE) 2/0/0 60 7.72 1-69 phosphosites; 7.19-3.73
Main protein Glutamate dehydrogenase 1, mitochondrial (DHE3_MOUSE)
43/22/37 61 8.05 1-82 phosphosites; 7.40-3.33
Phosphospot 4 27 6.5
Serine/arginine-rich splicing factor 1 (SRSF1_MOUSE) 4/0/0 28 10.37 1-58 phosphosites; 10.22-3.08
26S proteasome non-ATPase regulatory subunit 9 (PSMD9_MOUSE)
4/0/0 25 6.00 1-14 phosphosites; 5.83-4.58
Main protein Estradiol 17-beta-dehydrogenase 8 (DHB8_MOUSE)b 9/30/17 27 6.10 1-5 phosphoprotein; 5.81-5.07
Phosphospot 5 15 8.5
Destrin OS (DEST_MOUSE) 15/41/10 19 8.14 1-30 phosphosites; 7.15-3.20
40S ribosomal protein S14 (RS14_MOUSE) 5/0/56 16 10.07 1-15 phosphosites; 9.84-5.26
Main protein Peptidyl-prolyl cis-trans isomerase A (PPIA_MOUSE)
72/30/44 18 7.73 1-39 phosphosites; 6.75-2.36
Phosphospot 6 26 7.0
Serine/arginine-rich splicing factor 1 (SRSF1_MOUSE) 12/1/27 28 10.37 1-58 phosphosites; 10.22-3.08
Main protein Omega-amidase NIT2 (NIT2_MOUSE)b 49/29/34 31 6.44 1-13 phosphosites; 5.10-4.58
a
http://www.phosphosite.org; January 2014. b
Main protein identified in each group, not yet described as phosphoprotein. c
Information for the human protein; March 2014.
The table presents possible phosphoproteins, including the main proteins identified in this mouse model for the human Alport syndrome.
Proteome
Science
2014,
12
:56
Page
5
o
f
1
0
.com/cont
Serum creatinine, total protein, as well as the 5 serum electrophoresis fractions did not differ significantly be-tween PLC COL4A3−/−and MMF treated COL4A3−/− mice (Figure 1, Additional file 1: Table S1): results which are consistent with the reported moderate effect of this immunosuppressive drug treatment on survival [22]. However, the blood urea nitrogen level after 2-weeks treat-ment with MMF was significantly decreased, consistent with our previous report [22] and thus suggesting again that tubulointerstitial fibrosis can be inhibited by MMF [31]. Albumin and alpha-1 globulins were decreased while creatinine, alpha-2 globulins, urine dipstick pro-tein, leukocyte esterase (leukocytes), hemoglobin and red blood cells were all increased in both COL4A3−/− groups compared to WT, thereby confirming the pres-ence of glomerulosclerosis.
We found 6 differentially phosphorylated spots (Figure 2). The database search included serine, threonine and tyrosine phosphorylation as variable peptide modifications, however no phosphorylated peptides were identified at sufficient confidence. This is likely due to the substoichiometric nature of protein phosphorylation. Due to the already low abundance of the protein spots, phosphopeptide enrichment strategies were not pursued as they usually require sufficient starting amounts. Protein identifica-tions are summarized in Additional file 1: Table S1 G and Table 1.
The differentially phosphorylated protein spot 1 (ob-served 17 kDa/9 pI) was significantly down-regulated in PLC COL4A3−/− mice. MMF treatment of the COL4A3−/−mice increased the phosphorylation to match that of the WT mice. The major protein in the spots of all three groups was NADH dehydrogenase [ubiquinone] 1 alpha subcomplex subunit 8 (NDUA8), however NDUA8 is not described as a phosphoprotein. The spot also con-tained one possible phosphoprotein: actin-related protein 2/3 complex subunit 3 (ARPC3), an actin-binding cyto-skeleton protein that is involved in cell projection and lamellipodium and functions as a component of the Arp2/3 complex. The Arp2/3 complex generates branched actin filaments in motile cells that drive the cell front forward [34]. In a recent study it was reported that threonine and tyrosine phosphorylation are important for a subset of the functions of the Arp2/3 complex, including the regulation of development [35].
The phosphorylation of phosphospot 2 (observed 75 kDa/5.5 pI) was significantly up-regulated in PLC COL4A3−/− mice, while the MMF treatment of the COL4A3−/− mice reversed the phosphorylation to be similar to that seen in WT mice. This spot contained four proteins previously described as phosphoproteins: serum albumin (ALBU), adseverin (ADSV), heat shock cognate 71 kDa protein (HSP7C) and plastin-3 (PLST). ALBU was the most abundant protein in the spot as
indicated by spectral counts. Phosphorylation of ALBU was also observed in the extracellular medium. This protein is involved in the regulation of the colloidal osmotic pressure of blood, transport, cellular responses to starvation, negative regulation of apoptosis, and other processes. The second possible phosphoprotein was ADSV, involved in the actin filament capping, the negative regulation of cell proliferation, as well as in the positive regulation of apoptosis. HSP7C and PLST were identified at low abundance: HSP7C inhibits the transcriptional coactivator activity of CITED1 on Smad-mediated tran-scription, whereas PLST, the actin-binding protein in intestinal microvilli and fibroblast filopodia, is involved in motility, polarity and chemotaxis. Interestingly, PLST belongs to the plastin protein family of three isoforms with relatively high homology between: I (plastin-1 expressed in the intestine and kidney), L (plastin-2 in leukocytes and cancer) and T (plastin-3 in solid tissues) [36]. Only L-plastin has been reported (to date) to be phosphory-lated [37] and it has been identified as a transformation-induced polypeptide of neoplastic fibroblasts [36]. Moreover, L-plastin is included in a novel serum triple marker assay for the early detection of malignant kidney tumors [38].
While the phosphospot 3 (observed 45 kDa/7.5 pI) showed a significant increase in phosphorylation in PLC COL4A3−/− mice, MMF treatment of the COL4A3−/− mice reversed this phosphorylation. This spot matched three possible phosphoproteins: the main protein was glutamate dehydrogenase 1 (DHE3), but ATP synthase subunit alpha (ATPA) (involved in the embryonic devel-opment and negative regulation of endothelial cell prolif-eration), and catalase (CATA) were also identified. Although identified at low spectral count, indicating low relative abundance in the spot, CATA is still of high interest with respect to kidney fibrosis. CATA is the per-oxisome enzyme, oxidoreductase, involved in numerous biological processes including kidney development, negative regulation of apoptosis positive regulation of cell division, and a selenium-centered micronutrient bio-logical network. Interestingly, CATA promotes growth of a number of cell types including T-cells, B-cells, and both normal and transformed fibroblast cells. One recent study showed that T lymphocytes and IL-6 play import-ant roles in renal fibrosis [39]. Another group has reported that monocytes may influence myofibroblast accumulation via TGF-beta 1, and that monocytes, but not myofibroblasts, are associated with tubular atrophy in Alport mice [40].
The phosphoprotein spot 4 (observed 27 kDa/6.5 pI) showed significantly increased phosphorylation in PLC COL4A3−/− mice and MMF treatment of the COL4A3−/−mice reversed this to become similar to that seen in WT mice. This spot matched two possible
Petrovaet al. Proteome Science2014,12:56 Page 6 of 10
phosphoproteins: serine/arginine-rich splicing factor 1 (SRSF1) and the 26S proteasome non-ATPase regula-tory subunit 9 (PSMD9). The most abundant protein identified in all three groups has not yet been described as a phosphoprotein: estradiol 17-beta-dehydrogenase 8 (DHB8).
The phosphoprotein spot 6 (observed 26 kDa/7 pI) was significantly down-regulated in PLC COL4A3−/− mice, but MMF treatment of the COL4A3−/− mice increased the phosphorylation to that seen in WT mice. In all three groups this spot contained one main protein, omega-amidase NIT2 (NIT2), not previously described as a phosphoprotein, and one possible phosphoprotein: the above mentioned SRSF1. We postulate that the increased phosphorylation of phosphospot 4 and the decreased phosphorylation of phosphospot 6 are related to SRSF1 because it is known that increasing phosphor-ylation of the phosphosites can shift the pI to lower values (Phosphospot 4, 6.5 pIobserved, = 18 phosphory-lated phosphosites vs. Phosphospot 6, 7 pI observed, = 14 phosphorylated phosphosites, Figure 2C). SRSF1 is involved in the regulation of constitutive and alternative splicing. In a recent review it was noted that SRSF1 has also been shown to promote tumor transformation and growth by several mechanisms; for example, by stabiliz-ing mRNA of anti-apoptotic factors 21 and by generat-ing inactive tumor suppressor proteins by alternative splicing [41]. Reversible phosphorylation cascades are able to rapidly conduct signals throughout the cell and are probably important in mediating extracellular signals to the spliceosome [42].
The differentially phosphorylated protein spot 5 (ob-served 15 kDa/8.5 pI) was significantly down-regulated in PLC COL4A3−/− mice and MMF treatment of the COL4A3−/− mice reversed this down regulation. This spot contained three possible phosphoproteins: peptidyl-prolyl cis-trans isomerase (PPIA), 40S ribosomal protein S14 (RS14) and destrin (DEST). PPIA, which appears to be most abundant phosphoprotein in the spot, is involved in inflammation, acceleration of the folding of proteins, and in the positive regulation of protein secretion. In a recent study using human colon cancer cells, DEST appeared to be required for cell migration and invasion in response to a pro-invasive neuroendocrine peptide. This property was re-lated to a DEST-dependent phosphorylation of a p130Crk-associated substrate (p130Cas) upon cell adhesion [43]. The structural constituent of ribosome RS14 (regulation of translation) however was only present in very low quantity in the spot as indicated by spectral counts.
Conclusions
The current data confirmed the ability of MMF to mod-erately improve kidney function in a mouse model of human Alport syndrome, presumably through inhibition
of tubulointerstitial fibrosis. MMF reversed the COL4A3 related phosphorylation status of renal proteins in this murine fibrotic kidney model to that seen in WT mice. The involved phosphoproteins are associated with a num-ber of important cell properties including: cell projection, motility, migration, invasion, polarity, division, transform-ation, and cell growth (T-cells, B-cells, fibroblasts). These results support our in vitro findings using functional assays with the human epithelial HK-2 cell line from proximal tubuli [44] and on the monkey renal fibroblast COS-7 cell line [13]. It may be speculated that the MMF treatment was initiated too late or the duration was too short to reverse the changes leading to renal fibrosis in the treated COL4A3−/− mice. Further studies are necessary to clarify, validate or extend these preliminary findings.
Methods
COL4A3-deficient mice
This study was approved by the local German authorities (LAVES, Oldenburg, Germany, 2011) and supervised by veterinarians. COL4A3−/− mice were obtained from Jackson Laboratory (Bar Harbor, ME). They were bred on a 129/SvJ genetic background, to reduce individual differ-ences, under pathogen-free housing conditions with a 12-hour dark and light period and unlimited access to food and water at the local animal facility. DNA was isolated using the DNeasy kit® (Blood & Tissue Kit; QIAGEN GmbH, Hilden, Germany). Genotyping of the murine COL4A3gene was conducted according to Cosgrove et al. [24]. Twenty 5-week old COL4A3−/− mice, all male in order to avoid gender-specific differences, and with a body weight of more than 16 g, were randomly allocated to two experimental groups (PLC: n = 10, MMF: n = 10). They were treated daily by gavage with either an MMF solution (100 mg/kg) or with an equivalent amount of vehicle placebo (PLC) as described previously [22]. They were examined daily and their body weight was documented. After 14 days of treatment they were sacrificed using an approved protocol. An additional three wild type mice were used as controls (WT: mouse strain 129/SvJ), be-cause reference values for the parameters studied in the WT mouse strain were not available. Serum, urine, and kidney tissues were collected 24 hours after the last MMF treatment and stored at−80°C for further analysis. All re-sults obtained in serum from COL4A3-deficient groups were corrected with a dilution factor (1:5 or 1:10 dilution; vol/volusing 0.9% NaCl). Serum from WT mice was not diluted except for serum electrophoresis which was di-luted 1:10 in all three groups.
Histological staining with hematoxylin and eosin
two observers blinded to the groups as described previ-ously [31]. Tubulointerstitial fibrosis was scored semi-quantitatively using light microscopy in accordance with the Banff criteria [45]: 0 (no tubulointerstitial changes); 1+ (less than 25%); 2+ (25–50%) and 3+ (more than 50%). Additionally, histological evaluation and protein isolation were also done on serial cryo-slides (Microtome, Microm HM325; Thermo Scientific, Walldorf, Germany).
Clinical chemistry: serum and urine
Serum concentrations of creatinine, blood urea nitrogen, and total protein were quantified using a Cobas 8000 modular analyzer (Roche Diagnostics GmbH, Mannheim, Germany) as described elsewhere [22] using pre-diluted samples (1:5). Serum electrophoresis was also conducted using pre-diluted samples (1:10) and routine diagnostic equipment (Hyrys 2, Sebia GmbH, Fulda, Germany).
Urine dipstick chemistries and microscopic examina-tions were performed as follows: 3–10 μl sample per analyte were analyzed on 11-field-AUTION dipsticks (URIFLET S; ARKRAY Factory Inc, Shiga, Japan) using an AUTION analyzer (AUTION MAX; ARKRAY Factory Inc, Shiga, Japan) and microscopic evaluations of the urine sediments were done using a phase-contrast microscope (Zeiss Standard 14 with objective 5165602 and ocular K-pl-W 12,5x/18; Carl Zeiss Microscopy GmbH, Jena, Germany; 400-fold total magnification) on 100μl samples after centrifugation (2 min at ca. 3000 × g; centrifuge type 3530; Abbott Laboratories GmbH, Hannover, Germany).
Drug concentrations
Pre-dose serum concentrations of mycophenolic acid (MPA) and mycophenolic acid glucuronide (MPAG) were measured in pre-diluted samples (1:5) using a Quattro Premier XE Triple Quadrupole mass spectrometer (Waters Corporation, Milford Massachusetts, U.S.A.) as previously described [22].
Two-dimensional electrophoresis (2DE)
Cryo-slides of kidneys (3 mice per group: WT, PCL, and MMF) were used for protein isolation as previously described [31]. Briefly, protein concentrations were deter-mined with the Bradford method [46]. Two-dimensional electrophoresis (2-DE) gels each with 125 μg protein/ immobilized pH gradient strip (17-cm; nonlinear pH range of 3–10; ReadyStrip TM; Bio-Rad) were produced using the method of Görg et al. [47]. The strips were passively rehydrated and the proteins were then focused in a Protein IEF Cell (Bio-Rad). The strips were loaded onto a vertical 12.5% polyacrylamide gel for further sep-aration. The gels with spots separated according to both isoelectric point and molecular weight were stained first with Ready Solution Pro-Q® Diamond Phosphoprotein Gel Stain according to the manufacturer’s recommendations
(Invitrogen, Ltd., Paisley, UK) to produce fluorescence of differentially phosphorylated proteins as previously described [48]. Subsequently, scans were done using a fluorescence scanner (FLA 5100; Fujifilm Europa GmbH, Düsseldorf, Germany). In order to visualize and quantify the protein spots, the gels were further stained with silver according the modified method of Blum et al. [49]. Scans of the phospho-stained gels and silver-stained gels were densitometrically quantified using the Delta2D software (Version 4.2, DECODON GmbH, Greifswald, Germany). The spot intensity was evaluated as a percentage of the total intensity in each gel. A statistical tool integrated into the Delta2D software was used to evaluate the differences in protein phosphorylation between the groups. Protein spots of interest were those spots that differed significantly between WT and PLC COL4A3−/−mice but without any statistically significant difference between WT and MMF COL4A3−/−mice. A change of at least 50% in phosphor-ylation was used as the cut off for spot selection. Selected spots were excised and digested in-gel with trypsin accord-ing to Shevchenko et al. [50].
Protein identification by mass spectrometry
Mass spectrometric analysis was carried out with peptide mixtures after preconcentration on a Reversed Phase-C18 precolumn (0.15 mm ID × 20 mm self-packed with Reprosil-Pur120 C18-AQ 5μm, Dr. Maisch, Ammerbuch-Entringen, Germany) and separation by Reversed Phase-C18 nanoflow chromatography [0.075 mm ID × 200 mm Picofrit column (New Objective, Woburn/MA, USA) self-packed with Reprosil-Pur 120 C18-AQ, 5 μm] using a 15 min linear gradient on a nanoLC 425 nanoflow chro-matography system (AB SCIEX, Framingham/MA, U.S. A.). The eluent was analyzed using a Top10 method in the Data Dependent Acquisition mode on a TripleToF 5600+ QqToF mass spectrometry system operated using Analyst TF1.6 software (AB SCIEX, Foster City/CA, USA). For database searching, tandem mass spectra were extracted using AB SCIEX MS Data Converter software v1.3 beta. All MS/MS samples were analyzed using Mascot v2.4.1 software (Matrix Science, London, UK) set up to search the UniProt/SwissProt database (release 02/14 filtered for Mus musculus, 16665 entries) with mass tolerances of 10 ppm for precursors and 0.05 Da for fragments, respect-ively. Cysteine carbamidomethylation was used as a fixed modification, methionine oxidation and serine, threonine and tyrosine phosphorylation as the variable modification. Scaffold v4.0.5 software (Proteome Software Inc., Portland/ OR, USA) was used to validate MS/MS based peptide and protein identifications. Peptide identifications were accepted if they could be established at greater than 95.0% confidence. Protein identifications required a minimum of three confident peptide identifications and a protein confidence threshold of 99.0%. Spectral counts
Petrovaet al. Proteome Science2014,12:56 Page 8 of 10
(i.e. the number of MS/MS sequencing events leading to identification of the same protein) were used to esti-mate the relative abundance of proteins contained in a single spot. From the results list, known phosphopro-teins were selected using publicly available on-line resources (http://www.phosphosite.org and http://www. genecards.org, January 2014).
Statistics
The significance of the differences between the experi-mental groups was calculated using the Mann–Whitney Utest (IBM SPSS 20, Ehningen, Germany). P< 0.05 was considered statistically significant.
Additional files
Additional file 1: Table S1.Data Overview. The information derived from the experimental mice (A: Body weight of mice at 7 weeks of age), serum (B: Clinical chemistry; C: Drug concentrations; D: Serum protein electrophoresis) and urine samples (E: Urine dipstick; F: Urine sediment) as well as kidney tissues (G: Differentially phosphorylated protein spots) are presented as the mean and standard deviation along withP-value according to Mann–Whitney-Utest if appropriate.
Additional file 2: Figure S1.H & E staining. The pictures illustrate the histochemical data from one representative wild-type 129/SvJ mouse (WT); one placebo treated COL4A3−/−mouse (PLC); and one COL4A3−/−mouse treated with 100 mg/kg mycophenolate mofetil per day (MMF).
Additional file 3: Table S2.Protein Overview. The matrix presents an unfiltered list of all proteins identified from the total unique peptides (more than 3) in the six phosphospots of interest. The protein identification presented here was done in one representative wild-type mouse. The main spot protein (printed in bold) was the same as in the PLC and MMF COL4A3−/−mice.
Abbreviations
IMPDH:Inosine monophosphate dehydrogenase; MPA: Mycophenolic acid; MMF: Mycophenolate mofetil; MPAG: Mycophenolic acid glucuronide; PLC: Placebo; 2-DE: Two-dimensional electrophoresis; WT: Wild type.
Competing interests
The authors declared that they have no competing interests.
Authors’contribution
DTP designed and supervised the experiments, analyzed the data and wrote the manuscript. FCS contributed to data analysis and helped write the manuscript. GB designed the experiments, contributed to data analysis and helped write the manuscript. KDL, CL, HU, DR and OG participated in the experiments and discussion. PDW supervised the experimental design and helped write the manuscript. MO conceived the proposed study, supervised the experimental design and helped write the manuscript. All authors read and approved the final manuscript.
Acknowledgement
We greatly appreciate the skillful technical assistance of Mrs. Knoke, Goetze, Huynh, Kaufmann, Neuenroth and Wiese (Institute of Clinical Chemistry, Goettingen, Germany). We are grateful to Mrs. Fey and Dr. Alwahsh (Clinics of Gastroenterology and Endocrinology, Goettingen, Germany) for the help with the H & E staining. This study was supported by DGKL (Stiftung für Pathobiochemie und Molekulare Diagnostik der Deutschen Vereinten Gesellschaft für Klinische Chemie und Laboratoriumsmedizin e.V., Germany). We also acknowledge support by the German Research Foundation and the Open Access Publication Funds of the Göttingen University. Some of these results were presented at the Congress of Clinical Chemistry and Laboratory Medicine, Mannheim, Germany, 2012.
Author details 1
Department of Clinical Pharmacology, Institute of Clinical Chemistry, University Medical Center Goettingen, Robert-Koch-Str. 40, 37099 Goettingen, Germany.2Clinics of Gastroenterology and Endocrinology, University Medical Center Goettingen, Goettingen, Germany.3Institute of Clinical Chemistry, University Medical Center Goettingen, Goettingen, Germany.4Department of Clinical Pharmacology, University Medical Center Goettingen, Goettingen, Germany.5Max Planck Institute for Biophysical Chemistry, Bioanalytical Mass Spectrometry Group, Goettingen, Germany.6Clinics of Nephrology and Rheumatology, University Medical Center Goettingen, Goettingen, Germany.
Received: 19 June 2014 Accepted: 25 November 2014
References
1. Carr SF, Papp E, Wu JC, Natsumeda Y:Characterization of human type I and type II IMP dehydrogenases.J Biol Chem1993,268:27286–27290. 2. Allison AC, Eugui EM:Mycophenolate mofetil and its mechanisms of
action.Immunopharmacology2000,47:85–118.
3. Allison AC:Mechanisms of action of mycophenolate mofetil.Lupus2005,
14:s2–s8.
4. Villarroel MC, Hidalgo M, Jimeno A:Mycophenolate mofetil: an update. Drugs Today (Barc)2009,45:521–532.
5. Oellerich M, Shipkova M, Schutz E, Wieland E, Weber L, Tönshoff B, Armstrong VW:Pharmacokinetic and metabolic investigations of mycophenolic acid in pediatric patients after renal transplantation: implications for therapeutic drug monitoring. German Study Group on mycophenolate mofetil therapy in pediatric renal transplant recipients. Ther Drug Monit2000,22:20–26.
6. Miljkovic D, Samardzic T, Drakulic D, Stosic-Grujicic S, Trajkovic V:
Immunosuppressants leflunomide and mycophenolic acid inhibit fibroblast IL-6 production by distinct mechanisms.Cytokine2002,
19:181–186.
7. Baer PC, Wegner B, Geiger H:Effects of mycophenolic acid on IL-6 expression of human renal proximal and distal tubular cells in vitro. Nephrol Dial Transplant2004,19:47–52.
8. Shipkova M, Armstrong VW, Oellerich M, Wieland E:Mycophenolate mofetil in organ transplantation: focus on metabolism, safety and tolerability. Expert Opin Drug Metab Toxicol2005,1:505–526.
9. Badid C, Vincent M, McGregor B, Melin M, Hadj-Aissa A, Veysseyre C, Hartmann DJ, Desmouliere A, Laville M:Mycophenolate mofetil reduces myofibroblast infiltration and collagen III deposition in rat remnant kidney.Kidney Int2000,58:51–61.
10. Johnsson C, Gerdin B, Tufveson G:Effects of commonly used
immunosuppressants on graft-derived fibroblasts.Clin Exp Immunol2004,
136:405–412.
11. Morath C, Schwenger V, Beimler J, Mehrabi A, Schmidt J, Zeier M, Muranyi W:Antifibrotic actions of mycophenolic acid.Clin Transplant2006,
20:25–29.
12. Roos N, Poulalhon N, Farge D, Madelaine I, Mauviel A, Verrecchia F:In vitro evidence for a direct antifibrotic role of the immunosuppressive drug mycophenolate mofetil.J Pharmacol Exp Ther2007,321:583–589. 13. Petrova DT, Brandhorst G, Brehmer F, Gross O, Oellerich M, Armstrong VW:
Mycophenolic acid displays IMPDH-dependent and IMPDH-independent effects on renal fibroblast proliferation and function.Ther Drug Monit
2010,32:405–412.
14. Chang HW, Wu VC, Wu KD, Huang HY, Hsieh BS, Chen YM:In rat renal fibroblasts, mycophenolic acid inhibits proliferation and production of the chemokine CCL2, stimulated by tumour necrosis factor-alpha. Br J Pharmacol2010,160:1611–1620.
15. Weimer R, Mytilineos J, Feustel A, Preiss A, Daniel V, Grimm H, Wiesel M, Opelz G:Mycophenolate mofetil-based immunosuppression and cytokine genotypes: effects on monokine secretion and antigen presentation in long-term renal transplant recipients.Transplantation2003,75:2090–2099. 16. Kaminska D, Tyran B, Mazanowska O, Letachowicz W, Kochman A,
17. Djamali A, Vidyasagar A, Yagci G, Huang LJ, Reese S:Mycophenolic acid may delay allograft fibrosis by inhibiting transforming growth factor-beta1-induced activation of Nox-2 through the nuclear factor-kappaB pathway.Transplantation2010,90:387–393.
18. Romero F, Rodríguez-Iturbe B, Parra G, González L, Herrera-Acosta J, Tapia E:
Mycophenolate mofetil prevents the progressive renal failure induced by 5/6 renal ablation in rats.Kidney Int1999,55:945–955.
19. Fujihara CK, Noronha IL, Malheiros, Antunes GR, de Oliveira IB, Zatz R:
Combined mycophenolate mofetil and losartan therapy arrests established injury in the remnant kidney.J Am Soc Nephrol2000,11:283–290. 20. Gonçalves RG, Biato MA, Colosimo RD, Martinusso CA, Pecly ID, Farias EK,
Cardoso LR, Takiya CM, Ornellas JF, Leite M Jr:Effects of mycophenolate mofetil and lisinopril on collagen deposition in unilateral ureteral obstruction in rats.Am J Nephrol2004,24:527–536.
21. Krämer S, Loof T, Martini S, Rückert M, Wang Y, Böhler T, Shimizu F, Kawachi H, Neumayer HH, Peters H:Mycophenolate mofetil slows progression in anti-thy1-induced chronic renal fibrosis but is not additive to a high dose of enalapril.Am J Physiol Renal Physiol2005,289:F359–F368. 22. Brandhorst G, Brehmer F, Petrova DT, Gross O, Miosge N, Armstrong VW,
Oellerich M:Mycophenolic acid predose concentrations and renal function in a mouse model for progressive renal fibrosis.Ther Drug Monit
2010,32:73–78.
23. Waller JR, Brook NR, Bicknell GR, Murphy GJ, Nicholson ML:Mycophenolate mofetil inhibits intimal hyperplasia and attenuates the expression of genes favouring smooth muscle cell proliferation and migration. Transplant Proc2005,37:164–166.
24. Cosgrove D, Meehan DT, Grunkemeyer JA, Kornak JM, Sayers R, Hunter WJ, Samuelson GC:Collagen COL4A3 knockout: a mouse model for autosomal Alport syndrome.Genes Dev1996,10:2981–2992.
25. Alport AC:Hereditary familial congenital haemorrhagic nephritis.BMJ1927,
1:504–506.
26. Ryu M, Mulay SR, Miosge N, Gross O, Anders HJ:Tumour necrosis factor-α drives Alport glomerulosclerosis in mice by promoting podocyte apoptosis.J Pathol2012,226:120–131.
27. Gross O, Beirowski B, Koepke ML, Kuck J, Reiner M, Addicks K, Smyth N, Schulze-Lohoff E, Weber M:Preemptive ramipril therapy delays renal failure and reduces renal fibrosis in COL4A3-knockout mice with Alport syndrome.Kidney Int2003,63:438–446.
28. Koepke ML, Weber M, Schulze-Lohoff E, Beirowski B, Segerer S, Gross O:
Nephroprotective effect of the HMG-CoA-reductase inhibitor cerivastatin in a mouse model of progressive renal fibrosis in Alport syndrome. Nephrol Dial Transplant2007,22:1062–1069.
29. Rubel D, Stock J, Ciner A, Hiller H, Girgert R, Müller GA, Gross O:Antifibrotic, nephroprotective effects of paricalcitol versus calcitriol on top of ACE-inhibitor therapy in the COL4A3 knockout mouse model for progressive renal fibrosis.Nephrol Dial Transplant2014,29:1012–1019. 30. Ninichuk V, Gross O, Reichel C, Khandoga A, Pawar RD, Ciubar R, Ciubar R,
Segerer S, Belemezova E, Radomska E, Luckow B, Perez de Lema G, Murphy PM, Gao JL, Henger A, Kretzler M, Horuk R, Weber M, Krombach F, Schlöndorff D, Anders HJ:Delayed chemokine receptor 1 blockade prolongs survival in collagen 4A3-deficient mice with Alport disease.J Am Soc Nephrol2005,
16:977–985.
31. Petrova DT, Brehmer F, Schultze FC, Asif AR, Gross O, Oellerich M, Brandhorst G:Differential kidney proteome profiling in a murine model of renal fibrosis under treatment with mycophenolate mofetil. Pathobiology2011,78:162–170.
32. Shaw LM, Holt DW, Oellerich M, Meiser B, van Gelder T:Current issues in therapeutic drug monitoring of mycophenolic acid: report of a roundtable discussion.Ther Drug Monit2001,23:305–315. 33. Heller T, Geide A, Bonitz U, Wegner U, Gröne HJ, Armstrong VW,
Oellerich M:Effect of the antioxidant idebenone on adverse events under mycophenolate mofetil therapy in a rat model.Transplantation
2008,85:739–747.
34. Pollard TD, Borisy GG:Cellular motility driven by assembly and disassembly of actin filaments.Cell2003,112:453–465.
35. Choi CH, Thomason PA, Zaki M, Insall RH, Barber DL:Phosphorylation of actin-related protein 2 (Arp2) is required for normal development and cAMP chemotaxis in Dictyostelium.J Biol Chem2013,288:2464–2474. 36. Shinomiya H:Plastin family of actin-bundling proteins: its functions in
leukocytes, neurons, intestines, and cancer.Int J Cell Biol2012,
2012:213492.
37. Delanote V, Vandekerckhove J, Gettemans J:Plastins: versatile modulators of actin organization in (patho) physiological cellular processes. Acta Pharmacol Sin2005,26:769–779.
38. Su Kim D, Choi YD, Moon M, Kang S, Lim JB, Kim KM, Park KM, Cho NH:
Composite three-marker assay for early detection of kidney cancer. Cancer Epidemiol Biomarkers Prev2013,22:390–398.
39. Yhee JY, Yu CH, Kim JH, Sur JH:Effects of T lymphocytes, interleukin-1, and interleukin-6 on renal fibrosis in canine end-stage renal disease. J Vet Diagn Invest2008,20:585–592.
40. Rodgers KD, Rao V, Meehan DT, Fager N, Gotwals P, Ryan ST, Koteliansky V, Nemori R, Cosgrove D:Monocytes may promote myofibroblast accumulation and apoptosis in Alport renal fibrosis.Kidney Int2003,
63:1338–1355.
41. Aksaas AK, Eikvar S, Akusjärvi G, Skålhegg BS, Kvissel AK:Protein kinase a-dependent phosphorylation of serine 119 in the proto-oncogenic serine/arginine-rich splicing factor 1 modulates its activity as a splicing enhancer protein.Genes Cancer2011,2:841–851.
42. Stamm S:Regulation of alternative splicing by reversible protein phosphorylation.J Biol Chem2008,283:1223–1227.
43. Estornes Y, Gay F, Gevrey JC, Navoizat S, Nejjari M, Scoazec JY, Chayvialle JA, Saurin JC, Abello J:Differential involvement of destrin and cofilin-1 in the control of invasive properties of Isreco1 human colon cancer cells. Int J Cancer2007,121:2162–2171.
44. Koch C, Petrova D, Eberle C, Schultze F, Brandhorst G, Oellerich M:The functional effect of mycophenolic acid on renal fibrosis in vitro [abstract]. Clin Chem Lab Med2012,50:A205–A270. P06.
45. Racusen LC, Solez K, Colvin RB, Bonsib SM, Castro MC, Cavallo T, Croker BP, Demetris AJ, Drachenberg CB, Fogo AB, Furness P, Gaber LW, Gibson IW, Glotz D, Goldberg JC, Grande J, Halloran PF, Hansen HE, Hartley B, Hayry PJ, Hill CM, Hoffman EO, Hunsicker LG, Lindblad AS, Yamaguchi Y, Marcussen N, Mihatsch MJ, Nadasdy T, Nickerson P, Olsen TS, Papadimitriou JC:The Banff 97 working classification of renal allograft pathology.Kidney Int1999,
55:713–723.
46. Bradford MM:A rapid and sensitive method for the quantitation of microgram quantities of protein using the principle of protein-dye binding. Anal Biochem1976,72:248–254.
47. Görg A, Obermaier C, Boguth G, Harder A, Scheibe B, Wildgruber R, Weiss W:
The current state of two-dimensional electrophoresis with immobilized ph gradients.Electrophoresis2000,21:1037–1053.
48. Schultze FC, Petrova DT, Oellerich M, Armstrong VW, Asif AR:Differential proteome and phosphoproteome signatures in human T-lymphoblast cells induced by sirolimus.Cell Prolif2010,43:396–404.
49. Blum H, Beier H, Gross HJ:Improved silver staining of plant proteins, RNA and DNA in polyacrylamide gels.Electrophoresis1987,8:93–99.
50. Shevchenko A, Wilm M, Vorm O, Mann M:Mass spectrometric sequencing of proteins from silver-stained polyacrylamide gels.Anal Chem1996,
68:850–858.
doi:10.1186/s12953-014-0056-z
Cite this article as:Petrovaet al.:Effects of mycophenolate mofetil on kidney function and phosphorylation status of renal proteins in Alport
COL4A3-deficient mice.Proteome Science201412:56.
Submit your next manuscript to BioMed Central and take full advantage of:
• Convenient online submission
• Thorough peer review
• No space constraints or color figure charges
• Immediate publication on acceptance
• Inclusion in PubMed, CAS, Scopus and Google Scholar
• Research which is freely available for redistribution
Submit your manuscript at www.biomedcentral.com/submit
Petrovaet al. Proteome Science2014,12:56 Page 10 of 10