CrossMark Published by DiscoverSys
ABSTRACT
Background: Osteonecrosis is the death of bone cells that can be associated with alcohol abuse. Alcohol abuse has been projected to increase by 0.6% every year. The high morbidity and cost of therapy of osteonecrosis necessitate the effort to prevent osteonecrosis before it manifested. Astaxanthin is an antioxidant that is expected to increase the number of osteocyte and osteoblast cells, decrease the number of adipocyte cells, and reduce the incidence of osteonecrosis.
Methods: This is an experimental randomized post-test control only group design. A total of 24 Wistar rats who met the inclusion criteria were randomly assigned to the control group with the administration of alcohol and the treatment group with the administration of alcohol and astaxanthin. The number of osteocytes, osteoblasts, adipocytes, and osteonecrosis occurrence was examined in the first, second, and third week.
Results: Statistical analysis showed a lower average number of osteoblast cells in the control group (38+1.43) than in the treatment
group (55.63±2.17) with astaxanthin administration. The same results can also be seen in the number of osteocyte cells in the control group (16.69±0.94) as compared with the treatment group (28.06±1.26). Meanwhile, the average number of adipocyte cells in the control group showed a higher yield (58.69±1.18) when compared with the treatment group (27.50±1,24). The occurrence of osteonecrosis, as depicted by the presence of empty lacunae and necrotic osteocyte cells, showed the highest increase in osteonecrosis occurrence at week 3 (34.56±0.31) of the control group. While in the treatment group, the decrease in the incidence of osteonecrosis showed the lowest number in week 3 (4.75±0.79). The statistical analysis test using one-way ANOVA showed that the mean difference between treatment and control groups was statistically significant (p <0.05).
Conclusions: The above calculation showed that administration of astaxanthin could decrease the incidence of osteonecrosis in the femoral head of rats exposed to alcohol.
Keywords: Osteonecrosis, caput femoris of rat, astaxanthin, osteoblast, osteocyte, adipocyte, alcohol
Cite This Article: Wiradiputra, A.E., Suyasa, I.K., Kawiyana, K.S., Astawa, P. 2018. Astaxanthin increase osteocytes, osteoblasts, decrease adipocytes cells, and reduces osteonecrotic events in femoral head of Wistar rats exposed to alcohol. Bali Medical Journal 7(2): 267-278. DOI:10.15562/bmj.v7i2.957
Astaxanthin increase osteocytes, osteoblasts,
decrease adipocytes cells, and reduces
osteonecrotic events in femoral head of
Wistar rats exposed to alcohol
Agus Eka Wiradiputra,1,2* I Ketut Suyasa,1 Ketut Siki Kawiyana,1 Putu Astawa1
INTRODUCTION
Osteonecrosis is the death of bone tissue because of lack of nutrition supplied by blood circulation. It may be caused by both trauma and nontrau-matic processes. Prevention is important because osteonecrosis has high morbidity rate that causes a formidable financial burden.
Nontraumatic causes of osteonecrosis are Perthes disease, Caisson disease, Gaucher disease, alcohol consumption, and systemic lupus erythe-matosus.1 Osteonecrosis mostly occurs on the bone with single vascularization and limited collateral, such as the femoral head (caput femoris), humerus, carpal, and talus.2 One-third of nontraumatic cases are related to corticosteroid and alcohol. Studies showed that 10%-74% patients with nontraumatic osteonecrosis consume alcohol. Another study suggested that alcoholism increased the risk of femoral head osteonecrosis.3
Human and animal studies showed that coagulation disorder and oxidative stress are factors related to osteonecrosis.4,5 Vascular block-age is caused by thromboembolism on the blood vessel that nourishes the bone.6 Estrogen therapy in Turner Syndrome was found to increase the risk of thromboembolism in femoral head.7 Alcoholism also significantly decrease bone marrow activity in patients with osteonecrosis.8 Alcohol consumption per capita in Southeast Asia increased during 2005-2010. Indonesia ranked fifth with 0.6% of projected 5-years-increase.9 From 2000 to 2010, 1153 decom-pression and hip replacement procedures were performed in Taiwan, 45.2% of which were caused by alcohol-related femoral head osteonecrosis.10 A 2004 survey of 1502 patients with idiopathic femoral head osteonecrosis, 31% were related to alcohol abuse.11
1Orthopaedic and Traumatology,
Faculty of Medicine, Universitas Udayana/Sanglah General Hospital
2Magister of Biomedic Program,
Postgraduate Program, Universitas Udayana, Denpasar
*Correspondence to:
Agus Eka Wiradiputra, Orthopaedic and Traumatology, Faculty of Medicine, Universitas Udayana/ Sanglah General Hospital,
Magister of Biomedic Program, Postgraduate Program, Universitas Udayana, Denpasar
Received: 2017-11-21 Accepted: 2018-1-9 Published: 2018-1-11
Volume No.: 7
Issue: 2
First page No.: 267
P-ISSN.2089-1180
E-ISSN.2302-2914
An animal study showed that alcohol exposure increases the size and proliferation of adipocyte tissue in subchondral of femoral head, while also increases bone pressure in the proximal femur. Increase in adipocyte volume is hypothesized as the cause of sinusoid collapse that reduces perfusion in femoral head, leading to osteonecrosis.3 Clinical deterioration may be related to four interacting factors. They are increased adipogenesis related to osteoprogenitor differentiation, reduced angio-genesis, suppressed expression and proliferation of osteogenic genes in bone marrow, and hypercoag-ulable state induced by genetic anomalies or other diseases. Weekly alcohol consumption of more than 400 ml clearly increases the risk of osteonecrosis.12
Alcohol can induce adipogenesis both in vivo and in vitro. Reduced osteogenic properties and increased adipogenesis were detected in cells that were exposed to ethanol. This contributes to the mechanism of osteonecrosis.13 Alcohol downreg-ulates PPAR-γ (Peroxisome proliferator-activated
receptors), a group of nuclear receptor protein that regulates gene expression and has an important role in the regulation of cellular differentiation and metabolism of carbohydrate, lipid, and protein. There is increase of lipid transport and storage because of the synthesis of aP2 (adipocyte P2)and LPL (lipoprotein lipase) related to alcohol-induced changes in synthesis and expression of PPAR genes that can be measured by Nile red staining in mesenchymal cells.14 Another study showed that alcohol consumption increased cortisol secretion that contributed to redistribution of adipose tissue, oxidative stress, and activation of CYP2E1 that caused apocrine dysregulation.15
Osteonecrosis induced by intragastric alcohol in the mouse model has not been able to show the contribution of proinflammatory response through the toll-like receptor 4 (TLR-4) receptor. Reduced adiponectin in alcohol group was consistent with the hypothesis that femoral head osteonecrosis is caused by ischemia in blood vessels of the femoral head.16
Oxidative stress is the pathogenesis of metabolic syndrome and is also strongly related to obesity.17,18 Oxidative stress in adipose tissue influences adipo-kine secretion that reduces the concentration of adiponectin and increases blood free fatty acids. Increased inducible nitric oxide synthase (iNOS) expression in the study showed that osteocyte death as the alternative pathophysiology of alcohol-in-duced osteonecrosis.19
Nitric oxide (NO) is an omnipresent intracellular messenger that modulates blood flow, thrombosis, and neural activity. NO stimulates nearby tissues and interacts with ROS, producing peroxynitrite.
Cytotoxicity of peroxynitrite is mediated by the effect of lipid peroxidase, protein nitration, and oxidation. Mitochondrial enzymes are susceptible to peroxynitrite that can reduce adenosine triphos-phate (ATP) formation, trigger mitochondrial permeability transition, and open the pores of the cell membrane. These processes withdraw electron transport, ATP formation, and will cause mito-chondrial swelling and increased mitomito-chondrial permeability. This will lead to efflux of proapoptotic molecules such as Apoptosis Inducing Factor (AIF) and Cytochrome C.20 Effector activation that trig-gers nucleic DNA fragmentation increases mito-chondrial damage because this process will activate poly-ADP-ribose-polymerase (PARP). Activation of this enzyme consumes nicotinamide adenine nucleotide (NAD) while free PAR will travel to mitochondria and increase the mitochondrial efflux (nuclear to mitochondria cross talk). Like reperfu-sion injury, massive oxidation and nitrosative DNA damage will cause cellular apoptosis.20
Vascular Endothelial Growth Factor (VEGF) is a special mitogen for vascular endothelial. It was initially identified as endothelial growth factor from follicle cells in bovine hypophysis by Ferrara and Davis Symth.21 VEGF-A is a dominant factor in angiogenesis regulation and endothelial growth compared to other isoforms.22 VEGF also promotes chemotaxis of mesenchymal stem cell (MSC). Vasculogenesis and angiogenesis are triggered by the local and systemic increase of VEGF that allows mobilization of osteogenic substrates, stem cell pericyte, and MSC that can differentiate.22 Hypoxia is a potent stimulus of growth factor expression especially VEGF during angiogenesis. Reduced oxygen pressure will stimulate vascular endothelial to produce VEGF that will trigger angiogenesis that is essential form tendon healing and tendon graft remodeling.23
Some studies of osteonecrosis prevention have been conducted. Pitavastatin has anti lipid effect in adipogenesis of rabbits that were injected with 20 mg/kg of methylprednisolone, decreasing the incidence of osteonecrosis.24 Oral vitamin E reduces the incidence of corticosteroid-induced osteonecrosis.25
of osteonecrosis. Therefore, further studies are needed to investigate the optimal level of hydrogen antioxidant that can prevent osteonecrosis.26 The investigation of 0.2% astaxanthin (2g/kg) supple-mentation for visceral adipose and lipid profile in mouses after 6 weeks showed a reduction in visceral adipocyte, reduction in free fatty acid levels, and increased HDL concentration. Astaxanthin can reduce lipid levels and abnormalities.27
Immense femoral head destruction is the reason for high morbidity in late-stage osteonecrosis. The damage cannot be repaired. Therefore, it is essential to prevent osteonecrosis. An antioxidant such as astaxanthin may slow adipogenesis while increas-ing osteogenesis and angiogenesis. However, there is no available data regarding that. This research was conducted to investigate the role astaxanthin in alcohol-induced osteonecrosis.
MATERIAL AND METHODS
The investigation was started in August 2017 and conducted at Pharmacology laboratory, Faculty of Medicine Universitas Udayana, Bali for animal intervention, then at Veterinary Pathology labora-tory, Faculty of Veterinary Medicine, Universitas Udayana for histopathology examination.
The design of the study is an experimental randomized post-test control only group using Male Wistar rats. There were four animals in each experimental group with the total of 24 rats. Sampling was done using simple randomization because of the homogenous study population.Male Wistar rats, aged 10-14 weeks with the weight of 200-250 gram were selected, and has never been exposed to corticosteroid.
Twenty four male Wistar rats aged between 10-14 weeks were divided into six groups. The first three groups were 0.5 ml intraoral 40% alcohol was given for 1 week in P0 group, 2 weeks in P1 group, 3 weeks in P2 group. The second three groups were 0.5 ml intraoral 40% alcohol and 0.106 mg/kg/day of astaxanthin were given for 1 week in P3 group, 2 weeks in P4 group, and 3 weeks in P5 group. Alcohol was provided every morning at 09.00 AM local time. The mice were each put in a 30x20 cm cages with environment temperature of 20-25°C. They were given 12-20 gram of pellet contain-ing protein (20%), fat (5%), carbohydrate (45%), fiber (5%), vitamins, and minerals as the daily diet. Water was given ad libitum. Astaxanthin was given every morning at 09.00-10.00 local time. The weight of each rat was measured weekly. In the last day of the first week, rats in P0 and P3 were euth-anized with 200 mg/kg of intramuscular ketamine. Both proximal femur underwent histopathological
examination while the rest of the body was buried. In the last day of the second week, rats in P1 and P4 were euthanized with 200 mg/kg of intramus-cular ketamine. Both proximal femur underwent histopathological examination while the rest of the body was buried. In the last day of the third week, rats in P2 and P5 were euthanized with 200 mg/kg of intramuscular ketamine. Both proximal femur underwent histopathological examination while the rest of the body was buried.
Histopathological bone specimen processing
Bone samples from euthanized rats were fixated for 1 weeks using 10% formaldehyde-0.1 M phosphate buffer pH 7.4. Then, the samples were decalcified by 25% formic acid for 10 days followed by neutral-ization by 0.35 M sodium sulfate for 1 day. The specimen then was processed using tissue proces-sor, put on paraffin block, cut by microtome into 4µ of thickness, and finally stained using hematoxylin and eosin. The trabecula of the femoral head was examined in order to measure the amount of adipo-cyte, osteoblast, osteocyte and the incidence of osteonecrosis. The trabecula is taken from antero-superior part of lateral femoral head.
Data Analysis
Obtained data were analyzed by descriptive anal-ysis, Normality and Homogeneity test (Normality test using Saphiro Wilks Test and homogene-ity test = Levene’s Test for Equality of Variance), Normal distribution Inferential analysis with One Way ANOVA with Tamhane’s post-hoc analysis for intragroup data and unpaired T-test for intergroup data, and abnormal distribution Inferential analysis with Kruskal-Wallis test with Mann-Whitney post-hoc analysis for intragroup and intergroup data
RESULTS
without astaxanthin and evaluated on day 14. (c) Control group (P2), was given 0.5 cc intraoral 40% alcohol every day without Astaxanthin and evalu-ated on day 21. (d) Experimental group (P3), was given 0.5 cc intraoral 40% alcohol and astaxanthin 0.106 mg/kg/day every day and evaluated on day 7. (e) Experimental group (P4), was given 0.5 cc intra-oral 40% alcohol and astaxanthin 0.106 mg/kg/day every day and evaluated on day 14. (f) Experimental group (P5), was given 0.5 cc intraoral 40% alcohol and astaxanthin 0.106 mg/ kg/day every day and evaluated on day 21.
On the day of evaluation, the animals were terminated in order to take the bone sample from both proximal femur for the measurement of osteoblast, osteocyte, adipocyte, and inci-dence of osteonecrosis. The quantitative data, obtained from microscopy were examined by a histopathologist.
The results were used as the base data for analy-sis using normality test, homogeneity test, compar-ative test, and experimental effect.
Sample analysis
The analysis included descriptive data distribution, number of osteoblast, osteocyte, and adipocyte cells in control and experimental group. The data were analyzed using SPSS for Windows version 23.0.
Descriptive analysis
The aim of descriptive data analysis was to get a clear picture regarding data distribution and standard deviation of each variable.
Table 1 shows that total subjects were 24 that were divided into control and experimental group. The number of subjects in each subgroup was 4 or 16.7%
Table 2 shows the mean difference of each vari-able in week 1. The amount of osteoblast and osteo-cyte was lower in control group (38±1.43) compared to experimental group (55.63±2.17). The amount of adipocyte in control group was higher (58.69±1.18) compared to the experimental group (27.50±1.24). The second and third week measurements showed the reduction of osteoblast and osteocyte in control groups and the increase of osteoblast and osteocyte in the experimental groups.
Adipocyte increase was found in control groups (week 2: 88.75±4.66, 111.63±1.53), while reduc-tion was found in experimental group (week 2: 21.00±1.48, 14.63±0.48).
The incidence of osteonecrosis was indicated by empty lacuna. There was an increasing average of empty lacuna in control group (week 3: 34.56±0.31), while the average was decreasing in the experimen-tal group (week 3: 4.75±0.79).
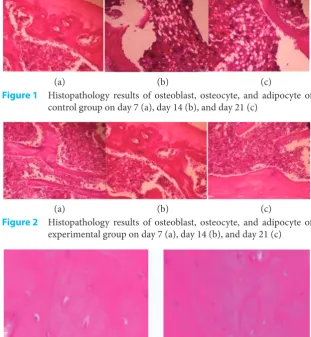
Figure 1 Histopathology results of osteoblast, osteocyte, and adipocyte of control group on day 7 (a), day 14 (b), and day 21 (c)
(a) (b) (c)
Figure 2 Histopathology results of osteoblast, osteocyte, and adipocyte of experimental group on day 7 (a), day 14 (b), and day 21 (c)
(a) (b) (c)
Figure 3 Osteonecrosis showed with (a) osteocyte necrosis and (b) empty lacuna without osteocyte
(a) (b)
Figure 4 Histopathology results of osteonecrosis incidence of control group on day 7 (a), day 14 (b), and day 21 (c)
(a) (b) (c)
Figure 5 Histopathology results of osteonecrosis incidence of experimental group on day 7 (a), day 14 (b), and day 21 (c)
Inferential analysis
The aim of this analysis is to generalize the result into population. The statistical tests used were One Way ANOVA with Bonferroni post-hoc analysis for homogenous data or Tamhane’s post-hoc analysis for inhomogenous data. The tests were interpreted using 95% CI and p < 0.05.
Normality and Homogeneity test
Normality test was conducted on both control and experimental variables. Because the number of subjects was less than 50, Shapiro-Wilk test was used for normality test while Levene’s test was used for homogeneity test. Table 3 shows normal distribution of all variables, as the p >0.05. The test in table 4 showed abnormal data in osteoblast, adipocyte, and empty lacuna (p <0.05), therefore Tamhane post-hoc analysis was used. Osteocyte variable showed normal variance (p > 0.05), so the Bonferroni post-hoc analysis was used.
One-way ANOVA test
Comparative test for the numeric variables was performed using One-way ANOVA for data with normal distribution. Post-test average among groups was compared to find out the effect of each variable.
Table 5 shows significant mean differences between control and experimental groups (p = 0.000). Largest difference was found in adipocyte (p = 0.0000)
Table 6 shows that in each week of compari-son, the experimental groups have higher amount osteoblast compared to control groups (p < 0.05).
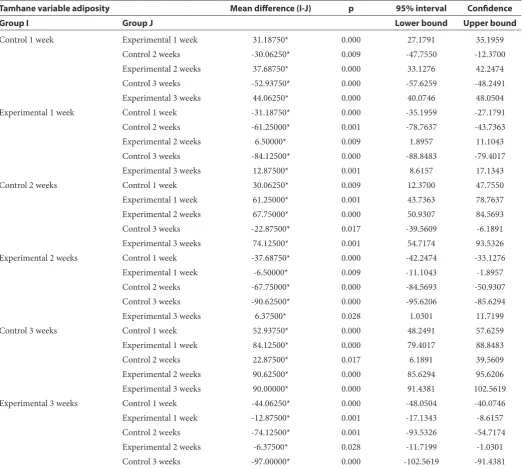
Table 7 shows that the experimental groups have lower amount of adipocyte compared to control groups in each week of comparison (p < 0.05)
Table 8 shows higher amount of osteocyte in experimental groups compared to control groups in each week of comparison (p < 0.05)
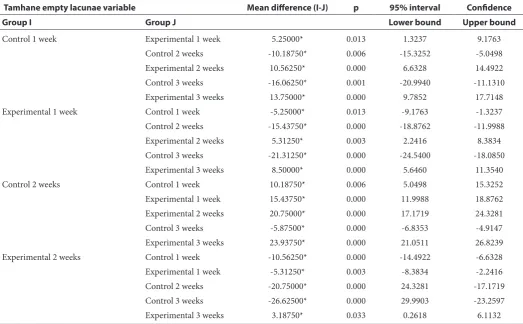
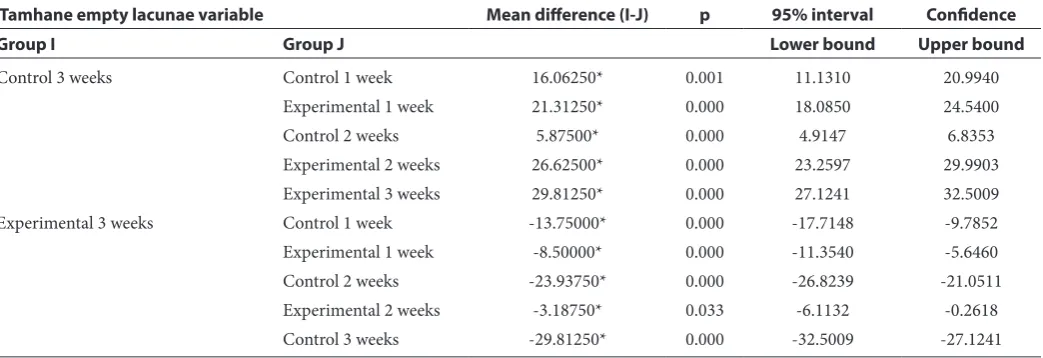
Table 9 shows that the study group treated with 4 mg of astaxanthin, 0.106 mg/kgBW/day dose, had less mean empty lacunae count compared to control group for 3 weeks straight. The mean difference is found to be statistically significant with p<0.05.
Table 1 Frequency distribution of each group
Week 1 Week 2 Week 3
Control 4(16.7%) 4(16.7%) 4(16.7%) 12(50%) Experimental 4(16.7%) 4(16.7%) 4(16.7%) 12(50%) Total 24(100%)
Table 2 Variable average of osteoblast, osteocyte, adipocyte, and osteonecrosis incidence between control and experimental group during research
Variable Average (s,b)Week 1 Average (s,b)Week 2 Average (s,b)Week 3 Osteoblast Control 38 (1.43) 24.69 (0.83) 16.94 (1.28)
Experimental 55.63 (2.17) 68.94 (0.55) 78.94 (0.55) Osteocyte Control 16.69 (0.94) 11.94 (1.65) 7.75 (1.40)
Experimental 28.06 (1.26) 35.88 (1.05) 42 (0.20) Adipocyte Control 58.69 (1.18) 88.75 (4.66) 111.63 (1.53)
Experimental 27.50 (1.24) 21.00 (1.48) 14.63 (0.48) Empty
lacuna ControlExperimental 13.25 (0.91)18.5 (1.29) 28.69 (0.24)7.94 (0.94) 34.56 (0.314.75 (0.79)
Table 3 Normality test of variables using Shapiro-Wilk
Variable Category
Shapiro-Wilk
Statistic Df Sig
Osteoblast Control 1 week 0.973 4 0.861
Experimental 1 week 0.782 4 0.074
Control 2 weeks 0.980 4 0.900
Experimental 2 weeks 0.801 4 0.103
Control 3 weeks 0.930 4 0.594
Experimental 3 weeks 0.801 4 0.103
Osteocyte Control 1 week 0.994 4 0.976
Experimental 1 week 0.997 4 0.989
Control 2 weeks 0.978 4 0.889
Experimental 2 weeks 0.980 4 0.889
Control 3 weeks 0.909 4 0.479
Experimental 3 weeks 0.945 4 0.683
Adipocyte Control 1 week 0.814 4 0.130
Experimental 1 week 0.952 4 0.726
Control 2 weeks 0.972 4 0.855
Experimental 2 weeks 0.998 4 0.995
Control 3 weeks 0.971 4 0.848
Experimental 3 weeks 0.863 4 0.272 Empty lacuna Control 1 week 0.993 4 0.972 Experimental 1 week 0.950 4 0.714
Control 2 weeks 0.863 4 0.272
Experimental 2 weeks 0.994 4 0.976
Control 3 weeks 0.895 4 0.406
Experimental 3 weeks 0.940 4 0.653
Table 4 Homogeneity test of variables using Levene’s test
Table 5 One-wayANOVA test of the control and experimental groups
Sum of squares df Mean square F Sig
Osteoblast sum and average Between groups 12232.156 5 2446.431 1511.958 0.000
Within groups 29.125 18 1.618
Total 12261.281 23
Osteocyte sum and average Between groups 3776.336 5 755.267 544.814 0.000
Within groups 24.953 18 1.386
Total 3801.289 23
Adipocyte sum and average Between groups 31565.076 5 6313.015 1285.138 0.000
Within groups 88.422 18 4.912
Total 31653.497 23
Empty lacuna Between groups 2752.607 5 550.521 791.761 0.000
Within groups 12.516 18 0.695
Total 2765.122 23
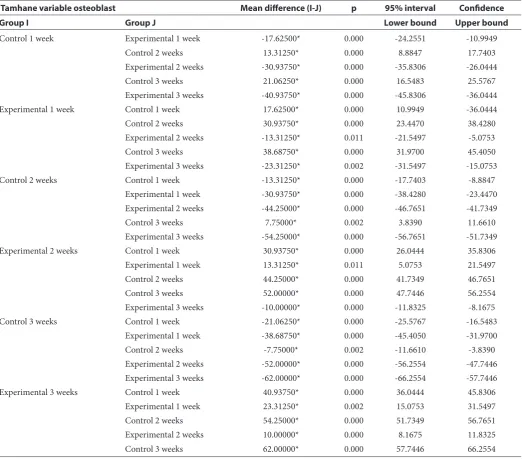
Table 6 Tamhane post-hoc analysis of osteoblast variables of control and experimental groups
Tamhane variable osteoblast Mean difference (I-J) p 95% interval Confidence
Group I Group J Lower bound Upper bound
Control 1 week Experimental 1 week -17.62500* 0.000 -24.2551 -10.9949
Control 2 weeks 13.31250* 0.000 8.8847 17.7403
Experimental 2 weeks -30.93750* 0.000 -35.8306 -26.0444
Control 3 weeks 21.06250* 0.000 16.5483 25.5767
Experimental 3 weeks -40.93750* 0.000 -45.8306 -36.0444
Experimental 1 week Control 1 week 17.62500* 0.000 10.9949 -36.0444
Control 2 weeks 30.93750* 0.000 23.4470 38.4280
Experimental 2 weeks -13.31250* 0.011 -21.5497 -5.0753
Control 3 weeks 38.68750* 0.000 31.9700 45.4050
Experimental 3 weeks -23.31250* 0.002 -31.5497 -15.0753
Control 2 weeks Control 1 week -13.31250* 0.000 -17.7403 -8.8847
Experimental 1 week -30.93750* 0.000 -38.4280 -23.4470 Experimental 2 weeks -44.25000* 0.000 -46.7651 -41.7349
Control 3 weeks 7.75000* 0.002 3.8390 11.6610
Experimental 3 weeks -54.25000* 0.000 -56.7651 -51.7349
Experimental 2 weeks Control 1 week 30.93750* 0.000 26.0444 35.8306
Experimental 1 week 13.31250* 0.011 5.0753 21.5497
Control 2 weeks 44.25000* 0.000 41.7349 46.7651
Control 3 weeks 52.00000* 0.000 47.7446 56.2554
Experimental 3 weeks -10.00000* 0.000 -11.8325 -8.1675
Control 3 weeks Control 1 week -21.06250* 0.000 -25.5767 -16.5483
Experimental 1 week -38.68750* 0.000 -45.4050 -31.9700
Control 2 weeks -7.75000* 0.002 -11.6610 -3.8390
Experimental 2 weeks -52.00000* 0.000 -56.2554 -47.7446 Experimental 3 weeks -62.00000* 0.000 -66.2554 -57.7446
Experimental 3 weeks Control 1 week 40.93750* 0.000 36.0444 45.8306
Experimental 1 week 23.31250* 0.002 15.0753 31.5497
Control 2 weeks 54.25000* 0.000 51.7349 56.7651
Experimental 2 weeks 10.00000* 0.000 8.1675 11.8325
Table 7 Tamhane post-hoc analysis of adipocyte variable in control and experimental groups
Tamhane variable adiposity Mean difference (I-J) p 95% interval Confidence
Group I Group J Lower bound Upper bound
Control 1 week Experimental 1 week 31.18750* 0.000 27.1791 35.1959
Control 2 weeks -30.06250* 0.009 -47.7550 -12.3700
Experimental 2 weeks 37.68750* 0.000 33.1276 42.2474
Control 3 weeks -52.93750* 0.000 -57.6259 -48.2491
Experimental 3 weeks 44.06250* 0.000 40.0746 48.0504 Experimental 1 week Control 1 week -31.18750* 0.000 -35.1959 -27.1791
Control 2 weeks -61.25000* 0.001 -78.7637 -43.7363
Experimental 2 weeks 6.50000* 0.009 1.8957 11.1043
Control 3 weeks -84.12500* 0.000 -88.8483 -79.4017
Experimental 3 weeks 12.87500* 0.001 8.6157 17.1343
Control 2 weeks Control 1 week 30.06250* 0.009 12.3700 47.7550
Experimental 1 week 61.25000* 0.001 43.7363 78.7637
Experimental 2 weeks 67.75000* 0.000 50.9307 84.5693
Control 3 weeks -22.87500* 0.017 -39.5609 -6.1891
Experimental 3 weeks 74.12500* 0.001 54.7174 93.5326 Experimental 2 weeks Control 1 week -37.68750* 0.000 -42.2474 -33.1276 Experimental 1 week -6.50000* 0.009 -11.1043 -1.8957
Control 2 weeks -67.75000* 0.000 -84.5693 -50.9307
Control 3 weeks -90.62500* 0.000 -95.6206 -85.6294
Experimental 3 weeks 6.37500* 0.028 1.0301 11.7199
Control 3 weeks Control 1 week 52.93750* 0.000 48.2491 57.6259
Experimental 1 week 84.12500* 0.000 79.4017 88.8483
Control 2 weeks 22.87500* 0.017 6.1891 39.5609
Experimental 2 weeks 90.62500* 0.000 85.6294 95.6206 Experimental 3 weeks 90.00000* 0.000 91.4381 102.5619 Experimental 3 weeks Control 1 week -44.06250* 0.000 -48.0504 -40.0746 Experimental 1 week -12.87500* 0.001 -17.1343 -8.6157
Control 2 weeks -74.12500* 0.001 -93.5326 -54.7174
Experimental 2 weeks -6.37500* 0.028 -11.7199 -1.0301
Control 3 weeks -97.00000* 0.000 -102.5619 -91.4381
Table 8 Bonferroni post-hoc analysis of osteocyte variable in control and experimental groups
Bonferroni variable osteocyte Mean difference (I-J) p 95% interval Confidence
Group I Group J Lower bound Upper bound
Control 1weeks Experimental 1 weeks -11.37500* 0.000 -14.1893 -8.5607
Control 2 weeks 4.75000* 0.000 1.9357 7.5643
Experimental 2 weeks -19.18750* 0.000 -22.0018 -16.3732
Control 3 weeks 8.93750* 0.000 6.1232 11.7518
Experimental 3 weeks -25.31250* 0.000 -28.1268 -22.4982
Experimental 1 weeks Control 1 weeks 11.37500* 0.000 8.5607 14.1893
Control 2 weeks 16.12500* 0.000 13.3107 18.9393
Experimental 2 weeks -7.81250* 0.000 -10.6268 -4.9982
Control 3 weeks 20.31250* 0.000 17.4982 23.1268
Table 8 Continues
Bonferroni variable osteocyte Mean difference (I-J) p 95% interval Confidence
Group I Group J Lower bound Upper bound
Control 2 weeks Control 1 weeks -4.75000* 0.000 -7.5643 -1.9357
Experimental 1 weeks -16.12500* 0.000 -18.9393 -13.3107 Experimental 2 weeks -23.93750* 0.000 -26.7518 -21.1232
Control 3 weeks 4.18750* 0.001 1.3732 7.0018
Experimental 3 weeks -30.06250* 0.000 -32.8768 -27.2482
Experimental 2 weeks Control 1 weeks 19.18750* 0.000 16.3732 22.0018
Experimental 1 weeks 7.81250* 0.000 4.9982 10.6268
Control 2 weeks 23.93750* 0.000 21.1232 26.7518
Control 3 weeks 28.12500* 0.000 25.3107 30.9393
Experimental 3 weeks -6.12500* 0.000 8.9393 -3.3107
Control 3 weeks Control 1 weeks -8.93750* 0.000 -11.7518 -6.1232
Experimental 1 weeks -20.31250* 0.000 -23.1268 -17.4982
Control 2 weeks -4.18750* 0.001 -7.0018 -1.3732
Experimental 2 weeks -28.12500* 0.000 -30.9393 -25.3107 Experimental 3 weeks -34.25000* 0.000 -37.0643 -31.4357
Experimental 3 weeks Control 1 weeks 25.31250* 0.000 22.4982 28.1268
Experimental 1 weeks 13.93750* 0.000 11.1232 16.7518
Control 2 weeks 30.06250* 0.000 27.2482 32.8768
Experimental 2 weeks 6.12500* 0.000 3.3107 8.9393
Control 3 weeks 34.25000* 0.000 31.4357 37.0643
Table 9 Tamhanepost-hoc analysis of empty lacunae variable for control group and treatment group
Tamhane empty lacunae variable Mean difference (I-J) p 95% interval Confidence
Group I Group J Lower bound Upper bound
Control 1 week Experimental 1 week 5.25000* 0.013 1.3237 9.1763
Control 2 weeks -10.18750* 0.006 -15.3252 -5.0498 Experimental 2 weeks 10.56250* 0.000 6.6328 14.4922 Control 3 weeks -16.06250* 0.001 -20.9940 -11.1310 Experimental 3 weeks 13.75000* 0.000 9.7852 17.7148
Experimental 1 week Control 1 week -5.25000* 0.013 -9.1763 -1.3237
Control 2 weeks -15.43750* 0.000 -18.8762 -11.9988 Experimental 2 weeks 5.31250* 0.003 2.2416 8.3834 Control 3 weeks -21.31250* 0.000 -24.5400 -18.0850 Experimental 3 weeks 8.50000* 0.000 5.6460 11.3540
Control 2 weeks Control 1 week 10.18750* 0.006 5.0498 15.3252
Experimental 1 week 15.43750* 0.000 11.9988 18.8762 Experimental 2 weeks 20.75000* 0.000 17.1719 24.3281
Control 3 weeks -5.87500* 0.000 -6.8353 -4.9147
DISCUSSION
The interpretation results of the statistically analyzed study data correspond to the hypothesis. The interpretation will be discussed to ascertain the factors that influence the result of this study.
Study Subjects
This study used mice as subject to determine the effect of astaxanthin on the number of osteocytes, osteoblasts, and adipocytes in femoral head osteo-necrosis which is induced by alcohol. Mice were chosen due to its availability, low maintenance cost, and its small size. Aside from that, mice can breed quickly and which is rather advantageous in secur-ing more subjects that match the inclusion criteria. Specifically, another advantage is the size of mice’s bone that made it easier to the study. The difference in sex affects the incidence of osteonecrosis. Male mice were chosen as study subject so as to avoid effects of estrogen on osteonecrosis. A study shows that estrogen has an influence on the incidence of osteonecrosis by increasing the risk of thrombo-sis due to coagulation process.15 In regard to the previously mentioned advantages, male mice were chosen as this study’s subject.
Astaxanthin’s Effect on Osteocytes
From this study, it was found that the number of osteocytes was higher in mice treated using 4 mg of astaxanthin with dosage 0.106 mg/kgBW/day for 3 weeks straight. The difference was also proven to be significant when compared to control group without astaxanthin treatment with p=0.000.
Post-hoc test performed in this study showed significant difference on osteocyte count after 3 weeks of astaxanthin treatment. The average count of osteocytes kept increasing during the second and third week of treatment, which was also proven to be statistically significant with the value of p<0.05.
This result is attributed to the antioxidant effect of astaxanthin which is 10 times higher than other carot-enoids, such as lutein, lycopene, alpha-tocopherol, alpha-carotene, and beta-carotene.28,29 Astaxanthin can prevent the creation of free radicals such as cata-lase, SOD, and hydrogen peroxide that hinder the release of inflammatory mediators, such as TNF-a, IL-1b, IL-6 and IL-10, which in turn will result in the inhibition of iNOS stimulation and nitric oxide (NO) production.30 Increase in iNOS expression, that is observed in osteonecrosis group, may be the reason for high NO production. This high produc-tion is marked by apoptosis of osteoblast, osteocyte, and marrow cell.31 Thus, alongside the decrease of NO level, the lowering of osteocyte and osteoblast level can be achieved.
Effect of NO in reducing VEGF induced by hypoxic condition trough cGMP mechanism indicates NO as endogen inhibitor of hypoxic and non-hypoxic expression of VEGF in vivo.31 The statement is in line to another study regarding angiogenic growth factor which showed that local administration of VEGF will increase defect heal-ing in bone.32 Neovascularization that occurs will help the transport of inflammatory cells, fibroblasts, and growth factors to the injury site.33 Yang et al. in 2014, shows that implantation of co-transfected bFGF and collagen gene on a necrotic femoral head in animal subject results in angiogenesis repair on bone tissue.
Astaxanthin can also increase the number of osteocytes through inhibiting AMPK, increasing PPAR g, and reducing leptin, which indirectly result in formation of osteocytes from preosteo-blast.34 New research displays the Wnt signaling pathway which is involved in regulation of bone mass homeostasis. This pathway is also regulated by alcohol-induced ROS formation. Astaxanthin treatment will indirectly regulate Wnt signal-ing in osteocyte and osteoblast homeostasis.
Table 9 Continues
Tamhane empty lacunae variable Mean difference (I-J) p 95% interval Confidence
Group I Group J Lower bound Upper bound
Control 3 weeks Control 1 week 16.06250* 0.001 11.1310 20.9940
Experimental 1 week 21.31250* 0.000 18.0850 24.5400
Control 2 weeks 5.87500* 0.000 4.9147 6.8353
Nuclearβ-catenin act as transcription coactivator that interacts with the transcription factor of T-cell factor (Tcf)/Lymphoid enhancer factor (Lef) family to regulate gene expression. LRP5 removal in mice results in osteopenia, whereas over-expression of LRP5 will increase bone mass and reduce osteoblast apoptosis35
Astaxanthin’s Effect on Osteoblasts
In this study, it was found that the number of osteo-blast on mice treated using 4 mg of astaxanthin with a dose of 0.106 mg/kgBW/day for 3 weeks straight. The difference in cell number compared to the control group without astaxanthin treatment was proven statistically significant with p=0.000.
Post-hoc test on this study resulted in significant difference in osteoblast count after treatment using astaxanthin for 3 weeks. The mean osteoblast count kept increasing on second and third week and has been proven to be statistically significant with p<0.05.
This finding is parallel to other study regarding effects of alcohol on bone, which shows that the decrease in osteoblast count and function correlates to increase in osteoclast number and cause increase in bone reabsorption.36 Aside from that, expo-sure to alcohol results in osteogenesis marker suppression in MSC during osteoblast formation.14 Antioxidant effect of astaxthin also exerts influence on osteoblast production and biological pathway which is used by osteocytes.28,29,34 Aside from that, astaxanthin can also prevent the forming of free radicals, such as SOD and hydrogen peroxide, and inhibit the release of inflammatory mediators that will lower NO production. Higher NO production will inhibit proliferation of osteoblast and osteo-cytes.30 Suppression of AMPK, increase in PPAR g, degradation of leptin, increase in VEGF through PI3K pathway alongside expression of HIF-1 alpha, and regulation of Wnt signaling happen through the same process as osteocyte.32,33,35
Astaxanthin’s Effect on Adipocyte Cells This study found that the number of adipocytes was lower in mice treated using 4 mg of astaxanthin with dosage 0.106 mg/kgBW/day for 3 weeks. The difference was also proven to be significant when compared to control group without astaxanthin treatment with p=0.000.
Post-hoc test performed in this study showed significant difference on adipocyte count after 3 weeks of astaxanthin treatment, which was proven to be statistically significant with value of p<0.05.
Antilipid drugs, for example Pitavastatin has an effect to inhibit adipogenesis.24 Similarly, oral vita-min E also reduces adipocyte count die to cortico-steroid.25 Supplement effect of astaxanthin result in
smaller visceral adipocyte size with decline in free fatty acid level and rise in HDL concentration. This result highlighted the function of astaxanthine to lower fat level and fat abnormality.27
The result of this research fall in line with the role of astaxanthin in the induction of PPAR g target gene which will modulate PPAR g and finally increase the level of aP2 and lipoprotein lipase.37 Astaxanthin also increase osteogenic differenti-ation potential and adipogenic stem cell. These stem cells also show alarming calcium deposit. The result was consistent to the overexpression of genes that are connected to osteogenesis (osteo-nectin, RXR, and osteopontine) and genes that are involved in adipogenesis (AP and PPAD g) after treatment using Astaxantin.38 This process will decrease adipocyte count through inhibition of adipogenesis.
Astaxanthin’s Effects on the Occurrence of Osteonecrosis
The incidence of osteonecrosis in this study was determined by the presence of empty lacunae. The mean total of empty lacunae occurred in control group during the third week (34.56±0.31). On the other side, the mean total of empty lacunae in treat-ment group during the third week was the lowest amount (4.75±0.79).
In this study, it was found that the mean number of empty lacunae on mice treated using 4 mg of astaxanthin with dose of 0.106 mg/kgBW/day for 3 weeks straight. The difference compared to the control group without astaxanthin treatment was proven statistically significant with p=0.000.
Post-hoc test on this study resulted in significant difference in mean total of empty lacunae count after treatment using astaxanthin for 3 weeks. This has been proven to be statistically significant with p<0.05.
area. Those mechanism explained the collapse of femoral head.
Statin has an anti-lipid effect on adipogenesis and can reduce the incidence of osteonecrosis.24 Oral vitamin E can also reduce the incidence of corticosteroid induced osteonecrosis.25 Astaxanthin which is an oxidized carotenoid works as modula-tor of PPAR g that effectively increase mRNA levels of aP2, lipoprotein lipase, and leptin in order to regulate and hinder adipogenesis.37 It will in turn reduces the number of adipocytes and prevent formation of fat embolism that may damage the blood vessel. Damage in blood vessel may cause hypoxemia injury that may lead to osteonecrosis.
Antioxidant from astaxanthin also influence osteoblast and osteocyte.28,29,34 Astaxanthin can also prevent formation of free radicals, such as catalase, SOD, and hydrogen peroxide, and also inhibit the release of inflammatory mediators that may suppress NO production. High NO production hinders proliferation of osteoblast and osteocyte.30 Aside from that, astaxanthin suppress AMPK, increases PPAR g, reduces leptin, increases VEGF through PI3K pathway with expression of HIF-1 alpha and regulation of Wnt signaling pathway that ends up increasing the amount of osteocyte and osteoblast.32,33,35
In accordance to previous statements, astax-anthin has strong potential as antilipid, immu-nomodulator, and antioxidant that suppress oxidative stress as the pathogenesis for alcohol-in-duced osteonecrosis. With decrease of adipogenesis and increase in osteogenesis and angiogenesis, then the incidence of alcohol exposure osteonecrosis will be decreased.
CONCLUSION
According to the study result of astaxanthin treat-ment on mice, it can be concluded that adminis-tration of astaxanthin results in increased osteocyte and osteoblast count in alcohol-exposed mice with femoral head osteonecrosis compared to those with-out astaxanthin administration. Administration of astaxanthin results in reduced adipocyte count incidence of osteonecrosis in the femoral head of alcohol-exposed mice with femoral head osteo-necrosis compared to those without astaxanthin administration.
RECOMMENDATION
Astaxanthin can be used as a natural ingredient in prevention of the femoral head osteonecrosis. However, researches using non-animal samples or larger amount of samples are still needed to achieve clinical effect, especially on human.
ACKNOWLEDGMENTS
We acknowledge staff of the veterinary pathology laboratory, Veterinary Faculty, Udayana University, for their support during the research process
DISCLOSURE
The author reports no conflicts of interest in this work.
REFERENCES
1. Nagayam, S. Osteonecrosis and related disorders. In L. Solomon, D.Warwick, & S. Nagayam (Eds.), Apley’s System of Orthopaedics and Fractures, Ninth edition. CRC Press. 2010;103-116.
2. Moya-Angeler, J., Gianakos, A. L., Villa, J. C., Ni, A., & Lane, J. M. Current concepts on osteonecrosis of the femoral head. World J Orthop. 2015;6(8):590-601. 3. Cui, Q., Wang, G. J., & Balian, G. Steroid-induced
adi-pogenesis in a pluripotential cell line from bone marrow. J Bone Joint Surg Am. 2007;79(7):1054-1063.
4. Ichiseki, T., Matsumoto, T., Nishino, M., Kaneuji, A., & Katsuda, S. Oxidative stress and vascular permeability in steroid-induced osteonecrosis model. J Orthop Sci. 2004;9(5):509-515.
5. Jones, J. P., Jr. Intravascular coagulation and osteonecrosis. Clin Orthop Relat Res. 1992;277:41-53.
6. Fisher, D. E. The role of fat embolism in the etiology of cor-ticosteroid-induced avascular necrosis: clinical and experi-mental results. Clin Orthop Relat Res. 1978;130:68-80. 7. Ureten, K., Ozturk, M. A., Bostanci, A., Ceneli, O.,
Ozbek, M., & Haznedaroglu, I.C. Atraumatic osteonecrosis after estrogen replacement therapy associated with low protein S level in a patient with Turner syndrome. Clin Appl Thromb Hemost. 2010;16(5):599-601.
8. Hernigou, P., Bernaudin, F., Reinert, P., Kuentz, M., & Vernant, J. P. Bone- marrow transplantation in sickle-cell disease. Effect on osteonecrosis: a case report with a four-year follow-up. J Bone Joint Surg Am. 1997;79(11):1726-1730.
9. WHO. Global status report on alcohol and health 2014: World Health Organization. 2014.
10. Tsai,S.W., Wu,P.K., Chen,C.F., Chiang,C.C., Huang,C.K., Chen,T.H., . . .Chen,W.M.. Etiologies and outcome of osteonecrosis of the femoral head: Etiology and out-come study in a Taiwan population. J Chin Med Assoc. 2016;79(1):39-45.
11. Fukushima, W., Fujioka, M., Kubo, T., Tamakoshi, A., Nagai, M., & Hirota, Y. Nationwide epidemiologic sur-vey of idiopathic osteonecrosis of the femoral head. Clin Orthop Relat Res. 2010;468(10):2715-2724.
12. Seamon, J., Keller, T., Saleh, J., & Cui, Q. The pathogenesis of nontraumatic osteonecrosis. Arthritis. 2012:601763. 13. Wang, Y., Li, Y., Mao, K., Li, J., Cui, Q., & Wang, G. J.
Alcohol-induced adipogenesis in bone and marrow: a pos-sible mechanism for osteonecrosis. Clin Orthop Relat Res. 2003;410:213-224.
14. Wezeman, F. H., & Gong, Z. Adipogenic effect of alcohol on human bone marrow-derived mesenchymal stem cells. Alcohol Clin Exp Res. 2004;28(7):1091-1101.
15. Kema, V. H., Mojerla, N. R., Khan, I., & Mandal, P. Effect of alcohol on adipose tissue: a review on ethanol mediated adipose tissue injury. Adipocyte. 2015;4(4):225-231. 16. Okazaki, S., Nagoya, S., Tateda, K., Katada, R., Mizuo, K.,
Watanabe, S., . . . Matsumoto, H. Experimental rat model for alcohol-induced osteonecrosis of the femoral head. Int J Exp Pathol. 2013;94(5):312-319.
18. Keaney, J. F., Jr., Larson, M. G., Vasan, R. S., Wilson, P. W., Lipinska, I., Corey, D., . . . Framingham, S. Obesity and sys-temic oxidative stress: clinical correlates of oxidative stress in the Framingham Study. Arterioscler Thromb Vasc Biol. 2003;23(3):434-439.
19. Wang, J., Kalhor, A., Lu, S., Crawford, R., Ni, J.-D., & Xiao, Y. iNOS expression and osteocyte apoptosis in idio-pathic, non-traumatic osteonecrosis. Acta Orthopaedica. 2015;86(1):134-141.
20. Pacher, P., Beckman, J. S., & Liaudet, L. Nitric oxide and peroxynitrite in health and disease. Physiol Rev. 2007;87(1):315-424.
21. Yang, Y.-Q., Tan, Y.-Y., Wong, R., Wenden, A., Zhang, L.-K., & Rabie, A. B. M. The role of vascular endo-thelial growth factor in ossification. International journal of oral science. 2012;4(2):64.
22. Beamer, B., Hettrich, C., & Lane, J. Vascular endothelial growth factor: an essential component of angiogenesis and fracture healing. HSS journal. 2010;6(1):85-94.
23. Krock, B. L., Skuli, N., & Simon, M. C. Hypoxia-Induced Angiogenesis: Good and Evil. Genes & Cancer. 2011;2(12):1117-1133.
24. Nishida, K., Yamamoto, T., Motomura, G., Jingushi, S., & Iwamoto, Y. Pitavastatin may Reduce Risk of Steroid-induced Osteonecrosis in Rabbits: A Preliminary Histological Study. Clinical Orthopaedics and Related Research. 2008;466(5):1054-1058.
25. Kuribayashi, M., Fujioka, M., Takahashi, K. A., Arai, Y., Ishida, M., Goto, T., & Kubo, T. Vitamin E prevents ste-roid-induced osteonecrosis in rabbits. Acta Orthop. 2010;81(1):154-160.
26. Li, J., Ge, Z., Fan, L., & Wang, K. Protective effects of molecular hydrogen on steroid-induced osteonecrosis in rabbits via reducing oxidative stress and apoptosis. BMC Musculoskelet Disord. 2017;18(1):58.
27. Kimura, M., Iida, M., Yamauchi, H., Suzuki, M., Shibasaki, T., Saito, Y., & Saito, H. Astaxanthin supplemen-tation effects on adipocyte size and lipid profile in OLETF rats with hyperphagia and visceral fat accumulation. Journal of Functional Foods. 2014;11:114-120.
28. Ambati, R. R., Phang, S.-M., Ravi, S., & Aswathanarayana, R. G. Astaxanthin: sources, extraction, stability, biological activities and its commercial applica-tions—a review. Marine drugs. 2014;12(1):128-152. 29. Yamashita, E. Astaxanthin as a medical food. Functional
Foods in Health and Disease. 2013;3(7):254-258.
30. Chew, B., Park, J., Chyun, J., Mahoney, M., & Line, L. Astaxanthin stimulates immune response in humans in a
double blind study. Paper presented at the Supply Side West International Trade Show and Conference. 2003.
31. Ghiso, N., Rohan, R. M., Amano, S., Garland, R., & Adamis, A. P. Suppression of hypoxia-associated vascular endothelial growth factor gene expression by nitric oxide via cGMP. Invest Ophthalmol Vis Sci. 1999;40(6):1033-1039. 32. Wernike, E., Montjovent, M.-O., Liu, Y., Wismeijer, D.,
Hunziker, E. B., Siebenrock, K.-A., . . . Klenke, F. M. VEGF incorporated into calcium phosphate ceramics promotes vascularisation and bone formation in vivo. Eur Cell Mater. 2010;19(3).
33. Yoshikawa, T., Tohyama, H., Katsura, T., Kondo, E., Kotani, Y., Matsumoto, H., . . . Yasuda, K. Effects of local administration of vascular endothelial growth factor on mechanical characteristics of the semitendinosus ten-don graft after anterior cruciate ligament reconstruc-tion in sheep. The American journal of sports medicine. 2006;34(12):1918-1925.
34. Guerin, M., Huntley, M. E., & Olaizola, M. Haematococcus astaxanthin: applications for human health and nutrition. TRENDS in Biotechnology. 2003;21(5):210-216.
35. Yeh, C.-H., Chang, J.-K., Wang, Y.-H., Ho, M.-L., & Wang, G.-J. Ethanol may suppress wnt/β-catenin signaling on human bone marrow stroma cells. Clinical Orthopaedics and Related Research. 2008;466(5):1047-1053.
36. Dyer, S. A., Buckendahl, P., & Sampson, H. W. Alcohol consumption inhibits osteoblastic cell proliferation and activity in vivo. Alcohol. 1998;16(4):337-341.
37. Inoue, M., Tanabe, H., Matsumoto, A., Takagi, M., Umegaki, K., Amagaya, S., & Takahashi, J. Astaxanthin functions differently as a selective peroxisome prolifera-tor-activated receptor γ modulator in adipocytes and mac-rophages. Biochemical Pharmacology. 2012;84(5):692-700. 38. Kim, J. H., Nam, S.-W., Kim, B. W., Kim, W.-J., &
Choi, Y. H. (2010). Astaxanthin improves the proliferative capacity as well as the osteogenic and adipogenic differen-tiation potential in neural stem cells. Food and Chemical Toxicology. 2010;48(6)1741-1745