Volume 11, Number 2, pp. 205–220.
http://www.scpe.org
c
2010 SCPE
LARGE SCALE PROBLEM SOLVING USING AUTOMATIC CODE GENERATION AND
DISTRIBUTED VISUALIZATION
ANDREI HUTANU†, ERIK SCHNETTER†‡, WERNER BENGER†, ELOISA BENTIVEGNA†, ALEX CLARY†§, PETER
DIENER†‡, JINGHUA GE†, ROBERT KOOIMA†¶, OLEG KOROBKIN†‡, KEXI LIU†¶, FRANK L ¨OFFLER†, RAVI
PARUCHURI†, JIAN TAO†, CORNELIUS TOOLE†¶, ADAM YATES†, AND GABRIELLE ALLEN†¶
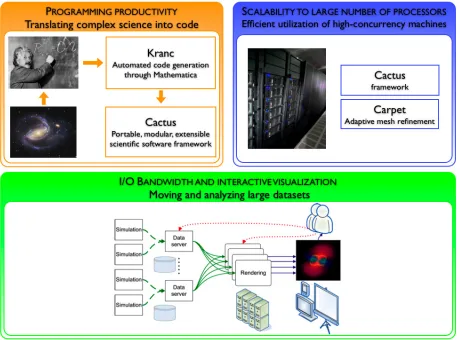
Abstract. Scientific computation faces multiple scalability challenges in trying to take advantage of the latest generation compute, network and graphics hardware. We present a comprehensive approach to solving four important scalability challenges: programming productivity, scalability to large numbers of processors, I/O bandwidth, and interactive visualization of large data. We describe a scenario where our integrated system is applied in the field of numerical relativity. A solver for the governing Einstein equations is generated and executed on a large computational cluster; the simulation output is distributed onto a distributed data server, and finally visualized using distributed visualization methods and high-speed networks. A demonstration of this system was awarded first place in the IEEE SCALE 2009 Challenge.
Key words: computer algebra systems, high performance computing, distributed systems, high speed networks, problem solving environment, scientific visualization, data intensive applications
1. Introduction.
We describe the motivation, design, and experimental experiences of an end-to-end
system for large scale, interactive and collaborative numerical simulation and visualization that addresses a set
of fundamental scalability challenges for real world applications. This system was awarded first place in the
IEEE SCALE 2009 Challenge in Shanghai, China in May 2009.
Our system shows a single end-to-end application capable of scaling to a large number of processors and
whose output can be visualized remotely by taking advantage of high speed networking capabilities and of
GPU-based parallel graphics processing resources. The four scalability challenges that are addressed are described
below (see Figure 1.1).
1.1. Programming productivity.
Programming productivity has long been a concern in the
compu-tational science community: the ever-growing complexity of many scientific codes make the development and
maintenance of many large scale scientific applications an intimidating task. Things get even worse when one is
dealing with extremely complicated systems such as the Einstein equations which, when discretized, typically
result in over 20 evolved variables and thousands of source terms. In addressing these issues, we present our
latest work on generic methods for generating code that solves a set of coupled nonlinear partial differential
equations using the
Kranc
code generation package [1]. Our work greatly benefits from the modular design of
the
Cactus
framework [2, 3], which frees domain experts from lower level programming issues, i. e., parallelism,
I/O, memory management, et cetera. In this collaborative problem-solving environment based on
Cactus
and
Kranc
, application developers, either software engineers or domain experts, can contribute to a code with their
expertise, thus enhancing the overall programming productivity.
1.2. Scalability to large number of processors.
With the advent of Roadrunner, the first
supercom-puter that broke the petaflop/s mark in year 2008, the petaflop era was officially entered. There are a great
number of challenges to overcome in order to fully leverage this enormous computational power to be able
to solve previously unattainable scientific problems. The most urgent of all is the design and development of
highly scalable and efficient scientific applications. However, the ever-growing complexity in developing such
efficient parallel software always leaves a gap for many application developers to cross. We need a bridge,
a computational infrastructure, which does not only hide the hardware complexity, but also provides a user
friendly interface for scientific application developers to speed up scientific discoveries. In our project, we used
a highly efficient computational infrastructure that is based on the
Cactus
framework and the
Carpet
AMR
library [4, 5, 6].
1.3. I/O bandwidth.
We are faced with difficult challenges in moving data when dealing with large
datasets, challenges that arise from I/O architecture, network protocols and hardware resources: I/O
archi-†Center for Computation & Technology, Louisiana State University, Baton Rouge, LA 70803, USA ‡Department of Physics & Astronomy, Louisiana State University, Baton Rouge LA 70803, USA
§Department of Electrical & Computer Engineering, Louisiana State University, Baton Rouge LA 70803, USA ¶Department of Computer Science, Louisiana State University, Baton Rouge, LA 70803, USA
Fig. 1.1.Scalability challenges involved in an end-to-end system for large scale, interactive numerical simulation and visual-ization for black hole modeling.
tectures that do not use a non-blocking approach are fundamentally limiting the I/O performance; standard
network protocols such as TCP cannot utilize the bandwidth available in emerging optical networks and cannot
be used efficiently on wide-area networks; single disks or workstations are not able to saturate high-capacity
network links. We propose a system that combines an efficient pipeline-based architecture, takes advantage of
non-standard high-speed data transport protocols such as UDT, and uses distributed grid resources to increase
the I/O throughput.
1.4. Interactive visualization of large data.
Bringing efficient visualization and data analysis power
to the end users’ desktop while visualizing large data and maintain interactiveness, by giving the user the ability
to control and steer the visualization, is a major challenge for visualization applications today. We are looking
at the case where sufficiently powerful visualization resources are not available at either the location where the
data was generated or at the location where the user is visualizing it, and propose using visualization clusters
in the network to interactively visualize large amounts of data.
2. Scientific Motivation: Black Holes and Gamma-Ray Bursts.
Over ninety years after Einstein
first proposed his theory of General Relativity, astrophysicists are increasingly interested in studying the regions
of the universe where gravity is very strong and the curvature of spacetime is large.
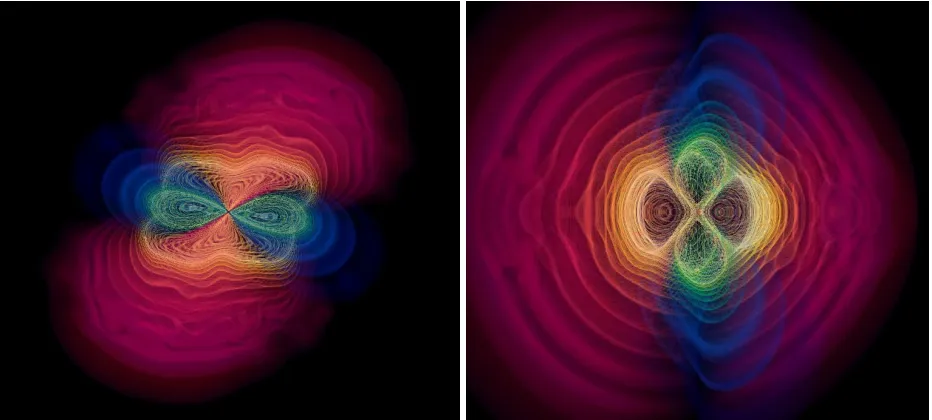
Fig. 2.1.Volume rendering of the gravitational radiation during a binary black hole merger
thanks to a wealth of indirect evidence [7, 8]; furthermore, gravitational wave detectors (LIGO [9], GEO [10],
VIRGO [11]) will soon reach sufficient sensitivities to observe interesting astrophysical phenomena.
In order to correctly interpret the gravitational-wave astronomy data, astrophysicists must rely on
compu-tationally challenging large-scale numerical simulations to study the details of the energetic processes occurring
in regions of strong curvature. Such astrophysical systems and phenomena include the birth of neutron stars or
black holes in collapsing evolved massive stars, the coalescence of compact binary systems, Gamma-Ray Bursts
(GRBs), active galactic nuclei harboring supermassive black holes, pulsars, and oscillating neutron stars.
Of these, Gamma-Ray Bursts (GRBs) [12] are among the most scientifically interesting. GRBs are intense,
narrowly-beamed flashes of
γ-rays originating at cosmological distances, and the riddle concerning their central
engines and emission mechanisms is one of the most complex and challenging problems of astrophysics today.
The physics necessary in such a model includes General Relativity, relativistic magneto-hydrodynamics,
nu-clear physics (describing nunu-clear reactions and the equation of state of dense matter), neutrino physics (weak
interactions), and neutrino and photon radiation transport. The complexity of the GRB central engine requires
a multi-physics, multi-length-scale approach that cannot be fully realized on present-day computers and will
require petascale computing [13, 14].
At LSU we are performing simulations of general relativistic systems in the context of a decade-long research
program in numerical relativity. One pillar of this work is focused particularly on 3D black hole physics
and binary black hole inspiral and merger simulations. This includes the development of the necessary tools
and techniques to carry these out, such as mesh refinement and multi-block methods, higher order numerical
schemes, and formulations of the Einstein equations. A second pillar of the group’s research is focused on
general relativistic hydrodynamics simulations, building upon results and progress achieved with black hole
system. Such simulations are crucial for detecting and interpreting signals soon expected to be recorded from
ground-based laser interferometric detectors.
The specific application scenario for the work presented at the SCALE 2009 competition is the numerical
modeling of the gravitational waves produced by the inspiral and merger of binary black hole systems (see
Figure 2.1).
2.1. Use-case Scenario.
The motivating and futuristic scenario for this work is based on enabling
scien-tific investigation using complex application codes on very large scale compute resources:
coordi-nated by the Cactus Framework, require the use of tens of thousands of cores of modern supercomputers
and take several days to complete.
•
The scientists use the Kranc code generation package to automatically generate a suite of codes using
the different algorithms that they wish to compare. Kranc writes these codes taking advantage of
appropriate optimization strategies for the architectures on which they will be deployed, for example
using GPU accelerators where available, or matching grid loops to the available cache size.
•
The simulations are deployed on multiple supercomputers available to the collaboration, using
co-scheduling services across different institutions to coordinate the simultaneous reservation of resources,
networks, and displays. Web services are used to enable the real-time, highly configurable, collaboration
of the scientists, with the simulations autonomously publishing appropriate information to services such
as Twitter and Flickr.
•
As the simulations run, output data is directly streamed across high speed networks to powerful
GPU rendering clusters which produce the visualizations, and in turn stream their video outputs to
large high resolution displays located at the collaborating sites. The displays aggregate the video
outputs from each of the different simulations, allowing the scientists to visualize and compare the
same output, while simultaneously interacting with and steering the visualization using tangible
de-vices.
The scientists are thus able to use the most powerful computational resources to run the simulation and the
most powerful visualization resources available to interactively visualize the data and are not limited by either
their local visualization resources, or the visualization resources available at the location where the simulation
is being run.
3. Automatic Parallel Code Generation.
3.1. Cactus–Carpet Computational Infrastructure.
Cactus
[2, 3] is an open source software
frame-work consisting of a central core, the
flesh
, which connects many software components (
thorns
) through an
extensible interface.
Carpet
[4, 5, 6] serves as a driver layer of the
Cactus
framework providing adaptive mesh
refinement, multi-patch capability, as well as memory management, parallelism, and efficient I/O. In the
Cactus–Carpet
computational infrastructure, the simulation domain is discretized using high order finite
dif-ferences on block-structured grids, employing a Berger-Oliger-style adaptive mesh refinement method [15] with
sub-cycling in time, which provides both efficiency and flexibility. We use explicit Runge-Kutta methods for
time integration.
Cactus
is highly portable and runs on all current HPC platforms as well as on workstations and laptops on all
major operating systems. Codes written using
Cactus
have been run on various brands of the fastest computers
in the world, such as various Intel and AMD based systems, SGI Altix, the Japanese Earth Simulator, IBM
Blue Gene, Cray XT, and the (now defunct) SiCortex architecture, among others. Recently, the
Cactus
team
successfully carried out benchmark runs on 131,072 cores on the IBM Blue Gene/P at the Argonne National
Laboratory [16].
3.2. Kranc Code Generation Package.
Kranc
[17, 1, 18] is a Mathematica-based computer algebra
package designed to facilitate analytical manipulations of systems of tensorial equations, and to automatically
generate C or Fortran code for solving initial boundary value problems.
Kranc
generates complete
Cactus
thorns,
starting from a high-level description including the system of equations formulated in high-level Mathematica
notation, and discretizing the equations with higher-order finite differencing.
Kranc
generated thorns make use
of the Cactus Computational Toolkit, declaring to Cactus the grid functions which the simulation will use, and
computing the right hand sides of the evolution equations so that the time integrator can advance the solution
in time.
0
5
10
15
20
25
30
35
40
16
64
256
1k
4k
16k
time per RHS evaluation [
µ
s]
number of cores
Cactus Benchmark
Franklin
HLRB II
Kraken
Queen Bee
Ranger
0
2
4
6
8
10
12
16 32 64 128 256 512 1k
2k
total bandwidth [GByte/s]
number of cores
Cactus I/O Benchmark
Ranger
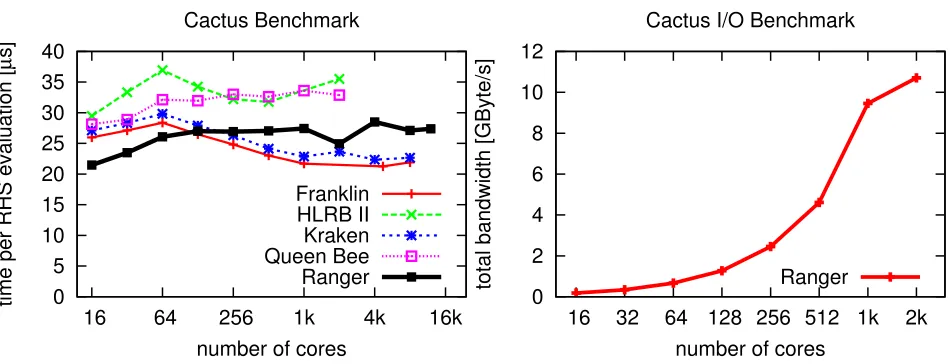
Fig. 3.1. Left: Weak scaling benchmark results of the McLachlancode on several current leadership HPC systems. This benchmark simulates a single black hole with nine levels of mesh refinement. The code scales well up to more than 12,000 cores of Ranger at TACC. Right: I/O benchmark on Ranger, showing the total I/O bandwidth vs. the number of cores. Cactus achieves a significant fraction of the maximum bandwidth already on 1,000 cores.
As can been seen from Figure 3.1,
on TACC’s Ranger,
McLachlan
and the supporting infrastructure scale
well up to more than 12,000 cores. Cactus–Carpet
is also able to use a significant fraction of the theoretical
peak I/O bandwidth already on 1,000 cores.
4. Interactive and Collaborative Simulations.
4.1. Monitoring, Profiling and Debugging.
Supporting performance and enforcing correctness of the
complex, large-scale codes that Cactus generates is a non-trivial task, targeted by the NSF-funded
Application-Level Performance and Correctness Analysis (Alpaca) project [23, 24].
In order to reap the benefits of the high-concurrency machines available today, it is not sufficient that a
code’s parallel efficiency remain constant as the size of the problem is scaled up, but also that its ease of control
remains close to that of simulations carried out on a few number of computing cores; if this is not the case,
the process of debugging and optimizing the code may be so time-consuming as to offset the speed-up obtained
through parallelism. The Alpaca project addresses this issue through the development of application-level tools,
i. e., high-level tools that are aware of the Cactus data structures and execution model.
In particular, Alpaca’s objectives concentrate on three areas: (i) high-level debugging, devising debugging
strategies that leverage high-level knowledge about the execution actors and the data processing, and develop
tools that extract such information from a simulation and provide it in an abstract format to the user; (ii)
high-level profiling, devising algorithms for extracting high-level information from timing data; and (iii) remote
visualization, using visual control over the simulation data as a high-level correctness check. In particular, work
within the Alpaca project includes the development of HTTPS, a Cactus module that spawns an SSL web
server, with X.509 certificate authorization, at the beginning of a simulation and uses it to receive incoming
connections, expose the simulation’s details and provide fine-grained control over its execution.
In order for scientific collaborations to work at this scale, for the large amounts of data to be handled
properly, and for the results to be reproducible, new methods of collaboration must be developed or already
existing tools from other fields must be leveraged. Cactus can now use two tools from the latter class to
announce information about simulations to existing Web 2.0 services, as described in the following.
Twitter’s
[28] main service is a message routing system that enables its users to send and read each others’
updates, known as
tweets
. Tweets have to be very short (at most 140 characters in length) and can be sent and
read via a wide range of devices, e.g. mobile texting, instant message, the web, or external applications.
Twitter provides an API [29] which allows the integration of Twitter with other web services and
ap-plications. One of the most important functions is the “statuses/update” API call, which is used to post a
new Twitter message from the specified user. This Twitter API is used in a Cactus thorn to announce live
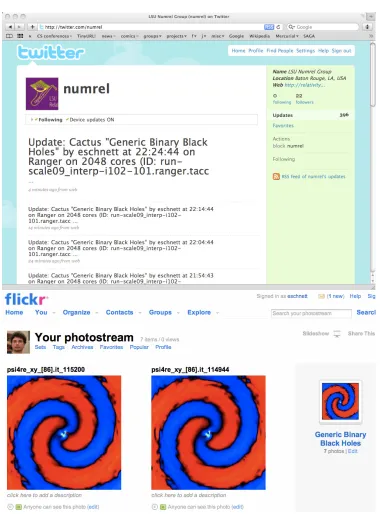
information from a simulation (Figure 7.2).
Flickr
[30] was launched as an image hosting website targeted at digital photographs, but short videos can
be uploaded today as well. Flickr can be used at no charge with limits on the total size of images that can be
uploaded (currently 100 MByte) and on the number of images which can be viewed (currently 200), along with
other potential services available.
One important functionality, besides the image upload, is to be able to group images. Flickr offers a
capability to group images into “Sets”, and also can group different “Sets” into a “Collection”. This provides
a hierarchical structure for organizing simulation images.
Flickr has many features that can be taken advantage of for providing a collaborative repository for
Cactus-produced images and information. All of them are accessed through a comprehensive web service API for
uploading and manipulating images [31].
A new Cactus thorn uses the Flickr API to upload live images from the running simulation. Images
generated by one simulation are grouped into one “Set”. It is also possible to change the rendered variables, or
to change the upload frequency on-line through an Cactus-internal web server (see section 4.1).
5. Distributed Visualization.
5.1. Visualization Scenario.
Our scenario is the following: the visualization user is connected over a
network link to a grid system of various types of resources (visualization, network, compute, data). The data
to be visualized is located on a data server near the location where the scientific simulation was executed and
this data server is also connected to the grid system.
There are various ways in which a visualization application can be created to solve the problem, such
as running the visualization on the data server and transferring a video stream to the client, or running the
visualization on the local client and transferring a data stream between the data server and the client.
These two solutions are limited by the visualization power available near the data server or near the local
machine, respectively. Since powerful visualization resources are not available at the client and may not be
available near the data server, we have built a three-way distributed system that uses a visualization cluster
in the network, data streaming from the data server to the visualization cluster, and video streaming from the
visualization cluster to the local client.
We have taken the problem one step further and considered the case where the network connection of
the data server is a relatively slow one—much slower than the network capacity of the rendering machine. In
this situation we are dealing with I/O scalability issues, and the solution we propose is to create a temporary
distributed data server in the grid. The distributed data server uses compute and data resources that are
not dedicated for this application but are allocated on-demand to support it when it needs to execute. The
distributed data server can sustain much higher data transfer rates than a single data source. Data is loaded
in advance from the source on the distributed data server. The architecture of this approach is illustrated in
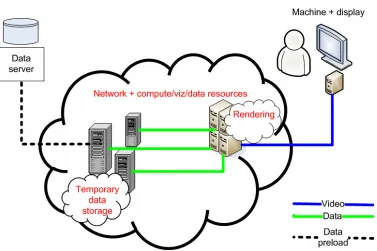
Figure 5.1. Because the visualization resources are not local to the end client, a remote interaction system is
necessary in order for the user to be able to connect to and steer the visualization.
Fig. 5.1. Architecture of demonstration system which involves a temporary distributed data server allocated on-demand to
improve sustained data transfer rates.
that is seen by the application, and the solution we use is based on a completely non-blocking architecture using
a large number of parallel threads to keep the data flow moving.
5.3. Parallel Rendering.
Parallel rendering on HPC or visualization clusters is utilized to visualize large
datasets. For the SCALE 2009 demonstration we have used a self-developed parallel GPU ray-casting volume
rendering implementation to interactively visualize the time-dependent numerical relativity dataset, where each
timestep has a size of about 1 GByte. GPU ray-casting does floating point compositing in a single pass using a
fragment shader. The trade-off between rendering time and visual quality can be steered directly by the user(s).
Our rendering system overlaps communication with (visual) computation, in order to achieve maximum
perfor-mance. Parallelism is achieved by data domain decomposition (each node renders a distinct subsection of the
data), and compositing of the resulted partial view images in order to create a single view of the entire dataset.
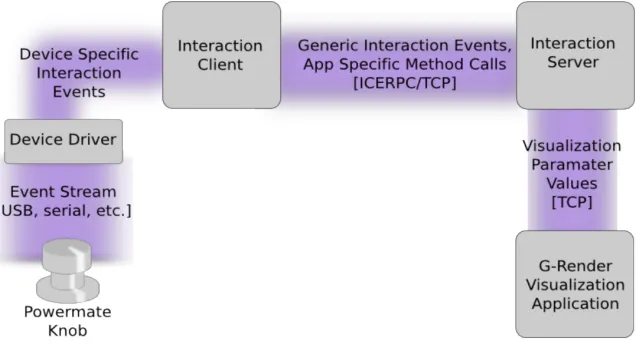
5.4. Video Streaming and Interaction.
Interaction with the remote parallel renderer is necessary to
modify navigation parameters such as the direction of viewing or the level of zoom, and to control the trade-off
of visual quality and image deliver time. Since the visualization application is not local, an interaction system
consisting of three components was developed. The components are a local interaction client running on the
local machine, an interaction server running on the rendering cluster, and an application plug-in that connects
the interaction server to the application and inserts interaction commands into the application workflow (see
Fig. 5.2).
For our demonstration we used specialized interaction devices developed by the Tangible Visualization
Laboratory at CCT [33] that are very useful in long-latency remote interaction systems, and can support
collaboration (collaborative visualization) from multiple sites.
The final component of the system is the video streaming. Images that are generated from the remote
visualization cluster need to be transported to the local client for the user to see. In the past, we have successfully
utilized hardware-assisted systems running videoconferencing software (
Ultragrid
[34]) and software-based video
streaming using
SAGE
[35]. Our system supports various video streaming methods including SAGE, a self
developed video streaming subsystem, or VNC [36].
Fig. 5.2.Architecture of interaction system
One method for tightening the integration of applications and networks is to use reserved, exclusive access
to network resources controlled by the user. Several projects, including DOE UltraScienceNet [40, 41], NSF
CHEETAH [42], Phosphorus [43], G-lambda [44] and Internet2 ION [45] have explored mechanisms for providing
such network services to applications.
The limitations of desktop-based visualization led to the development of parallel visualization systems and
frameworks such as ImageVis3D [46], Chromium [47] and Equalizer [48] that can take advantage of
computa-tional clusters to visualize large datasets. Equalizer and Chromium are parallel rendering frameworks that can
be used to build parallel rendering applications. ImageVis3D is a parallel rendering tool for interactive volume
rendering of large datasets. These and other tools and techniques are being developed (for example as part of the
Institute for Ultra-Scale Visualization [49, 50]) to be able to take advantage of parallel resources for visualization.
Other visualization systems such as Data Vault (DV) [51], ParaView [52], and VisIt [53] were designed to
facilitate the visualization of remote data and, while they have the capability to transmit data and images over
the network, they are not able to take advantage of the full capacity of high-speed networks and thus have
low data transport performance, can suffer from a lack of interactivity and image quality, and do not support
collaborative visualization.
Data Vault (DV) is a visualization and data analysis package for numerical codes that solve partial
differ-ential equations via grid-based methods, in particular those utilizing adaptive mesh refinement (AMR) and/or
running in a parallel environment. DV provides a of built-in functions to analyze 1D, 2D, and 3D time-dependent
datasets.
ParaView is a parallel visualization application designed to handle large datasets. It supports two
distribu-tion modes: client–server and client–rendering server–data server.
VisIt is a visualization software designed to handle large datasets using client–server distribution of the
visualization process. Similar to ParaView’s client–server distribution, VisIt uses a parallel rendering server
and a local viewer and interaction client. Most commonly, the server is as a stand-alone process that reads data
from files. An alternative exists where a simulation code delivers data directly to VisIt, separating the server
into two components. This allows for visualization and analysis of a live running simulation.
Several visualization systems such as RAVE [54] or the visualization system by Zhu et al. [55] are focused on
the theoretical aspects of distributed visualization and do not provide the level of performance and scalability
needed for current scientific applications. The distributed visualization architecture proposed by Shalf and
Bethel [56] could support a variety of distributed visualization applications and inspired the development of our
system.
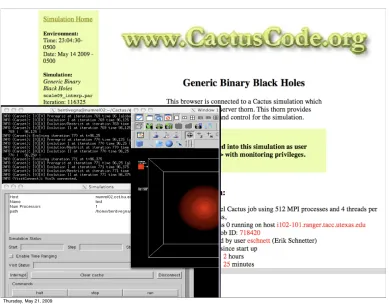
Fig. 7.1. The Alpaca tools provide real-time access to simulations running on remote machines, allowing monitoring, inter-active visualization, steering, and high-level debugging of large-scale simulations.
7. SCALE 2009 Demonstration and Results.
The resulting Cactus application
McLachlan
used the
Carpet Adaptive Mesh Refinement infrastructure to provide scalable, high order finite differencing, in this case
running on 2048 cores of the Texas Advanced Computing Center (TACC) Ranger machine. The simulation
ran for altogether 160 hours on Ranger, generating 42 TByte of data. Live interaction with the simulation
was shown, via the application-level web interface HTTPS (Fig. 7.1, Section 4.1). The simulation also used
new thorns co-developed by an undergraduate student at LSU to announce runtime information to Twitter and
real-time images of the gravitational field to Flickr (Fig. 7.2).
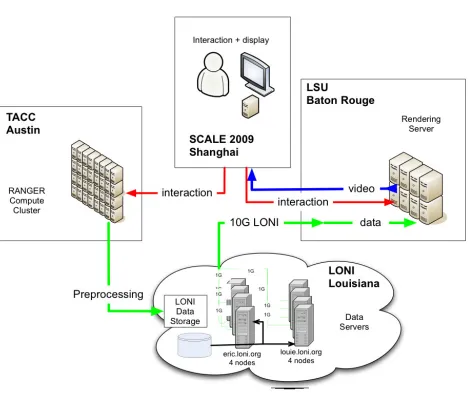
Interactive visualization of the data produced was shown using a visualization system distributed across
the Louisiana Optical Network Initiative (LONI), see Fig. 7.3. A data server deployed on the Eric and Louie
LONI clusters cached 20 GByte of data at any time in RAM using a total of 8 compute nodes. This data
was then transferred using TCP and UDT protocols over the 10 Gbit/s LONI network to rendering nodes at a
visualization cluster at LSU.
The average aggregate I/O rate achieved by the SCALE 2009 system was 4 Gbit/s. Loading
time from the remote distributed resources was six times faster than local load from disk (2 s
remote vs. 12.8 s local).
Here a new parallel renderer used GPU acceleration to render images, which were then streamed using the
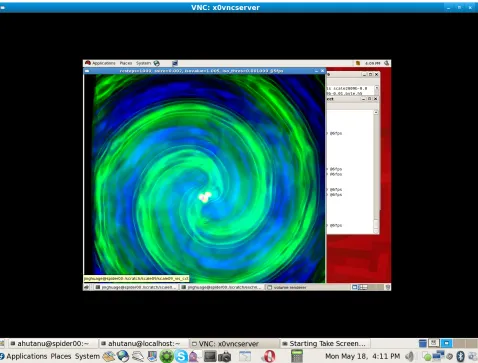
SAGE software to the final display. VNC (Fig. 7.4) was used instead of SAGE in Shanghai due to local network
limitations. Tangible interaction devices (also located in Shanghai) provided interaction with the renderer.
The size of a rendered timestep was
1024
3bytes, for a total data size of 1 GB/timestep. The
rendering performance of the SCALE 2009 system for this data, executed on an 8 node rendering
cluster each node equipped with NVidia Geforce 9500 GT 256 MB DDR3 was 5 frames per second.
Fig. 7.2. New Cactus thorns allow simulations to announce live information and images to (top) Twitter, (bottom) Flickr
enabling a new mode of scientific collaboration using Web 2.0 technologies.
8. Results After Demonstration.
After SCALE 2009 we continued to improve the system, in particular
the rendering and I/O subsystems. In our code generation and simulation infrastructure, we have been
concen-trating on adding new physics (in particular radiation transport), a new formulation of the Einstein equations,
and on improving single-node (single-core and multi-core) performance.
We evaluated the visualization system performance and compared it with the performance of Paraview and
VisIt using a sample dataset with a resolution of 4096
3bytes with a total size of 64 GB.
Fig. 7.3. Set up of the SCALE 2009 demonstration that involved the resources of the NSF TeraGrid, the Louisiana Optical Network Initiative (LONI) and the Center for Computation & Technology.
by upgrading the graphics hardware to four NVidia Tesla S1070 units. Each Tesla contains 4 GPUs, has 16 GB
video memory and services two rendering nodes, each node thus having access to two GPU units and 8 GB video
memory. The cluster interconnect is 4x Infiniband and the software was compiled and executed using MPICH2,
version 1.1.1p1 using IP emulation over Infiniband.
The rendering frame rate was measured and local I/O performance was compared with remote (network)
performance for three scenarios: rendering 15 GB data using 8 processes, rendering 30 GB data using 16 processes
(two processes per node), and rendering 60 GB data using 32 processes (four processes per node, two processes
per GPU).
The network data servers were deployed on two LONI clusters, using up to 32 distributed compute nodes
to store data in the main memory. The network protocol used for data transfer was UDT.
For reference, the performance of the system when running on a single workstation was measured
(worksta-tion specifica(worksta-tions: Intel Core2 CPU X6800, 2.93 GHz, 4 GB RAM, graphics: GeForce 8800 GTX, 1 GB video
memory, 1 Gbps network interface). The rendering resolution for the benchmark is 1024x800 pixels.
Fig. 7.4. Visualization client on the end display showing rendering of gravitational waves emitted from the inspiral collision of two black holes.
processes required to render it) increases, the frame rate drops to a level below the point of interactivity. The
results show that the system is able to utilize the rendering cluster to interactively render 35 times more data
than a typical workstation, and maintain an acceptable level of interactivity while rendering more than 70 times
more data than on the workstation. The current system is able to interactively visualize data 60 times larger
than that supported by the SCALE 2009 system.
Table 8.1
Data throughput and rendering scalability results.
# processes
Data size
Frame rate (fps)
Local speed
Network speed
1 (workstation)
0.8 GB
30
0.68 Gbps
0.8 Gbps
8 (cluster)
15 GB
15-21 (18 avg)
0.11 Gbps
6.6 Gbps
16 (cluster)
30 GB
11-13 (12 avg)
0.12 Gbps
5.3 Gbps
32 (cluster)
60 GB
4-5 (4.5 avg)
0.2 Gbps
4.3 Gbps
times better than local I/O performance, and the current system is able to sustain up to 6.6 Gbps transfer rates,
both showing significant improvements over the SCALE 2009 system.
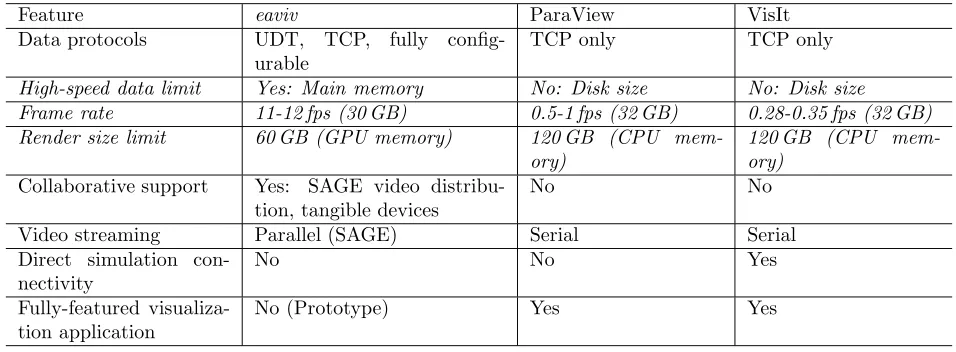
To better understand the features and the trade-offs of our system (named eaviv) a comparison with
alternative visualization systems was made. Two appropriate comparison systems were identified, ParaView
(version 3.6.1) and VisIt (version 1.12.0).
Table 8.2
Comparison of visualization systems features and performance: I/O methods, rendering and other items
Feature
eaviv
ParaView
VisIt
Data protocols
UDT, TCP, fully
config-urable
TCP only
TCP only
High-speed data limit
Yes: Main memory
No: Disk size
No: Disk size
Frame rate
11-12 fps (30 GB)
0.5-1 fps (32 GB)
0.28-0.35 fps (32 GB)
Render size limit
60 GB (GPU memory)
120 GB (CPU
mem-ory)
120 GB (CPU
mem-ory)
Collaborative support
Yes: SAGE video
distribu-tion, tangible devices
No
No
Video streaming
Parallel (SAGE)
Serial
Serial
Direct simulation
con-nectivity
No
No
Yes
Fully-featured
visualiza-tion applicavisualiza-tion
No (Prototype)
Yes
Yes
The comparison was made in three different areas: data input; parallel rendering; and miscellaneous items.
Both qualitative and quantitative items were analyzed. Slightly different data sizes were used due to the different
modes of selecting the section of interest in each system.
Starting with data input, our system supports multiple data protocols allowing it to take advantage of
high-speed networks. The benchmark results shown in Table 8.2 executed on the rendering cluster shows how
our system can take advantage of the high-speed network to achieve a high data throughput. This throughput
can however only be sustained for an amount of data equal to the main memory size available in the network.
Both ParaView and VisIt throughput is limited by disk speed.
The second area of interest is the parallel rendering component. Our system uses a GPU-based parallel
renderer, allowing it to take advantage of graphics acceleration for volume rendering and enabling high frame
rate. ParaView and VisIt do not currently support parallel GPU acceleration, and in consequence the frame
rate that they can achieve is below 1 frame per second. For VisIt the ray-casting parallel rendering method was
used for comparison. GPU-based rendering is however limited in the data size that it can render by the amount
of video memory of the graphics cards. CPU-based rendering can usually render more data, as the amount of
main memory in a system is generally higher than that of video memory.
Parallel video streaming is a feature supported by our use of the SAGE system. Each rendering node,
after generating a section of the final image can transmit it directly to the viewer client. In contrast, VisIt
and ParaView rendering processes transmit their results first to the master node which combines them and
transmits the complete image to the client. Serial video streaming introduces additional overhead and latency
into the system.
Our prototype has integrated support for tangible interaction devices while allowing mouse and keyboard
interaction through the use of third-party software, such as VNC. The use of SAGE and tangible interaction
devices enables direct support of collaborative visualization, where multiple users, potentially at different
lo-cations around the world can simultaneously interact and collaborate using the visualization system. SAGE
bridges can be used to multicast the video stream from the application to multiple users, and interaction devices
deployed at each user location can be used to interact with the visualization.
9. Conclusion and Future Work.
Our system shows the viability of the proposed approach of using
the
Cactus
framework, automated code generation, and modern numerical methods to scale to a large number
of processors. It also shows how distributing the visualization system into separate components increases the
amount of data that can be handled, increases the speed at which the data can be visualized compared to local
techniques, and improves data transfer rates and interactivity.
The driving principle behind our approach is that, following a careful analysis and based on a detailed
description of a particular technical problem, a scalable solution is to build a fully optimized integrated software
system. Our proposed system is still modular, however the interfaces between the various components are
flexible, and were carefully designed to enable optimizations across multiple components. The scalability of this
system would suffer if each component would be designed and implemented in isolation of the other components
and the coupling between components would be limited to legacy or rigid interfaces.
Our integrated approach enables us to take advantage of the latest improvements in GPU architectures,
networks, innovative interaction systems and high-performance data and video transmission systems and
pro-vides a solution and a model for future scientific computing, and we believe many other applications will be
able to benefit from adopting a similar approach.
In the future, we are planning to tighten the connection between the simulation and visualization
com-ponents, to enable our system to visualize data on the fly as it is generated by the simulation. Our future
plans include integrating automated provisioning of network resources in our application. Towards this we are
currently in the process of building a testbed that connects compute, storage, graphics and display resources
(provided by TeraGrid sites Louisiana State University and National Center for Supercomputing Applications
and international partners such as Masaryk University) together with dynamic network circuit services provided
by Internet2 and the Global Lambda Integrated Facility international community.
A fundamental service required by our system is co-allocation and advance reservation of resources. We are
working together with resource providers and actively encourage them to enable these services that are crucial
to enable the routine execution such complex distributed applications.
10. Acknowledgements.
We thank the current and former members of the AEI/LSU numerical
rela-tivity group who developed the physics code that made this work possible, and the extended Cactus team for
their computational infrastructure. We also thank the original authors of the Kranc code generation
pack-age for making their work publicly available. We acknowledge Jorge Ucan and Kristen Sunde for preparing
the high-definition video for the SCALE 2009 Challenge, and Debra Waters for help with organization. The
demonstration would not have been possible without the help of our colleagues at TACC and LONI.
This material is based upon work supported by the National Science Foundation (Alpaca #0721915, Blue
Waters #0725070, Viz Tangibles #0521559, XiRel #0701566, Louisiana RII
CyberTools
#0701491, OCI EAGER
eaviv
#0947825) and by the Center for Computation & Technology at LSU. The simulations and benchmarks
were performed on Queen Bee at LONI under allocations
loni cactus03
and
loni numrel03, and on Ranger
at TACC under the NSF TeraGrid allocation TG-MCA02N014. The distributed visualization development was
supported by the NSF TeraGrid allocation TG-CCR080027T.
REFERENCES
[1] Sascha Husa, Ian Hinder, and Christiane Lechner. Kranc: a Mathematica application to generate numerical codes for tensorial evolution equations. Comput. Phys. Comm., 174:983–1004, 2006.
[2] Tom Goodale, Gabrielle Allen, Gerd Lanfermann, Joan Mass´o, Thomas Radke, Edward Seidel, and John Shalf. The Cactus framework and toolkit: Design and applications. InHigh Performance Computing for Computational Science - VECPAR 2002, 5th International Conference, Porto, Portugal, June 26-28, 2002, pages 197–227, Berlin, 2003. Springer.
[3] Cactus Computational Toolkit home page.
[4] E. Schnetter, S. H. Hawley, and I. Hawke. Evolutions in 3D numerical relativity using fixed mesh refinement.Class. Quantum Grav., 21(6):1465–1488, 21 March 2004. gr-qc/0310042.
[5] Erik Schnetter, Peter Diener, Nils Dorband, and Manuel Tiglio. A multi-block infrastructure for three-dimensional time-dependent numerical relativity.Class. Quantum Grav., 23:S553–S578, 2006.
[6] Mesh refinement with Carpet.
[7] R.N. Hulse and J.H. Taylor. Discovery of a pulsar in a binary system. Astrophys. J., 195:L51–L53, 1975.
[8] Ramesh Narayan and Jeffrey E. McClintock. Advection-dominated accretion and the black hole event horizon. New Astron. Rev., 51:733–751, 2008.
[9] LIGO: Laser Interferometer Gravitational Wave Observatory. [10] GEO 600.
[12] Peter M´esz´aros. Gamma-ray bursts. Rep. Prog. Phys., 69:2259–2321, 2006.
[13] Christian D. Ott, Erik Schnetter, Gabrielle Allen, Edward Seidel, Jian Tao, and Burkhard Zink. A case study for petascale applications in astrophysics: Simulating Gamma-Ray Bursts. In Proceedings of the 15th ACM Mardi Gras conference: From lightweight mash-ups to lambda grids: Understanding the spectrum of distributed computing requirements, appli-cations, tools, infrastructures, interoperability, and the incremental adoption of key capabilities, number 18 in ACM International Conference Proceeding Series, Baton Rouge, Louisiana, 2008. ACM.
[14] Erik Schnetter, Christian D. Ott, Gabrielle Allen, Peter Diener, Tom Goodale, Thomas Radke, Edward Seidel, and John Shalf. Cactus Framework: Black holes to gamma ray bursts. In David A. Bader, editor,Petascale Computing: Algorithms and Applications, chapter 24. Chapman & Hall/CRC Computational Science Series, 2008.
[15] Marsha J. Berger and Joseph Oliger. Adaptive mesh refinement for hyperbolic partial differential equations. J. Comput. Phys., 53:484–512, 1984.
[16] Cactus Benchmark Results and Papers.
[17] Christiane Lechner, Dana Alic, and Sascha Husa. From tensor equations to numerical code — computer algebra tools for numerical relativity. InSYNASC 2004 — 6th International Symposium on Symbolic and Numeric Algorithms for Scientific Computing, Timisoara, Romania, 2004.
[18] Kranc: Automated Code Generation.
[19] David Brown, Peter Diener, Olivier Sarbach, Erik Schnetter, and Manuel Tiglio. Turduckening black holes: an analytical and computational study. Phys. Rev. D, 79:044023, 2009.
[20] McLachlan, a Public BSSN Code.
[21] Jian Tao, Gabrielle Allen, Ian Hinder, Erik Schnetter, and Yosef Zlochower. XiRel: Standard benchmarks for numerical relativity codes using Cactus and Carpet. Technical Report CCT-TR-2008-5, Louisiana State University, 2008. [22] XiRel: Next Generation Infrastructure for Numerical Relativity.
[23] Erik Schnetter, Gabrielle Allen, Tom Goodale, and Mayank Tyagi. Alpaca: Cactus tools for application level performance and correctness analysis. Technical Report CCT-TR-2008-2, Louisiana State University, 2008.
[24] Alpaca: Cactus tools for Application-Level Profiling and Correctness Analysis. [25] S. W. Hawking. Black holes in general relativity. Comm. Math. Phys., 25:152, 1972.
[26] L. Smarr. Spacetimes generated by computers: Black holes with gravitational radiation.Ann. N. Y. Acad. Sci., 302:569–604, 1977.
[27] Miguel Alcubierre, W. Benger, B. Br¨ugmann, G. Lanfermann, L. Nerger, E. Seidel, and R. Takahashi. 3D Grazing Collision of Two Black Holes. Phys. Rev. Lett., 87:271103, 2001.
[28] Twitter.
[29] Twitter Application Programming Interface. [30] Flickr.
[31] Flickr API Web page.
[32] Yunhong Gu and Robert L. Grossman. Udt: Udp-based data transfer for high-speed wide area networks. Comput. Networks, 51(7):1777–1799, 2007.
[33] Brygg Ullmer, Rajesh Sankaran, Srikanth Jandhyala, Blake Tregre, Cornelius Toole, Karun Kallakuri, Christopher Laan, Matthew Hess, Farid Harhad, Urban Wiggins, and Shining Sun. Tangible menus and interaction trays: core tangibles for common physical/digital activities. In TEI ’08: Proceedings of the 2nd international conference on Tangible and embedded interaction, pages 209–212, New York, NY, USA, 2008. ACM.
[34] Petr Holub, Ludek Matyska, Milos Liska, Luk´as Hejtm´anek, Jir´ı Denemark, Tom´as Rebok, Andrei Hutanu, Ravi Paruchuri, Jan Radil, and Eva Hladk´a. High-definition multimedia for multiparty low-latency interactive communication. Future Generation Comp. Syst., 22(8):856–861, 2006.
[35] Luc Renambot, Byungil Jeong, Hyejung Hur, Andrew Johnson, and Jason Leigh. Enabling high resolution collaborative visualization in display rich virtual organizations. Future Gener. Comput. Syst., 25(2):161–168, 2009.
[36] Tristan Richardson, Quentin Stafford-Fraser, Kenneth R. Wood, and Andy Hopper. Virtual Network Computing. IEEE Internet Computing, 2(1):33–38, 1998.
[37] Larry L. Smarr, Andrew A. Chien, Tom DeFanti, Jason Leigh, and Philip M. Papadopoulos. The optiputer.Communications of the ACM, 46(11):58–67, 2003.
[38] Larry Smarr, Paul Gilna, Phil Papadopoulos, Thomas A. DeFanti, Greg Hidley, John Wooley, E. Virginia Armbrust, Forest Rohwer, and Eric Frost. Building an optiplanet collaboratory to support microbial metagenomics.Future Gener. Comput. Syst., 25(2):124–131, 2009.
[39] Venkatram Vishwanath, Robert Burns, Jason Leigh, and Michael Seablom. Accelerating tropical cyclone analysis using lambdaram, a distributed data cache over wide-area ultra-fast networks. Future Gener. Comput. Syst., 25(2):184–191, 2009.
[40] N.S.V. Rao, W.R. Wing, S.M. Carter, and Q. Wu. Ultrascience net: network testbed for large-scale science applications.
Communications Magazine, IEEE, 43(11):S12–S17, Nov. 2005.
[41] N. S. V. Rao, W. R. Wing, S. Hicks, S. Poole, F. Denap, S. M. Carter, and Q. Wu. Ultrascience net: research testbed for high-performance networking. Proceedings of International Symposium on Computer and Sensor Network Systems, April 2008. [42] Xuan Zheng, M. Veeraraghavan, N.S.V. Rao, Qishi Wu, and Mengxia Zhu. CHEETAH: circuit-switched high-speed
end-to-end transport architecture testbed. Communications Magazine, IEEE, 43(8):s11–s17, Aug. 2005.
[43] S. Figuerola, N. Ciulli, M. De Leenheer, Y. Demchenko, W. Ziegler, and A. Binczewski on behalf of the PHOSPHORUS con-sortium. PHOSPHORUS: Single-step on-demand services across multi-domain networks for e-science. InProceedings of the European Conference and Exhibition on Optical Communication ’07, 2007.
[45] Internet2 ION. Web page, 2009. http://www.internet2.edu/ion/.
[46] 2009. ImageVis3D: A Real-time Volume Rendering Tool for Large Data. Scientific Computing and Imaging Institute (SCI). [47] Greg Humphreys, Mike Houston, Ren Ng, Randall Frank, Sean Ahern, Peter D. Kirchner, and James T. Klosowski. Chromium:
a stream-processing framework for interactive rendering on clusters. ACM Trans. Graph., 21(3):693–702, 2002.
[48] Stefan Eilemann, Maxim Makhinya, and Renato Pajarola. Equalizer: A scalable parallel rendering framework. In IEEE Transactions on Visualization and Computer Graphics, 2008.
[49] Kwan-Liu Ma, Chaoli Wang, Hongfeng Yu, Kenneth Moreland, Jian Huang, and Rob Ross. Next-Generation Visualization Technologies: Enabling Discoveries at Extreme Scale.SciDAC Review, 12:12–21, February 2009.
[50] Kwan-Liu Ma, Robert Ross, Jian Huang, Greg Humphreys, Nelson Max, Kenneth Moreland, John D. Owens, and Han-Wei Shen. Ultra-Scale Visualization: Research and Education. Journal of Physics, 78, June 2007. (Proceedings of SciDAC 2007 Conference).
[51] Data Vault Tutorial.
[52] A. Cedilnik, B. Geveci, K. Moreland, J. Ahrens, and J. Favre. Remote Large Data Visualization in the ParaView Framework.
Proceedings of the Eurographics Parallel Graphics and Visualization, pages 162–170, 2006.
[53] H. Childs, E. Brugger, K. Bonnell, J. Meredith, M. Miller, B. Whitlock, and N. Max. A Contract Based System For Large Data Visualization.Visualization, IEEE 2005, pages 25–25, 2005.
[54] I. J. Grimstead, N. J. Avis, and D. W. Walker. RAVE: the resource-aware visualization environment. Concurrency and Computation: Practice and Experience, 21(4):415–448, 2009.
[55] Mengxia Zhu, Qishi Wu, Nageswara S. V. Rao, and Sitharama Iyengar. Optimal pipeline decomposition and adaptive network mapping to support distributed remote visualization.J. Parallel Distrib. Comput., 67(8):947–956, 2007. [56] J. Shalf and EW Bethel. The grid and future visualization system architectures. Computer Graphics and Applications,
IEEE, 23(2):6–9, 2003.
[57] Werner Benger, Hans-Christian Hege, Andr´e Merzky, Thomas Radke, and Edward Seidel. Efficient Distributed File I/O for Visualization in Grid Environments. In B. Engquist, L. Johnsson, M. Hammill, and F. Short, editors,Simulation and Visualization on the Grid, volume 13 ofLecture Notes in Computational Science and Engineering, pages 1–6. Springer Verlag, 2000.
[58] Hans-Christian Hege, Andrei Hutanu, Ralf K¨ahler, Andr´e Merzky, Thomas Radke, Edward Seidel, and Brygg Ullmer. Progressive Retrieval and Hierarchical Visualization of Large Remote Data. Scalable Computing: Practice and Experience, 6(3):57–66, September 2005. http://www.scpe.org/?a=volume&v=23.
[59] William Allcock, John Bresnahan, Rajkumar Kettimuthu, and Michael Link. The Globus Striped GridFTP Framework and Server. InSC ’05: Proceedings of the 2005 ACM/IEEE conference on Supercomputing, page 54, Washington, DC, USA, 2005. IEEE Computer Society.
[60] HDF5: Hierarchical Data Format Version 5.