Available Online at www.ijpret.com 364
INTERNATIONAL JOURNAL OF PURE AND
APPLIED RESEARCH IN ENGINEERING AND
TECHNOLOGY
A PATH FOR HORIZING YOUR INNOVATIVE WORK
EFFECTIVE CLASSIFICATION OF INDIAN NEWS USING CLASSIFIER HYPERPIPES
AND NAIVEBAYES FROM WEKA
DR. SUSHILKUMAR RAMESHPANT KALMEGH
Department of Computer Science, Sant Gadge Baba Amravati University, Amravati
Accepted Date: 15/03/2016; Published Date: 01/05/2016
\
Abstract: Recent developments of e-learning specifications such as Learning Object Metadata (LOM), Sharable Content Object Reference Model (SCORM), Learning Design and other pedagogy research in semantic e-Learning have shown a trend of applying innovative computational techniques, especially Semantic Web technologies, to promote existing content-focused learning services to semantic-aware and personalized learning services. Classification may refer to categorization, the process in which ideas and objects are recognized, differentiated, and understood. An algorithm that implements classification, especially in a concrete implementation, is known as a classifier. Classification is an important data mining technique with broad applications. It classifies data of various kinds. This paper has been carried out to make a performance evaluation of HyperPipe and NaiveBayes classification algorithm. The paper sets out to make comparative evaluation of classifiers HyperPipe and NaiveBayes in the context of dataset of Indian news to maximize true positive rate and minimize false positive rate. For processing Weka API were Used. The results in the paper on dataset of news also show that the efficiency and accuracy of HyperPipe is good than NaiveBayes.
Keywords: Dataset, Dynamic Multimedia Content, E-Learning, HyperPipe, NaiveBayes
.
Corresponding Author: DR. SUSHILKUMAR RAMESHPANT KALMEGH Access Online On:
www.ijpret.com
How to Cite This Article:
Sushilkumar Rameshpant Kalmegh, IJPRET, 2016; Volume 4 (9): 364-378
Available Online at www.ijpret.com 365
INTRODUCTION
As the latest stage of learning and training evolution, e-Learning is supposed to provide intelligent functionalities not only in processing multi-media education resources but also in supporting context-sensitive pedagogical education processes.
In recent years, people have been used to using the Internet as an important information channel for working and living. More and more daily activities are relying on the global network than before, for example, e-Business, e-Government, e-Science, and e-Learning. Among these e-Activities, e-Learning has been regarded as a fast growing research and application area with huge market potential. However, e-Learning is different from other e-Activities for its involvement of precise information retrieval, systematic knowledge management, and pedagogical process. These features make e-Learning systems more complicated than basic web-based information systems, which consequently need integrated solutions to address those issues together, especially when multimedia education resources are more and more popular. As people have experienced on the Internet, finding the right information is not an easy thing, and finding multimedia resources which are semantically relevant to requests is even harder. The limitation of HTML in information representation is an essential issue, since HTML was designed to represent human readable literal information rather than carrying machine readable semantic information of literal and multimedia resources. In a practical e-Learning scenario, the information and knowledge exchange is more frequent than that in a normal information retrieval case on the Web, because people just naturally treat an e-Learning system as more organized information and knowledge base rather than a massive global network.
In this case, there is a need of a design of a framework which can integrate dynamic multimedia content to the existing e-contents. This paper discusses the methodology for such integration. In order to get the details of this methodology, this paper is organized into five parts. First part discusses the concept of e-learning followed by the literature required for analysis of methods implemented. Fourth one discusses the technique of classification. Fifth one is System Design followed by datasets used for analysis. Seventh is the Performance Analysis and then conclusions. [2]
2. e-LEARNING
Available Online at www.ijpret.com 366
It means:
1. E-learning is a new education concept; it may differ from the old educational concept.
2. Delivery of the digital content is the main characters of e-learning.
3. This definition extends the environment on the Internet. It means that the Internet provides a learning environment for the students and teachers. This environment is learner-oriented, so we can throw out the thoughts of traditionally teacher-center's instruction in classroom.
4. As a new concept of education, e-learning gives a condition for us to realize the life-long learning principle and help us to build a more real learning society. e-learning plays a major role in high education for the reason of fast need of high education. [1], [2]
3. LITERATURE SURVEY
There are a number of e-Learning software systems on the market such as WebCT Blackboard, Learning Space, and PageOut. The most common function offered by those systems is courseware management, which is basically file-level content management. Although some of those systems (e.g., WebCT) claim to be able to integrate with certain academic information systems, the underlying computing technology is still at superficial level.
The major implementation that includes the intelligence in e-Learning is ConKMEL. To resolve the knowledge integration and management problem in multimedia e-Learning, it has proposed a semantic context aware approach, which features an integrated contextual knowledge management framework to support intelligent e-Learning. [3]
Traditional web-based e-learning systems use a web browser as the interface. Through run-time learning environments (either compatible or incompatible with SCORM),
User
WWW Run Time Learning
Environment
Learning Objects
Audio, Video, Docs etc
Available Online at www.ijpret.com 367
users could access the learning objects, which are directly linked to multimedia learning resources such as lecture video/audio, presentation slides and reference documents.[4],[5] A flow in traditional e-Learning system is given in Fig I.
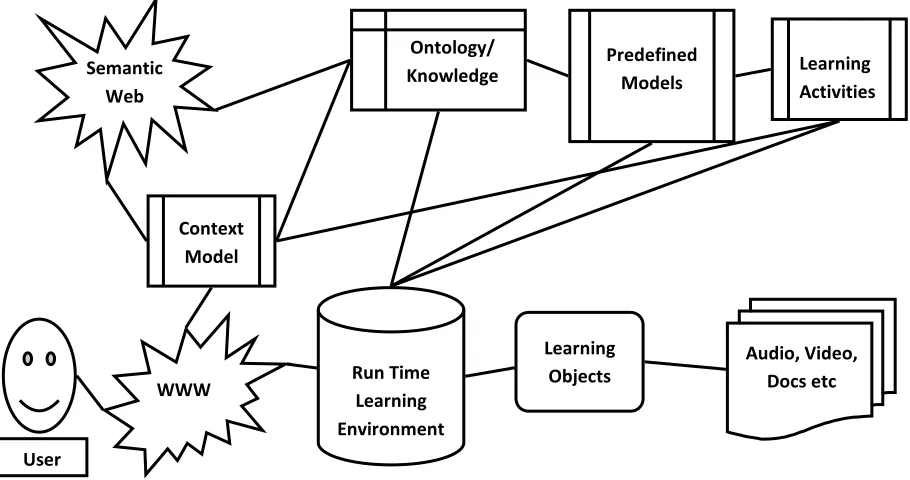
Weihong Huang et. al. has proposed an intelligent semantic e-Learning framework which presents semantic information processing, learning process support and personalized learning support issues in an integrated environment.
In addition to the traditional learning information flow, three new components namely semantic context model, intelligent personal agents and conceptual learning theories are introduced to bring in more intelligence Intelligent personal agents perform adequate personal trait Information profiling and deliver personalized learning services. Semantic context model uses semantic information for static resource and dynamic process retrieves information from WWW and the future Semantic Web, referring to ontologies or knowledge bases. [6] Architecture of the above framework is as given below in Fig II.
User
WWW Context
Model
Run Time Learning Environment
Learning Objects
Audio, Video, Docs etc Ontology/
Knowledge
Base
Learning Activities Predefined
Models Semantic
Web
Available Online at www.ijpret.com 368
4. CLASSIFICATION
Classification may refer to categorization, the process in which ideas and objects are recognized, differentiated, and understood. An algorithm that implements classification, especially in a concrete implementation, is known as a classifier. The term "classifier" sometimes also refers to the mathematical function, implemented by a classification algorithm that maps input data to a category.
In the terminology of machine learning, classification is considered an instance of supervised learning, i.e. learning where a training set of correctly identified observations is available. The corresponding unsupervised procedure is known as clustering or cluster analysis, and involves grouping data into categories based on some measure of inherent similarity (e.g. the distance between instances, considered as vectors in a multi-dimensional vector space).
Classification (also known as classification trees or decision trees) is a data mining algorithm that creates a step-by-step guide for how to determine the output of a new data instance. The tree it creates is exactly that: a tree whereby each node in the tree represents a spot where a decision must be made based on the input, and to move to the next node and the next until one reach a leaf that tells the predicted output. Sounds confusing, but it's really quite straightforward. [7],[8]
4.1 HyperPipes
HyperPipes is a very simple classification algorithm that shares the dual advantages of being both very fast in operation, and able to easily handle large quantities of attributes. It is a very simple algorithm, it has the advantage of being extremely fast and is quite feasible even with an enormous number of attributes. HyperPipes, for discrete classification problems, records the range of values observed in the training data for each attribute and category and works out which ranges contain the attribute values of a test instance, choosing the category with the largest number of correct ranges.
Available Online at www.ijpret.com 369
instance tested would fit into that pipe and would, therefore, be classified by that pipe’s class. Testing on such a dataset would result in a very high recall rate, as every instance that actually was of the diverse class would be correctly identified, but would also yield an equally high false alarm rate, since every instance of a different class would be falsely classified. [7], [9]
4.2 NaiveBayes
NaiveBayes implements the probabilistic NaiveBayes classifier. NaiveBayes Simple uses the normal distribution to model numeric attributes. NaiveBayes can use kernel density estimators, which improve performance if the normality assumption is grossly incorrect; it can also handle numeric attributes using supervised discretization. The Naive Bayesian classifier is based on Bayes’ theorem with independence assumptions between predictors. A Naive Bayesian model is easy to build, with no complicated iterative parameter estimation which makes it particularly useful for very large datasets. Despite its simplicity, the Naive Bayesian classifier often does surprisingly well and is widely used because it often outperforms more sophisticated classification methods.
Its assumption that attributes are conditionally independent given a particular class value means that the overall class probability is obtained by simply multiplying the per-attribute conditional probabilities together (and taking into account the class prior probabilities as well). By default, Weka’s NaiveBayes classifier assumes that the attributes are normally distributed given the class. It is particularly suited when the dimensionality of the inputs is high. Parameter estimation for NaiveBayes models uses the method of maximum likelihood. In spite over-simplified assumptions, it often performs better in many complex real world situations.
Available Online at www.ijpret.com 370
NaiveBayes has advantages (i) Fast to train (single scan). Fast to classify, (ii) Not sensitive to irrelevant features, (iii) Handles real and discrete data, (iv) Handles streaming data well and the disadvantage, assumes independence of features. [10], [11], [12], [13]
5. SYSTEM DESIGN
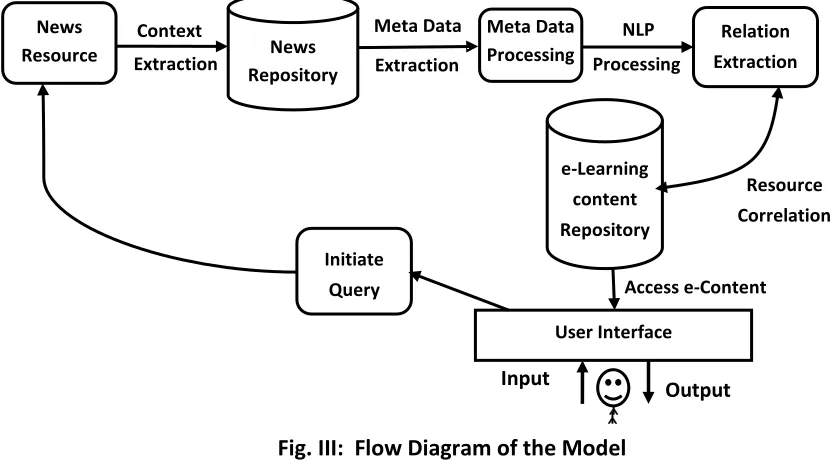
We designed a model based on the machine learning and XML search. In order to co-relate News with the categories a model based on the machine learning and XML search was designed. Flow diagram of the model for news resources is shown below in Fig III.
Fig. III: Flow Diagram of the Model
As an input to the model, various news resources are considered which are available online like the news in Google news repository or online paper like Times of India, Hindustan Times etc. Around 649 news were collected on above repository. In order to extract context from the news and co-relate it with the proper e-content, the News was process with stemming and tokenization on the news contents. The news then was converted into the term frequency matrix for further analysis purpose. Based on this data, features (i.e. metadata) were extracted so that contextual assignment of the news to the appropriate content can be done. This process is known as metadata processing in the flow diagram. Title of the also contains useful information in the abstract form, the title also can be considered as Metadata. The title of the news is processed using NLP libraries (Standford NLP Library) to extract various constituents of it. The output of NLP process was also used to co-relate the News (textual, audio, video) to the concern e-learning contents. This process can be initiated automatically when the user access any content from e-Learning data repository.
Available Online at www.ijpret.com 371
As shown in the figure, a news resource is processed to correlate with the e-Contents available. On the similar way, other text resources can be added directly with the e-Content in the repository, Image or Video resource can be processed for meta-data available. And thus can be searched with the related e-Contents.
6. DATA COLLECTION
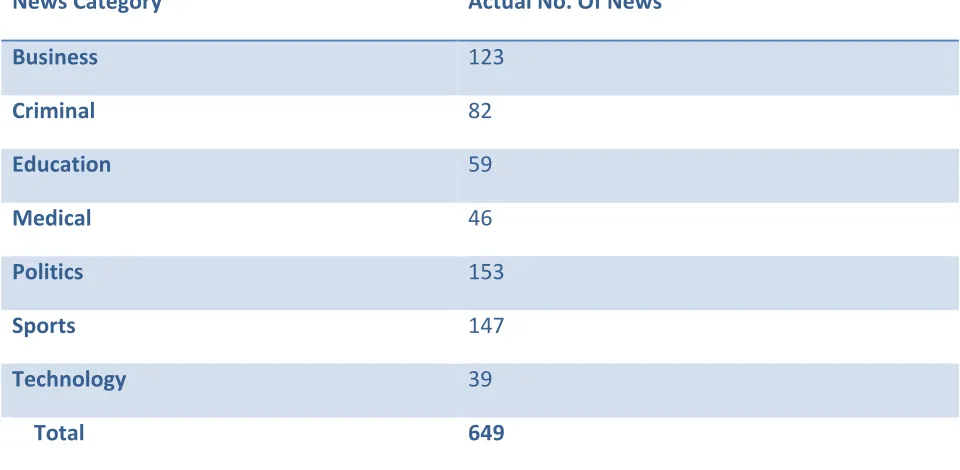
Hence it was proposed to generate indigenous data. Hence the national resources were used for the research purpose. Data for the purpose of research has been collected from the various news which are available in various national and regional newspapers available on internet. They are downloaded and after reading the news they are manually classified into 7 (seven) categories. There were 649 news in total. The details are as shown in Table I.
TABLE I. Categorization Of News
News Category Actual No. Of News
Business 123
Criminal 82
Education 59
Medical 46
Politics 153
Sports 147
Technology 39
Total 649
Available Online at www.ijpret.com 372
Hence, there will be drastic enhancement in e-Contents when we refer to the latest material available in this regards. For example, if some e-Content refers to the political situation of India, then the references needs to be dynamic as the situation may change depending on the result of election.
7. PERFORMANCE ANALYSIS
The News so collected needed a processing. Hence as given in the design phase, all the news were processed for stop word removal, stemming, tokenization and ultimately generated the frequency matrix. Stemming is used as many times when news is printed, for a same there can be many variants depending on the tense used or whether it is singular or plural. Such words when processed for stemming, generates a unique word. Stop words needs to be removed as they do not contribute much in the decision making process. Frequency matrix thus generated can be processed for generating a model and the model so generated was used in further decision process.
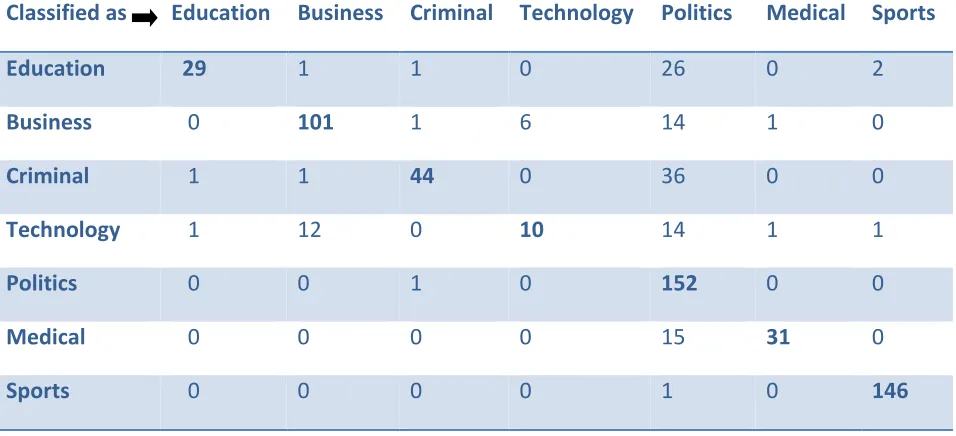
With the model discussed above, two classifier Hyperpipe and Naivebayes were used on the data set of 649 news. For processing Weka APIs were used. The result after processing is given in the form of confusion matrix for test mode i) evaluate on training data and ii) 10-fold cross-validation which is shown in Table II, IV, VI and Table VIII. True Positive and False Positive Rate matrix for test mode i) evaluate on training data and ii) 10-fold cross-validation which is shown in Table III, V, VII and Table IX.
Classified as Education Business Criminal Technology Politics Medical Sports
Education 59 0 0 0 0 0 0
Business 0 123 0 0 0 0 0
Criminal 0 0 82 0 0 0 0
Technology 0 0 0 39 0 0 0
Politics 0 0 0 0 153 0 0
Medical 0 0 0 0 0 46 0
Available Online at www.ijpret.com 373
Table III: Table showing True Positive and False Positive Rate of HyperPipes for Test mode: evaluate on training data
Class TP Rate FP Rate Precision Recall F-Measure ROC Area
Education 1 0 1 1 1 1
Business 1 0 1 1 1 0.997
Criminal 1 0 1 1 1 0.999
Technology 1 0 1 1 1 1
Politics 1 0 1 1 1 0.994
Medical 1 0 1 1 1 1
Sports 1 0 1 1 1 1
Weighted Avg. 1 0 1 1 1 0.998
Table IV: Confusion Matrix for HyperPipes for Test mode: 10-fold cross-validation
Classified as Education Business Criminal Technology Politics Medical Sports
Education 29 1 1 0 26 0 2
Business 0 101 1 6 14 1 0
Criminal 1 1 44 0 36 0 0
Technology 1 12 0 10 14 1 1
Politics 0 0 1 0 152 0 0
Medical 0 0 0 0 15 31 0
Available Online at www.ijpret.com 374
Table V: Table showing True Positive and False Positive Rate of HyperPipes for Test mode: 10-fold cross-validation
Class TP Rate FP Rate Precision Recall F-Measure ROC Area
Education 0.492 0.003 0.935 0.492 0.644 0.936
Business 0.821 0.027 0.878 0.821 0.849 0.948
Criminal 0.537 0.005 0.936 0.537 0.682 0.958
Technology 0.256 0.01 0.625 0.256 0.364 0.941
Politics 0.993 0.214 0.589 0.993 0.74 0.915
Medical 0.674 0.003 0.939 0.674 0.785 0.99
Sports 0.993 0.006 0.98 0.993 0.986 0.997
Weighted Avg. 0.79 0.059 0.835 0.79 0.781 0.954
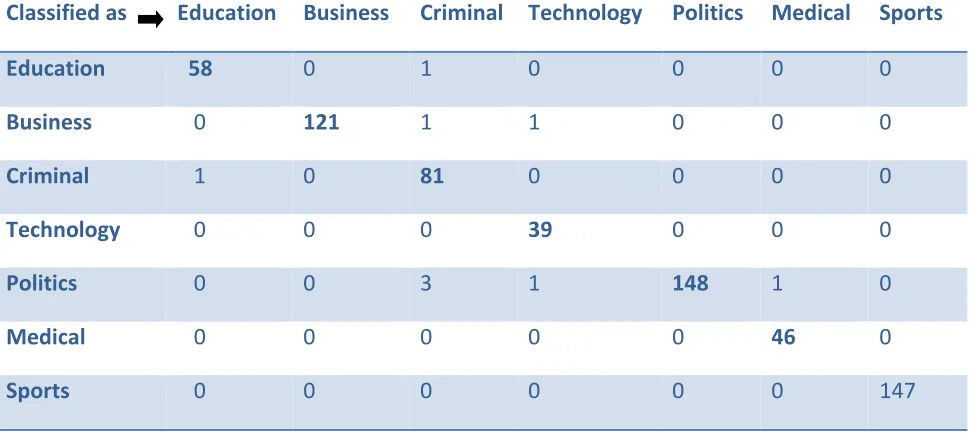
Table VI: Confusion Matrix for NaiveBayes for Test mode: evaluate on training data
Classified as Education Business Criminal Technology Politics Medical Sports
Education 58 0 1 0 0 0 0
Business 0 121 1 1 0 0 0
Criminal 1 0 81 0 0 0 0
Technology 0 0 0 39 0 0 0
Politics 0 0 3 1 148 1 0
Medical 0 0 0 0 0 46 0
Available Online at www.ijpret.com 375
Table VII: Table showing True Positive and False Positive Rate of NaiveBayes for Test mode: evaluate on training data
Class TP Rate FP Rate Precision Recall F-Measure ROC Area
Education 0.983 0.002 0.983 0.983 0.983 0.999
Business 0.984 0 1 0.984 0.992 0.996
Criminal 0.988 0.009 0.942 0.988 0.964 0.997
Technology 1 0.003 0.951 1 0.975 0.999
Politics 0.967 0 1 0.967 0.983 0.999
Medical 1 0.002 0.979 1 0.989 0.999
Sports 1 0 1 1 1 1
Weighted Avg. 0.986 0.002 0.987 0.986 0.986 0.998
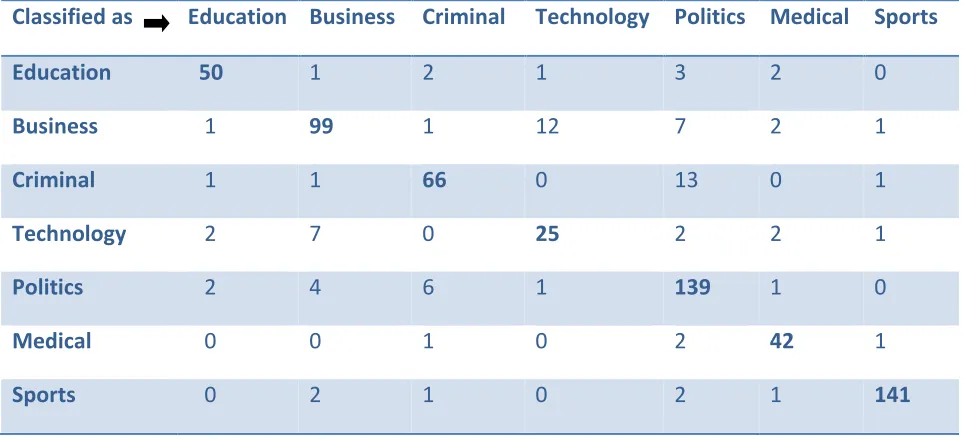
Table VIII: Confusion Matrix for NaiveBayes for Test mode: 10-fold cross-validation
Classified as Education Business Criminal Technology Politics Medical Sports
Education 50 1 2 1 3 2 0
Business 1 99 1 12 7 2 1
Criminal 1 1 66 0 13 0 1
Technology 2 7 0 25 2 2 1
Politics 2 4 6 1 139 1 0
Medical 0 0 1 0 2 42 1
Available Online at www.ijpret.com 376
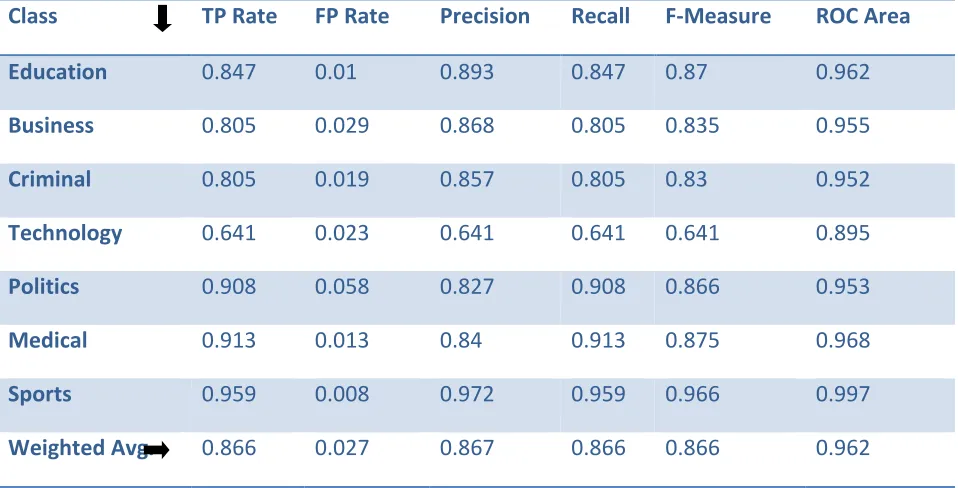
Table IX: Table showing True Positive and False Positive Rate of NaiveBayes for Test mode: 10-fold cross-validation
Class TP Rate FP Rate Precision Recall F-Measure ROC Area
Education 0.847 0.01 0.893 0.847 0.87 0.962
Business 0.805 0.029 0.868 0.805 0.835 0.955
Criminal 0.805 0.019 0.857 0.805 0.83 0.952
Technology 0.641 0.023 0.641 0.641 0.641 0.895
Politics 0.908 0.058 0.827 0.908 0.866 0.953
Medical 0.913 0.013 0.84 0.913 0.875 0.968
Sports 0.959 0.008 0.972 0.959 0.966 0.997
Weighted Avg. 0.866 0.027 0.867 0.866 0.866 0.962
Overall Performance of NaiveBayes algorithm is acceptable, except some of News from Business, Criminal and Politics are classified into other category of News, it can been Table VI for Test mode: evaluate on training data. However from the table VIII some of news from all category are classified into other catgory for Test mode: 10-fold cross-validation. This is because every category has some or other references of the other category.
Available Online at www.ijpret.com 377
validation data. The 10 results from the folds then can be averaged (or otherwise combined) to produce a single estimation
8. CONCLUSIONS
This paper has designed a model which will help the e-Content to refer the latest information in the form of News to get dynamically attached to e-Contents, hence empowering the effectiveness of the e-Learning process by making latest information available to the learner using the framework that we designed.
As per the previous discussion identification of news from dynamic resources can be done with the propose model, we use two classifier i.e. Hyperpipes and Naivebayes to analyze the data sets. As a result it is found that Hyperpipes algorithm performs well in categorizing all the News for Test mode: evaluate on training data. Overall Performance of Naivebayes algorithm is acceptable, except some of News from every category are classified into other category. For overall data set detection rate (True Positive rate) for Hyperpipe is 100% and whereas Naivebayes is 98.6% (for Test mode: evaluate on training data). Hence Hyperpipe is good classifier as compare to Naivebayes classifier.
REFERENCES
1. S. R. Kalmegh, “Successful Assessment of Categorization of Indian News Using JRip and NNge Algorithm”, International Journal of Emerging Technology and Advanced Engineering, ISSN 2250-2459 (An ISO 9001:2008 Certified Journal), Volume 4, Issue 12, December 2014
2. Bassoppo-Moyo, & Temba C., (Retrieved October 28, 2007) “Evaluating e-learning: A front-end, process and post hoc approach.” International Journal of Instructional Media, 33(1), from ProQuest database.
3. Weihong Huang, Alain Mille, “ConKMel: a contextual knowledge management framework to support multimedia e-Learning”, Published online: 8 July 2006, Springer Science + Business Media, LLC 2006
4. SCORM (2003) “Advanced distributed learning initiative, sharable content object reference model (SCORM)”. http://www.adlnet.orgl/
5. LOM (1999) IEEE P1484.12 “Learning object metadata working group, learning object metadata”. http://ltsc.ieee.org/wg12/
Available Online at www.ijpret.com 378
7. Ian H. Witten, Eibe Frank, Mark A. Hall. “Data Mining Practical Machine Learning Tools and Techniques”, Third Edition, Morgan Kaufmann Publishers is an imprint of Elsevier
8. http://en.wikipedia.org/wiki/Classification
9. Zainab Abu Deeb, Thomas Devine, Zongyu Geng, “Randomized Decimation HyperPipes”, ACM, 2010.
10. Friedman N, Geiger D, Goldszmidt M. “Bayesian Network Classifiers”, Mach Learn. 1997;29 :131–163
11. Jason D. M. Rennie, Lawrence Shih, Jaime Teevan, David R. Karger, “Tackling the Poor Assumptions of Naive Bayes Text Classifiers”, Artificial Intelligence Laboratory; Massachusetts Institute of Technology; Cambridge, MA 02139
12. Pat Langley, Stephanie Sage, “Tractable Average Case Analysis of Naive Bayesian Classifiers”, Proceedings of the Sixteenth International Conference on Machine Learning 1999, Pages: 220-228, Morgan Kaufmann Publishers Inc. San Francisco, CA, USA.