BREEDING AND GENETICS
Evaluation of an Exotic Germplasm Population Derived from Multiple Crosses
among Gossypium Tetraploid Species
Linghe Zeng*, William R. Meredith, Deborah L. Boykin, and Earl Taliercio
L. Zeng, W. R. Meredith, D. L. Boykin, USDA-ARS, Crop Genetics and Production Unit, Stoneville, MS 38776; E. Taliercio, Soybean and Nitrogen Fixation Research Unit, USDA-ARS, 3127Ligon St., Raleigh, NC 27685 *Corresponding author: linghe.zeng@ars.usda.gov
ABSTRACT
Broadening the genetic base of upland cotton (Gossypium hirsutum L.) is essential for
continu-ous genetic improvement of yield and fiber quality
through breeding. The objectives of this study were to evaluate a species polycross (SP) popula-tion for phenotypic and genotypic variapopula-tions in
yield and fiber quality, investigate morphological variations among the SP lines, and analyze the interrelationships among yield, yield components, and fiber properties. A population was developed
by crossing cultivars and strains of G. hirsutum with the other tetraploid species in the genus. This SP population underwent 11 yr of random mating by natural pollination in an isolated environment
with high bee activity followed by 12 yr of selfing. The experiment was conducted at two field loca
-tions with two replicates each. Two hundred and sixty lines of the SP population were evaluated
with five commercial cultivars. Genotypic varia
-tion was significant (P < 0.01) for all characters of
yield and fiber quality. Although a highly signifi -cant (P < 0.01) interaction between genotype and
location was identified for fiber strength and most yield parameters, the interaction components
were small relative to the genotypic components. There was large variation among the SP lines for
nectary size, gland content in leaves, pubescence, leaf cut depth, plant height, leaf area, leaf length, and node number of the first fruiting branch.
Span length (50%) contributed more variation to
fiber strength than span length (2.5%) in the SP
population. Lint yield was negatively correlated
with short fiber content. It is concluded that the
SP population is a useful germplasm for genetic
improvement of lint yield and fiber quality.
T
he U.S. cotton production and textile industry underwent dramatic changes in recent yearsunder the influence of the global cotton market. Domestic demand for cotton by the U.S. textile industry declined from 11.3 million bales in 1997
to 6.2 million bales in 2004 (USDA-FAS, 2004). Cotton production in the United States has become
dependent on exports, which increased from 40% in 1997 to 70% in 2006 (Adams, 2006). The surviving U.S. textile industry faces a challenge to
improve its competitiveness and increase domestic demand. In the recent years, the industry integrated new technology, such as open-end and air-jet looms, that increased spinning speed about 3 to 6 times (Felker, 2001). Modernizing equipment will
no doubt improve production efficiency and the competitiveness of U.S. textile products. It also raised the requirements for fiber quality to maximize the efficiency of high spinning equipment. The new technology requires stronger and longer fibers and fewer short fibers. The pressure to improve fiber quality of U.S. cotton also comes from international customers who require high fiber quality with less short fiber content. Unfortunately, high yield
cultivars in the United States do not possess high
fiber quality that can meet these standards. Cotton
breeders may not have done enough to improve
U.S. cotton in the past. In reference to that lack of
improvement, one industrial representative stated,
“we have had to compromise on the quality of raw
cotton” (Felker, 2001, p. 5).
Fiber quality, especially strength and length, can
only be effectively improved through genetic breed
-ing. This is evidenced by high heritability of fiber
quality reported in previous studies. In those studies,
heritability for fiber strength and length ranged from 0.52 to 0.90 and 0.46 to 0.79, respectively (Al-Ji
-bouri et al., 1958; Miller et al., 1958; Al-Rawi and Kohel, 1969; Baker and Verhalen, 1973). Genetic
diversity in cultivated cotton, however, is generally
considered limited (May et al., 1995; Esbroeck and Bowman, 1998; McCarty et al., 2005). It is essen
quality. Exploration and introduction of novel genes from exotic germplasm can be a major approach for
broadening the genetic base in upland cotton.
Based on the genomic affinities among the species of Gossypium, Stewart (1994) classified the germ -plasm pools within the genus into three categories: primary, secondary, and tertiary. Based on his
classi-fication, the primary pool includes the species that can be easily crossed and produce highly fertile hybrids.
All tetraploid species belong to this group. The germ-plasm resources in this group can be relatively easily utilized in the breeding programs in upland cotton.
The crosses of the species in secondary and tertiary pools with upland cotton usually generate low fertile
hybrids, unless special manipulation is involved. Land
races of G.hirsutum and wild tetraploid species have
been used in breeding to transfer desirable morpho
-logical characters, such as nectariless and smooth leaf (Meyer and Meyer, 1961; percy and Kohel, 1999), and
disease and insect resistance genes, such as bacterial blight resistance, boll worm resistance, and Fusarium
wilt resistance, into upland cotton (Meredith, 1991; Stewart, 1994).
overall, the number of successful cultivars with an exotic germplasm background is small. lack of
adaptability to environments and appropriate
evalu-ation of existing germplasm resources are two major reasons for their limited use in breeding (McCarty et al., 1996; Esbroeck and Bowman, 1998). McCarty et al. (1979) incorporated day-neutrality genes into
tropical germplasm accessions through back-crossing.
The incorporation of day-neutral genes into primitive landraces has facilitated the use of this germplasm;
however, the conversion requires many generations
of crosses and selection for day-neutral genes and the subsequent recovery of primitive genes. furthermore, linkage drag could reduce the originality of the land
-races during the introgression of day-neutral genes (Zhong et al., 2002). The exploration of regionally adapted germplasm derived from wide crosses could be an alternative approach to the utilization of the
exotic germplasm resources in breeding.
Yield of cotton can be determined by boll
number per unit area, boll size, and lint percentage
(Worley et al., 1974; Culp and Harrell, 1975) or by
boll number per unit area, seeds per boll, and lint
per seed (Coyle and Smith, 1997). lint percentage is critical for maintaining high lint yield (Culp and Harrell, 1975) and is largely related to boll size and seed size. High lint percentage can be maintained by selecting for maximum seed surface per unit area
(Coyle and Smith, 1997). Yield can be increased by
increasing boll number per unit area, seed number
per boll, and seed surface per unit seed weight. Inter
-relationships between lint yield and fiber quality have been studied extensively (Miller et al., 1958; Stewart and Kerr; 1974; Culp and Harrell, 1975; Scholl and Miller, 1976; Wilson et al., 1994; McCarty et al., 1996; Smith and Coyle, 1997). The interrelation
-ships between yield parameters and fiber properties
are complicated. Generally, a negative correlation
between lint yield and fiber strength has been shown
in these studies. The correlation between lint yield and lint percentage, bolls per plant, micronaire, and
fiber elongation is positive, while the correlation
between lint yield and boll weight and seed index
is negative. Genetic correlation of lint percentage
with lint yield and bolls per plant was determined to be 0.80 and 0.48, respectively, while that with seed
index, boll weight, fiber strength, fiber length, and fineness was -0.60, -0.36, -0.12, -0.52, and -0.31, respectively (Miller et al., 1958). The mechanism
underlying genetic correlation could be either
link-age or pleiotropy (Meredith, 1984).
The objectives of this experiment were to evalu
-ate the phenotypic and genotypic variation of yield, yield components, and fiber properties; to investigate phenotypic variation of morphological characters;
and to analyze interrelationships among yield, yield
components, and fiber properties in a regionally
adapted exotic germplasm population.
MATERIAL AND METHODS
An exotic germplasm population was obtained
from p.A. Miller who initiated the study in 1967. The
population was developed by crossing twelve
culti-vars of G. hirsutum and strains with four tetraploid species: G. barbadense L., G. tomentosum Nutt., G. mustelinum Watt., and G. darwinii Watt. The entries in G. hirsutum include four commercial cultivars, Auburn M., Carolina Queen, Stoneville 213, and
Deltapine Smooth leaf, and eight strains, TH 149-20, pD 2165, Coker 413, Ga. H.T., Atlas (AxC)-261, Deltapine 523, Mo. 61-470, and Stoneville 508-9117. All the strains except Stoneville 508-9117 have
genetic background of Beasely’s Triple hybrid [(G. arboreum L. x G. thurberi L.) x G. hirsutum] and
contributions from G. barbadense. All the entries in G. hirsutum were evaluated in Regional Variety Tests at multiple locations in the United States during
used in the crosses as parents and the crossing
pat-tern are unknown. All 12 entries of G. hirsutum and
the other four tetraploid species were involved in
the initial crosses and the subsequent development
of the population. Seeds of the f2 were produced in
a winter nursery located in Mexico and planted in
1968 in a small isolated field surrounded by woods
in Raleigh, NC. Bee activity was known to be high
in the area. from 1968 to 1978, the population was maintained by natural pollinations. observations were made in the field, and natural crosses were estimated to exceed 50%. In 1979, a sub-sample of
this population was grown at Stoneville, MS, under
a predominately self-pollinating environment. The
population (2,000 plants) was maintained and
ad-vanced by harvesting one boll from each plant and bulking the harvested bolls for planting the next
generation. The population was planted in this way almost every other year until 2004. As a result, the population planted in 2004 underwent random
mat-ing for 11 generations and predominantly selfmat-ing for
12 generations. In 2004, 260 plants were randomly
chosen and 15 to 20 bolls were collected from each plant. The seeds from each plant were planted as one
line in 2005 in the evaluation trial.
Two hundred and sixty lines were planted in
fields for germplasm evaluation at Stoneville, MS, in the summer of 2005. The experimental design
was a randomized complete block with two loca-tions and two replicates at each location. Five cultivars, Deltapine 555BR (DP555BR; Delta Pine
and land Co.; Scott, MA), Stoneville 4892BR (ST4892BR; Stoneville pedigreed Seed; Memphis,
Tn), fiberMax 960B2R (fM960B2R; Bayer Crop
Sciences; Research Triangle Park, NC), Phytogen
72 (pHY72; phytogen Seed Co.; Indianapolis, In),
and Paymaster 2167R (PM2167R; Delta Pine and Land Co.), used as standards in the National Cotton
Variety Trial, were also planted as checks with four
replicates at each location. The germplasm lines and cultivars were grown in single-row plots, each 4.57 m long on a 1.0-m row spacing. Soil types were
Beulah fine sandy loam (a coarse-loamy, mixed, active, thermic Typic Dystrochrepts) for location 1 and Bosket fine sandy loam (a fine-loamy, mixed,
active, thermic Mollic Hapludalf) for location 2. Seeds were planted on 19 Apr. 2005 at location 1 and 5 May 2005 at location 2. plant stand of each
plot was counted and recorded. The plant stand
ranged from 25 to 70 plants plot-1. Plots were
thinned to 25 to 40 plants plot-1.
At harvest, 30 bolls from each plot were sampled
by hand. The samples from individual plots were ginned separately using a laboratory saw gin. Seed
weight and lint weight from the sample of each plot were measured and recorded. Remaining bolls from
each plot were also harvested by hand to determine
yield. Seed cotton weight of plots was measured and
recorded individually. The total seed cotton weight
of each plot was calculated as sum of the seed cot
-ton weight of the sampled bolls and the remaining
bolls in that plot. Yield parameters were calculated
from these measurements: lint percentage = (100) (the lint weight from the sample/seed cotton weight of the sample); boll weight = seed cotton weight per sample/30; lint weight per seed = lint weight per sample/[(seed weight per sample)/(seed index)]; seeds per boll = [(seed weight per sample)/(seed index)]/30; lint yield per plot = (seed cotton weight per plot)(lint percentage). Twenty to twenty-five grams of lint were submitted to Starlab, Knoxville, Tn, for Breeder’s Analysis of fiber quality. fiber strength was measured as the force per tex required to break a bundle of fibers. Elongation was the per
-centage of elongation at the point of break in strength
determination. Fiber span lengths were measured as
the average length of the longest 50 and 2.5% of the fibers scanned. fibers were also analyzed for mean short fiber content using the Automated fiber Infor
-mation System (AfIS). Mean short fiber content is the percentage by weight of the fibers that are less than 12.7 mm. fiber fineness and maturity were measured separately using AfIS in that fineness was the weight of fibers per unit of length in millitex, and maturity ratio was the proportion of mature fibers to the immature fibers.
Eight morphological characters, nectary size,
gland content in leaf, pubescence, node of the first fruiting branch, cut depth in leaf, plant height, leaf length, and leaf area, were measured in all plots. Gland content in leaf was estimated by counting the number of glands per unit leaf area under a biological microscope at peak flowering. In doing so, a young leaf from the top of the plant was collected from each plot. A field of vision under the microscope was
randomly chosen along the main vein on the leaves using a circle with known diameter on a stage microm-eter. The glands were counted within the circle. The measurements were conducted the same way on top,
middle, and bottom along the main vein of each leaf,
respectively. The readings were averaged across the
scored among the plots according to a rating system
(Bourland et al., 2003) as follows: 1-pilose, 2-very
hairy, 3-hairy, 4, 5-intermediate, 6-nearly smooth,
7-very smooth. The depth of leaf cut was scored among the plots according to a rating system as follows: 1=0 to 25%, 2=25 to 50%, 3=50 to 75%, and 4=75 to 100%. leaf area was measured on the fourth fully extended leaf from the top of a plant using a li-3100 Area Me
-ter (lI-CoR Inc.; lincoln, nE) at the stage of peak flowering. leaf samples of five plants from each plot were scanned as one measurement of leaf area. The readings were averaged for each plot. nodes of the first fruiting branch were counted as the node number
above the cotyledon node on the main stem.
The GlM procedure of the Statistical Analysis
System (version 6; SAS Institute; Cary, NC) was used
for analysis of variance on all data. A mixed model was used with germplasm lines as the random effect and location as the fixed effect. Correlation between yield and fiber quality was analyzed with a linear re -gression model. Genetic correlation (Rg) among yield parameters and fiber properties were calculated using the equation described by Kempthorne (1957):
Rg = σgxy / (σ2g x σ2gy)1/2, σ2g x = 1/r (Vx – Vex), σ2gy = 1/r (Vy – Vey), σgxy
= 1/r (Covxy – Covexy)
where σgxy is the genetic component of covariance between variable x and y; σ2
g x and σ2gy are genetic components of variance for x and y, respectively; Vx and Vy are variances of x and y, respectively; Vex and Vey are errors for x and y, respectively; r is the number of replicates. locations were treated as replicates for the calculation of genetic correlation. Variance and covariance for yield parameters and fiber properties were calculated by creating a matrix using MAnoVA statement in pRoC GlM procedures (SAS Institute).
The significance of Rg was not determined, because there was no adequate probability table available for a statistical test of genetic correlation. The means of the Sp population were compared with the averages of
the cultivars using t-tests assuming unequal variances
in the Sp population and cultivars. Mean squares of the G x l interaction in the Sp population (df = 1040) and cultivars (df = 40) were used as experiment errors to test significance in the t-tests.
RESULTS
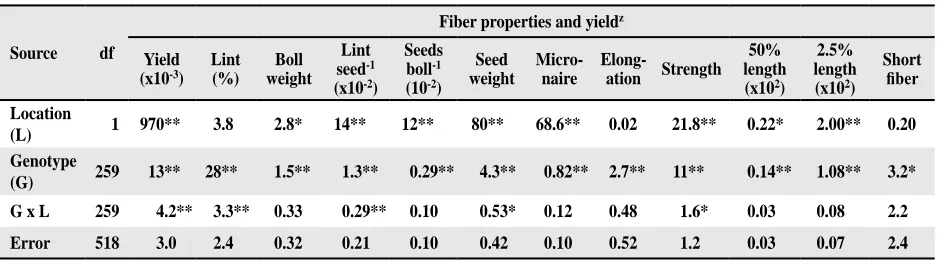
Mean squares for yield, yield components, and fiber properties of the Sp population are given in Table 1. Genotype (G) effects were highly significant
(P < 0.01 or 0.001) for all characters. Mean squares
of location (l) were large relative to the G and G x l interaction for yield and yield components
except lint percentage. The G x L interaction was
highly significant (P < 0.01 or 0.001) for yield, lint percentage, lint/seed, and seed weight. The mean
squares of location for fiber properties were similar to those for genotype except micronaire, which was over 80 times greater than that of genotype. The G x l interaction was not significant for most fiber properties, but was highly significant (P < 0.01) for
fiber strength. The G x l interaction for fiber strength,
however, was small relative to the genotype, only
0.15 times as large as the genotypic effect.
The averages of lint yield and fiber properties for the five cultivars are given in Table 2. The two Mid-south cultivars, Dp555BR and ST4892BR, averaged 395.5 g/plot for yield, 201 kn m kg-1 for
fiber strength, 13.8 for 50% span length, 28.4 mm for 2.5 % span length, and 5.93% for short fiber con
-tent. The average yield of the two high fiber quality cultivars, fM960B2R and pHY72, was 247 g/plot, 38% less than the average between Dp555BR and
Table 1. Mean squares of genotype and location for yield and fiber properties in species polycross (SP) population
Source df
Fiber properties and yieldz
Yield
(x10-3)
Lint (%)
Boll weight
Lint
seed-1
(x10-2)
Seeds
boll-1
(10-2)
Seed weight
Micro- naire
Elong-
ation Strength
50% length
(x102)
2.5% length
(x102)
Short
fiber
Location
(L) 1 970** 3.8 2.8* 14** 12** 80** 68.6** 0.02 21.8** 0.22* 2.00** 0.20
Genotype
(G) 259 13** 28** 1.5** 1.3** 0.29** 4.3** 0.82** 2.7** 11** 0.14** 1.08** 3.2*
G x L 259 4.2** 3.3** 0.33 0.29** 0.10 0.53* 0.12 0.48 1.6* 0.03 0.08 2.2
Error 518 3.0 2.4 0.32 0.21 0.10 0.42 0.10 0.52 1.2 0.03 0.07 2.4
ST4892BR. The fiber strength of these two cultivars
averaged 242 kN m kg-1, 20% higher than the two Mid-south cultivars. fiber length of the two high quality cultivars averaged 14.3 and 29.9 mm for 50% span length and 2.5% span length, respectively. Short fiber content averaged 5.17 % between the two high quality cultivars, 12.8 % less than the average of the
two Mid-south cultivars. Moderate lint yield and low
fiber strength and span length were observed in Acala
type cultivar, PM2167R. These results indicated a general negative association between lint yield and
fiber quality. Yield parameters and fiber properties
in the SP population were compared with the culti-vars using t-tests assuming unequal variances in SP
population and cultivars (Table 2). The means of the Sp population for micronaire, fiber strength, and 50% span length were significantly (P ≤ 0.01) different
from the averages of the five cultivars. There was a
significant (P ≤ 0.01) difference between Sp popu
-lation and the cultivars for all lint yield characters
except seeds per boll. There was a wide variation
among Sp lines for these parameters. lint percentage was significantly lower in the Sp population than the average of the standards, while seed weight and boll weight were significantly higher than the standards. Generally, wide ranges were identified for all the
characters analyzed in the SP population.
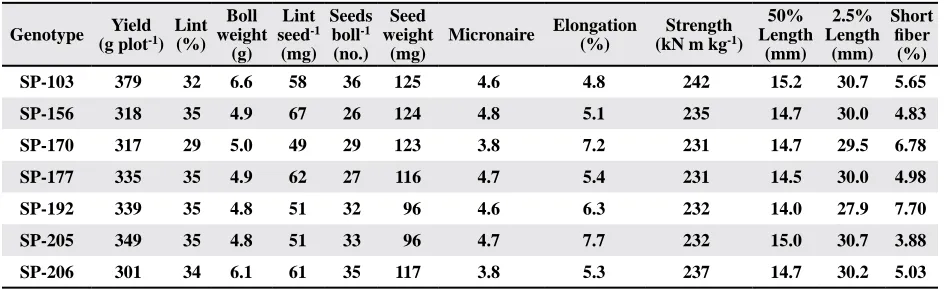
Seven of the Sp lines with lint yield greater than
300 g plot-1 and fiber strength greater than 230 kn
m kg-1 were identified as elite genotypes (Table 3). All these lines performed good with yield ranging
from 301 to 379 g plot-1 and fiber strength ranging from 231 to 242 kn m kg-1. Among them, SP-103 performed the best with 379 g plot-1 for yield, 38% higher than fM960B2R, and 242 kN m kg-1 for fiber strength, 4% higher than fM960B2R.
Table 2. Means and ranges of yield parameters and fiber properties in species polycross (SP) population and cultivars
Source
Fiber properties and yield parameters z
Yield
(g plot-1)
Lint (%)
Boll weight
(g) Lint
seed-1
(mg) Seeds
boll-1
(no.) Seed weight
(mg)
Micronaire Elongation
(%)
Strength
(kN m kg-1)
50% Length
(mm)
2.5% Length
(mm) Short
fiber
(%)
DP555BR 427 41 4.6 54 35 76 4.5 5.3 199 13.5 28.5 6.28
ST4892BR 364 38 4.8 61 30 102 4.4 6.2 203 14.0 28.2 5.58
PM2167R 291 36 5.0 52 34 95 4.5 6.5 202 13.2 25.7 5.26
FM960B2R 275 35 5.2 58 32 106 3.9 5.1 232 14.0 29.5 4.94
PHY72 219 36 4.8 53 33 94 4.1 7.0 252 14.5 30.2 5.39
Cultivars 315 37.2 4.9 55.6 32.8 95 4.3 6.0 218 13.7 28.5 5.49
SP 279*** 32*** 5.5*** 53** 33 113*** 4.1** 6.1 211*** 14.0*** 28.5 5.52
SP range 161-479 25-42 3.8-9.3 39-80 26-42 90-140 3.1-5.9 4.3-8.5 177-255 12.5-15.3 24-33 3.9-8.5
z Values followed by **, *** are significantly different at P < 0.01, P < 0.001, respectively, in t-test comparisons for SP
mean vs. cultivar average. Mean squares of the G x L interaction in the SP population (df = 1040) and cultivars (df = 40)
were used as variances in the t-tests.
Table 3. Means of yield, yield components, and fiber properties in seven SP linesz
Genotype Yield
(g plot-1)
Lint (%)
Boll weight
(g) Lint
seed-1
(mg) Seeds
boll-1
(no.) Seed weight
(mg)
Micronaire Elongation
(%)
Strength
(kN m kg-1)
50% Length
(mm)
2.5% Length
(mm) Short
fiber
(%)
SP-103 379 32 6.6 58 36 125 4.6 4.8 242 15.2 30.7 5.65
SP-156 318 35 4.9 67 26 124 4.8 5.1 235 14.7 30.0 4.83
SP-170 317 29 5.0 49 29 123 3.8 7.2 231 14.7 29.5 6.78
SP-177 335 35 4.9 62 27 116 4.7 5.4 231 14.5 30.0 4.98
SP-192 339 35 4.8 51 32 96 4.6 6.3 232 14.0 27.9 7.70
SP-205 349 35 4.8 51 33 96 4.7 7.7 232 15.0 30.7 3.88
SP-206 301 34 6.1 61 35 117 3.8 5.3 237 14.7 30.2 5.03
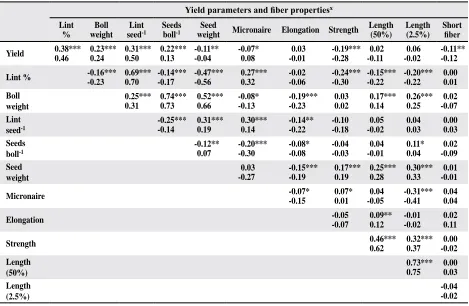
Correlation and genetic correlation between
yield parameters and fiber properties are given in
Table 4. Lint yield was positively correlated with all yield components analyzed except seed weight.
Highly significant (P < 0.001) negative correlation
was identified between lint yield and fiber strength.
Lint yield was also negatively correlated with
micronaire and short fiber content at P < 0.05 and 0.01, respectively. Lint percentage was negatively correlated with boll weight and seed weight, but positively correlated with lint per seed. Negative
cor-relation between lint percentage with fiber strength and with fiber lengths was also highly significant
(P < 0.001). Although fiber strength was positively
correlated with both properties of span lengths, higher correlation was observed with 50% span length than 2.5% span length. Genetic correlation of fiber strength with 50% span length was nearly double of that with 2.5% span length. Micronaire was significantly (P < 0.001) negatively correlated
with 2.5% span length, but not correlated with 50%
span length. There was no correlation between span
length and short fiber content.
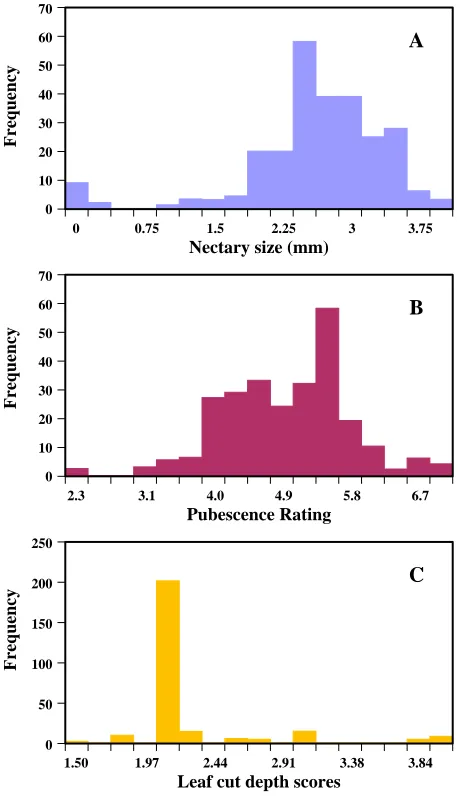
Eight morphological characters, nectary size,
gland content in leaf, leaf pubescence, node number of the first fruiting branch, plant height, leaf area, leaf length, and leaf cut depth, were analyzed in the Sp population (Table 5; fig. 1). The means of the
individual lines were calculated across locations
and replicates. There were nine lines identified as nectariless (fig. 1A). Although the mean of gland
content in the SP population was 121glands/cm2, a wide range of densities was identified among the
lines (Table 5). The gland content in one line was
as low as 29 glands/cm2, and another one as high as
175 glands/cm2. Most lines were scored 4 to 5 for
pubescence (intermediate pubescent), while nine lines scored greater than 6.5 (very smooth) (Fig. 1B).
Most lines were scored as normal (25-50% depth of leaf cut), while 29 were scored as okra leaf (> 50% depth of leaf cut) (fig. 1C). Wide variations were also identified for plant height, ranging from 119 to 175 cm, leaf area of 4th fully extended leaf, ranging from 79 to 196 cm2, leaf length, ranging from 10.1 to 17.9 cm, and node number of the first fruiting branch,
ranging from 5.5 to 11.8 (Table 5).
Table 4. Correlation and genetic correlation coefficients between yield parameters and fiber properties in SP population Yield parameters and fiber propertiesx
Lint %
Boll weight
Lint
seed-1 Seeds boll-1 weightSeed Micronaire Elongation Strength Length (50%) Length (2.5%) Short fiber
Yield 0.38*** 0.46 0.23*** 0.24 0.31*** 0.50 0.22*** 0.13 -0.11** -0.04 -0.07* 0.08 0.03 -0.01 -0.19*** -0.28 0.02 -0.11 0.06 -0.02 -0.11** -0.12
Lint % -0.16***
-0.23 0.69*** 0.70 -0.14*** -0.17 -0.47*** -0.56 0.27*** 0.32 -0.02 -0.06 -0.24*** -0.30 -0.15*** -0.22 -0.20*** -0.22 0.00 0.01 Boll weight 0.25*** 0.31 0.74*** 0.73 0.52*** 0.66 -0.08* -0.13 -0.19*** -0.23 0.03 0.02 0.17*** 0.14 0.26*** 0.25 0.02 -0.07 Lint seed-1 -0.25*** -0.14 0.31*** 0.19 0.30*** 0.14 -0.14** -0.22 -0.10 -0.18 0.05 -0.02 0.04 0.03 0.00 0.03 Seeds boll-1 -0.12** 0.07 -0.20*** -0.30 -0.08* -0.08 -0.04 -0.03 0.04 -0.01 0.11* 0.04 0.02 -0.09 Seed weight 0.03 -0.27 -0.15*** -0.19 0.17*** 0.19 0.25*** 0.28 0.30*** 0.33 0.01 -0.01 Micronaire -0.07* -0.15 0.07* 0.01 0.04 -0.05 -0.31*** -0.41 0.04 0.04 Elongation -0.05 -0.07 0.09** 0.12 -0.01 -0.02 0.02 0.11 Strength 0.46*** 0.62 0.32*** 0.37 0.00 -0.02 Length (50%) 0.73*** 0.75 0.00 0.03 Length (2.5%) -0.04 -0.02
x Values followed by *, **, *** are significantly different at P < 0.05, P < 0.01, P < 0.001, respectively, df = 1038 (error).
DISCUSSION
The highly significant genotypic effects for all
characters analyzed in the SP population indicate large genetic variability exists in this germplasm. SP germplasm is a unique population with contribution
of genes from all tetraploid species in Gossypium and
from commercial cultivars and strains in G. hirsutum
with genetic backgrounds from a triple hybrid. The purpose of inter-crosses in creating this population
was to break linkage blocks that have limited the
success of simultaneous improvement of yield and fiber quality. The population underwent a period of random mating followed by a period of selfing. It
is expected that a random mating population has
been established after 11 generations of extensively
natural crosses, and homozygosity has been nearly
completed within lines after years of selfing. Visual observation of plants in fields showed a high degree of uniformity within a progeny row.
lack of a significant G x l interaction for most fiber properties in this study is consistent with previ
-ous studies (Miller et al., 1959; Abou-El-fittouh, et al., 1969; Bridge et al., 1969; Murray and Verhalen, 1970; May and Taylor, 1998; May and Jividen, 1999). Even for the significant G x l interaction for fiber strength, the effect is only 15% of that for genotypic effect. Environments at the two locations were dif
-ferent as evidenced by the difference in lint yield between locations, averaging 309 and 248 g plot-1 for location 1 and location 2, respectively. A highly significant G x l interaction was observed for lint
yield and most yield components in this population.
The significant G x l interaction for yield indicates that the two environments resulted in differential
growth and development across genotypes. The interaction components, however, were small
compared with the genotypic components for these
characters, so it would be reasonable to emphasize
general adaptability in the development of cultivars
when this germplasm resource is used in breeding. Although the interactions between genotype and year were not estimated in this study, the variations in these interactions may be similar to the variations observed in the G x L interaction within one year
(Meredith, 1984), since highly significance differ -ences (P < 0.001) between locations were identified
for all characters. Considering the cost and time,
evaluation at multiple locations in one year should
provide enough information on the total variation
in this germplasm. Table 5. Means, standard deviations, and the ranges of five mor
-phological characters in the species polycross population
Plant height (cm)
Leaf area
(cm2) x
Leaf length (cm)
Node
numbery
Gland content
(no. cm-2) z
Means 149 ± 14 142 ± 25 13.0 ± 1.8 7.92 ± 1.86 121 ± 33
Range 119 - 175 79 - 196 10.1 – 17.9 5.5 – 11.8 29.2 – 175
x Leaf area was measured from the fourth fully extended
leaf on the top of the main stem.
y Node number above the cotyledon and bellow the first fruiting branch.
z Gland content in leaf was measured as the number of
glands in the third fully extended leaf on the top of the
main stem at peak flowering.
Fig. 1. Means of nectary size (A), pubescence (B), and scores of leaf cut depth (C), and their distribution among species
polycross lines. Pubescence was scored according to a
rat-ing system: 1-pilose, 2-very hairy, 3-hairy, 4, 5-intermedi
-ate, 6-nearly smooth, 7-very smooth. Leaf cut depth was scored according to a rating system: 1=0-25%, 2=25-50%, 3=50-75%, and 4=75-100%
70 60 50 40 30 20 10
0 0.75 1.5 2.25 3 3.75
0
Frequency
Nectary size (mm)
A
70 60 50 40 30 20 10
2.3 3.1 4.0 4.9 5.8 6.7
0
Frequency
Pubescence Rating
B
250
200
150
100
50
0
1.50 1.97 2.44 2.91 3.38 3.84
Frequency
Leaf cut depth scores
Yield components and fiber properties in the Sp population were compared with a group of standard cultivars used in the national Variety Test. Means of most fiber properties analyzed in the Sp popula
-tion were significantly different from the averages of the standard cultivars. fiber strength in the Sp
population was higher than in the high yielding standard cultivars. More importantly, there were
wide ranges of mean values among Sp lines for yield components and fiber properties. The ranges were 161 to 479 g plot-1 for lint yield, 177 to 255 kn m
kg-1 for fiber strength, and 12.5 to 15.3 mm for 50% span length, and 24 to 33 mm for 2.5% span length. Although the mean of yield in the Sp population was
lower than the high yielding cultivars, DP555BR
and ST4892BR, it was 27% higher than pHY72 and not different from fM960B2R. These results suggest that the Sp population is a useful germplasm resource for genetic improvement of both lint yield and fiber quality.
lint yield and fiber strength are two major goals
in upland cotton breeding; however, the association between these two traits is generally negative (Miller
and Rawling, 1967; Meredith and Bridge, 1971; Smith and Coyle, 1997). It appears that the continu
-ing improvement of fiber strength would be limited by the yield compensation. The exploration of novel genes in exotic germplasm and further incorporation of these genes into cultivars will help breeders im
-prove genetic potentials for both lint yield and fiber
quality in upland cotton. Seven SP lines have shown
good performance in both yield and fiber quality.
These lines averaged 334 g plot-1 for lint yield, 234
kN m kg-1 for fiber strength, 29.9 mm for span length
(2.5%), and 5.55% for short fiber content. The seven
lines are comparable with high yielding cultivars,
ST4892BR and Dp555BR, in yield and high quality cultivars, fM960B2R and pHY72, in fiber quality. These facts indicate that 11 generations of random
intermating may have broken linkage blocks to some degrees in the SP population.
The positive correlation between lint yield with lint percentage, boll weight, lint per seed, and seeds per boll in this study are in agreement with
previous reports (Worley et al., 1974; McCarty et al., 1996; Wu et al., 2004). The results indicate that
these yield components are major contributors to
the total variation of lint yield. The interrelationship between yield parameters and fiber properties is
complicated. As expected, the correlation between
lint yield and fiber strength is negative. In contrast, a significant negative relationship between lint yield and fiber span length was not detected. This may be explained by the complicated relationship of fiber length with different yield components. fiber span
length is negatively correlated with lint percentage, but positively correlated with boll weight, so the
relation between lint yield and fiber length is con
-founded by the different relation of the two yield components with fiber length. lint percentage was negatively correlated with fiber strength and span length. The mean of lint percentage in the Sp popula
-tion was significantly lower than the average of the
standard cultivars, while boll weight and seed weight are higher than the cultivars. This phenomenon is in agreement with a previous study (Blanche et al.,
2006) in which lower lint percentage was identified
in the genotypes with higher seed size. These results suggest that lint percentage should be emphasized
in the breeding programs for genetic improvement of fiber quality when a Sp population is used. Span length (50%) contributed more to the variation of fiber strength than span length (2.5%). The genetic correlation of strength with span length (50%) is almost twice of that with span length (2.5%). Micro
-naire is negatively correlated with 2.5% span length, while not significantly correlated with 50% span
length. Since micronaire is an important criterion
for selection, 50% span length should be emphasized more than 2.5% span length in the breeding with the
SP germplasm. Although the correlation is not high, the negative correlation between lint yield and short
fiber content is interesting. This implies that there would be no yield penalty, if Sp germplasm is used to improve this fiber property. The lack of correlation between span lengths and short fiber content implies that the selection on one of these characters would not affect the other one, so both of these properties
should be included in breeding. Although the under-lying physiological and genetic basis is unknown, it
is assumed that the partition of carbohydrate among yield components in Sp population may be different from that in most Mid-south cultivars.
Contributions of the morphological traits, such as nectariless, gland content, smooth-leaf, and okra-leaf, to yield in cotton have been studied for decades and
results were documented and incorporated into cotton
breeding programs (Kohel, 1974; Wilson and George, 1982; Wilson, 1987; Wilson, 1989; Calhoun, 1997;
contributions of nectariless and gland content to yield
are mainly due to insect resistance in plants
possess-ing these genes. The improvement of yield related to smooth-leaf is due to reduction in trash during ginning and lower populations of Bemisia tabaci Genn., while
those of okra-leaf are due to earliness and resistance to boll rots and pink bollworm. The other four char
-acters, plant height, leaf area, leaf length, and node number of the first fruiting branch, analyzed in this study are related to characteristics of crop canopy and earliness. Tremendous variations were identified in Sp population for all morphological characters
analyzed. It is known that nectariless in G. hirsutum
was transferred from G. tomentosum (Percy and
Ko-hel, 1999). It is also known that exotic alleles of Gl2
and Gl3 controlling the glandless or the glanded trait could be transferred from multiple sources, such as G. hirsutum, G. barbadense, G. raimondii Ulbr., G. thur-beri Todaro, or G. arboreum (Calhoun, 1997; percy
and Kohel, 1999). Although most parental strains of
G. hirsutum have complicated genetic backgrounds
of triple hybrids, the nectariless, glandless, and high gland content traits are not present in the 12 strains of
G. hirsutum. The identification of nectariless and low and high gland content lines in the SP population are
evidence of interspecific introgression.
In conclusion, large phenotypic variations of yield parameters and fiber properties exist among the Sp lines. Genotypic components for yield parameters and fiber quality were large relative to the interac -tion components. This suggests emphasis on general
adaptability in the development of cultivars when Sp population is used in breeding. Span length (50%) contributed more variation to fiber strength than span length (2.5%). There was a negative correlation between yield and short fiber content. Variations in
morphological characters, such as nectariless, and
low and high gland content in leaves, were identified.
The results provide evidence that SP population is a
useful germplasm resource for genetic improvement of lint yield and fiber quality.
ACKNOWLEDGEMENT
We thank Dr. J.C. McCarty (USDA-ARS,
Mississippi State, MS), Dr. D.T. Bowman (North Carolina State University, Raleigh, NC), Dr. Nacer Bellaloui (USDA-ARS, Stoneville, MS), and Dr.
Joseph Johnson (Bayer Inc., leland, MS) for use
-ful discussion of the research and critiquing the
manuscript.
DISCLAIMER
Mention of trade names or commercial products in this article is solely for the purpose of providing specific information and does not imply recommen
-dation by the US Department of Agriculture.
REFERENCES
Abou-El-fittouh, H.A., J.o. Rawlings, and p.A. Miller. 1969.
Genotype by environment interactions in cotton-their nature and related environmental variables. Crop Sci.
9:377-381.
Adams, G. 2006. Cotton’s global market. p. 2347-2350. In
proc. Beltwide Cotton Conf., San Antonio, Tx. 3-6 Jan. 2006. natl. Cotton Council of Am., Memphis, Tn. Al-Jibouri, H.A., p.A. Miller, and H.f. Robinson. 1958. Ge
-notypic and environmental variances and covariances in
an upland cotton cross of interspecific origin. Agron. J.
50:623-636.
Al-Rawi, K.M., and R.J. Kohel. 1969. Diallel analyses of
yield and other agronomic characters in Gossypium hirsutum l. Crop Sci. 9:779-783.
Baker, J.l. and l.M. Verhalen. 1973. Inheritance of several agro
-nomic and fiber properties among selected lines of upland
cotton, Gossypium hirsutum L. Crop Sci. 13:444-450.
Blanche, S.B., G.o. Myers, J.Z. Zumba, D.Caldwell, and J. Hayes. 2006. Stability comparisons between convention
-al and near-isogenic transgenic cotton cultivars. J. Cotton Sci. [online]. 10:17-28. Available at http://www.cotton. org/journal/2006-10/1/17.cfm
Bridge, R.R., W.R. Meredith, Jr., and J.f. Chism. 1969. Varity
x environment interactions in cotton variety tests in the
Delta of Mississippi. Crop Sci. 9:836-838. Bourland, f.M., J.M. Hornbeck, A.B. Mcfall, and S.D.
Calhoun. 2003. A rating system for leaf pubescence of cotton. J. Cotton Sci. [online]. 7:8-15. Available at http://www.cotton.org/journal/2003-07/2/8.cfm Calhoun, D.S. 1997. Inheritance of high glanding, an insect
resistance trait in cotton. Crop Sci. 37:1181-1186.
Coyle, G.G., and C.W. Smith. 1997. Combining ability for
within-boll yield components in cotton, Gossypium hirsutum L. Crop Sci. 37:1118-1122.
Culp, T.W., and D.C. Harrell. 1975. Influence of lint percent
-age, boll size, and seed size on lint yield of upland cotton with high fiber strength. Crop Sci. 15:741-746.
Felker, G.S. 2001. Fiber quality and new spinning technolo-gies. p. 5-7. In proc. Beltwide Cotton Conf. Anaheim,
CA. 9-13. Jan. 2001. natl. Cotton Council Am., Mem -phis, TN.
Kempthorne, o. 1957. An introduction to genetic statistics. John Wiley and Sons, Inc., new York.
Kohel, R.J. 1974. Influence of certain morphological charac
-ters on yield. Cotton Grow Rev. 51:281-292.
McCarty, J.C., J.n. Jenkins, W.l. parrott, and R.G. Creech. 1979. The conversion of photoperiodic primitive race
stocks of cotton to day-neutral stocks. Mississippi Agric. forestry Exp. Stn. Res. Rep. 4(19):4.
McCarty, J.C., Jr., J.n. Jenkins, B. Tang, and C.E. Watson. 1996. Genetic analysis of primitive cotton germplasm
accession. Crop Sci. 36:581-585.
McCarty, J.C., J.n. Jenkins, and J. Wu. 2005. primitive acces -sion derived germplasm by cultivar crosses as sources
for cotton improvement. Crop Sci. 44:1231-1235. May, o.l., D.T. Bowman, and D.S. Calhoun. 1995. Genetic
diversity of U.S. upland cotton cultivars released be
-tween 1980 and 1990. Crop Sci. 35:1570-1574. May, o.l., and G.M. Jividen. 1999. Genetic modification of
cotton fiber properties as measured by single- and high-volume instruments. Crop Sci. 39:328-333.
May, o.l. and R.A. Taylor. 1998. Breeding cotton with higher yarn tenacity. Textile Res. J. 68:302-307.
Meredith, W.R. 1984. Quantitative genetics. p. 131-150. In
R.J. Kohel and C.f. lewis (ed.) Cotton. Agron. Monogr.
24. ASA, CSSA, and SSSA, Madison, WI.
Meredith, W.R. 1991. Contributions of introductions to
cotton improvement. p.127-146. In H.l. Shands and
l.E. Wiesner (ed.) Use of plant introduction in cultivar
development, Part I. CSSA Spec. Publ. 17, ASA, CSSA, and SSSA, Madison, WI.
Meredith, W.R. and R.R. Bridge. 1971. Breakup of link -age blocks in cotton, Gossypium hirsutum L. Crop Sci.
11:695-698.
Meyer, J.R. and V.G. Meyer. 1961. origin and inheritance of nectariless cotton. Crop Sci. 1:167-169.
Miller, p.A. and J.o. Rawlings. 1967. Breakup of initial
linkage blocks through intermating in a cotton breeding
program. Crop Sci. 199-204.
Miller, p.A., J.C. Williams, and H.f. Robinson. 1959. Variety x
environment interactions in cotton variety tests and their
implications in testing methods. Agron. J. 51:132-134. Miller, p.A., J.C. Williams, H.f. Robinson, and R.E. Com
-stock. 1958. Estimates of genotypic and environmental
variances and covariances in upland cotton and their
implications in selection. Agron. J. 50:126-131.
Murray, J.C. and l.M. Verhalen. 1970. Genotype by environ
-ment interaction study of cotton in oklahoma. Crop Sci. 10:197-199.
percy, R.G. and R.J. Kohel. 1999. Qualitative genetics. p. 319-360. In C.W. Smith and J. T. Cothren (ed.) Cotton
– origin, history, technology, and production. John Wiley
and Sons, Inc., New York.
Scholl, R.l. and p.A. Miller. 1976. Genetic association between yield and fiber strength in upland cotton. Crop
Sci. 16:780-783.
Smith, C.W., and G.G. Coyle. 1997. Association of fiber
quality parameters and within-boll yield components in
upland cotton. Crop Sci. 37:1775-1779.
Stewart, J. McD. 1994. potential for crop improvement with
exotic germplasm and genetic engineering. p. 313-327.
In G.A. Constable and N.W. Forrester (ed) Challenging
the future. proc. World Cotton Res. Conf., 1st, Brisbane,
Australia. 14-17 feb. 1994. CSIRo, Australia. Stewart, J. McD., and T. Kerr. 1974. Relationship between
fiber length increase and seed volume increase in cotton
(Gossypium hirsutum L.) Crop Sci. 14:118-120. USDA - Foreign Agricultural Service (FAS) 2004. World and
U.S. cotton production supply and distribution estimates.
Available online at http://www.fas.usda.gov/cotton/circu
-lar/2003/11/toc.htm (verified 28 nov. 2006).
Wilson, f.D. 1987. pink bollwarm resistance, lint yield, and earliness of cotton isolines in a resistant genetic back
-ground. Crop Sci. 27:957-960.
Wilson, f.D. 1989. Yield, earliness, and fiber properties of cotton carrying combined traits for pink bollwarm resis
-tance. Crop Sci. 29:7-12.
Wilson, f. D., H.M. flint, W.R. Deaton, and R.E. Buehler. 1994. Yield, yield components, and fiber properties of in -sect-resistant cotton lines containing a Bacillus thuringi-ensis Toxin gene. Crop Sci. 34:38-41.
Wilson, f.D., and B.W. George. 1982. Effects of okra-leaf, frego-bract, and smooth-leaf mutants on pink bollwarm damage and agronomic properties of cotton. Crop Sci. 22:798-801.
Worley, S., T.W. Culp, and D.C. Harrel. 1974. The relative contributions of yield components to lint yield of upland
cotton, Gossypium hirsutum l. Euphytica 23:399-403.
Wu, J., J.n. Jenkins, J.C. McCarty, Jr., and J. Zhu. 2004. Ge
-netic association of yield with its component traits in a recombinant inbred line population of cotton. Euphytica 140:171-179.
Zhong, M., J.C. McCarty, J.n. Jenkins, and S. Saha. 2002. Assess