JAST, Vol. 10 © Iranian Aero
Im
Grow
AD ATA ED EFT FAA FCG FD FDA FEM FS GLS LC LDD LDP MRB MSG-3 NDI NDT OEM OEW SI SIF SLD SSI 1. PhD Candid 2. Professor0, No. 1, pp. 1- 1 ospace Society, W
mplem
wth A
1, 2. De
The m an SSI c aircraft m failure ap Moreover design ap correspon growth a fractograp Keyword:
Nomen
Accidental Air Transpo Environmen Extended F Federal Av Fatigue Cra Fatigue Dam Fatigue Dam Finite Elem Fatigue Stri Generic Lo Load Crack Logic Deci Logical De Maintenanc Maintenanc Non Destru Non Destru Operation E Operation E Structural I Stress Inten Structural L Significant date (Correspond 15 Winter-Spring 201mentat
nalysi
A.
epartment of Rese Pomain goal of thi component of b maintenance an
pproachmeanin r, it cansignific pproach and ndence with the analysis is inve aphy for the purp
SSI Component
nclature
12 Damage ort Association ntal Deteriorat Fatigue Testing iation Adminis ack Growth mage mage Analysis ment Method iation oad Spectrum k sion Diagram cision Process ce Review Boa ce Steering Gro uctive Inspectio uctive Testing Empty Weight Empty Weight Integrity nsity Factor Logic Diagram Structural Item ding Author) 13tion o
is of A
R. Nikouee
f Mechanical earch Branch
ostal Code: 14
*arnc
is article is to i b747 aircraft. d its safety leve g that MSG-3 r cantly help savi
the developme e SLD of MSG-3 estigated. The rpose of explori
s, Aircraft, Crack
n tion g stration s es ard oup 3 on m m
of “MS
Aircra
e
1*and S. A
l and Aerosp h, Islamic Az
477893855,Te
implement the M This process i el. MSG-3 logic reduces the ma ing thetime and entof maintena 3,an SSI compo approach of t ing the loading.
k, Analysis TDI The inclu aircra airwo exper new can b of A task-3[1]. struc logic the p Cons dama into t This sched desig conse unde its susce diffic this can b
SG-3”
aft SS
Adibnazari
ace Engineer zad Universit ehran, IRAN om MSG-3 process is expected toi c took a top-dow aintenance cost d providing fina ance programi onent is selectedthis study is to
I Tea
definition of udes those task aft systems, orthy conditi rience in dev aircraft has s be developed t ATAtask force oriented main
One of the m tural treatmen c evolves into
possibility of siderations o age, age expl the logic diag section co duled mainte gned to relate equences of tected. Each s significance eptibility to an culty involved
is established be developed
”
for C
SI Com
2
ring, Science ty
s in structure fie increase the e wn or conseque and upgrades ancial benefits f ing. In this st d and itsfatigue o use the FEM
ar Down Inspe
Introduct
f maintenance ks required to components, ion [1].Airli veloping sche shown that m through the us e led to the d ntenance proc main parts of
nt. In this tr a form which f structural d of fatigue, loration, and gram and arero ntains guide enance tasks scheduled m f structural structural item to conti ny form of dam
d in detectin d, scheduled which can be
Crack
mpone
e and eld for ase of ence of safety. for the tudy,in e crack M and ectiontion
e in industry o restore or m
and structur ne and man eduled mainte more efficient
se of LDP [2] development cess defined f the MSG-3 reatment, the h more directl deterioration p
corrosion, others areinc outinely consi elines for d for aircraft maintenance ta
damage tha m is assessed in
inuing airw mage, and the ng such dama
structural ma e effective in
k
ents
generally maintain an res in an nufacturer enance for
programs .The work of a new,
as MSG-process is structural y assesses processes. accidental corporated idered [2]. developing structure asks to the at remain
2
/
Journal of Aerospace Science and TechnologyVol. 10/ No. 1/ Winter-Spring 2013 R.NikoueeandS.Adibnazari
and preventing structural degradation due to fatigue, environmental deterioration, or accidental damage throughout the operational life of the aircraft. The structural maintenance task(s) are developed as part of the scheduled structural maintenance [2]. In this study,the aircraft SSI component of a Boeing 747 wasselected for assessment of crack growth using SLD, implementing crack growth analysis through the experimental study of fatigue crack. Smaller cracks were investigated with fractography and lead cracks were investigated using“FEM “. Upon part selection, the general spectrum of loading was defined, and after designating loading spectrum, with the aid of modeling, fatigue crack growth and the element design were analyzed based on the finite element method.
Background
MSG-3 Development
In 1968 the MSG was created with a mandate to formulate an LDP for development of the initial scheduled maintenance requirements for new aircrafts. That same year, representatives of the steering group developed “MSG-1” which, for the first time, used an LDD to develop the scheduled maintenance program for the new Boeing 747 aircraft. In 1970, MSG-1 was updated to MSG-2 to make it applicable for later generations of aircraft.MSG-2 decision logic was subsequently used to develop scheduled maintenance programs for the aircraft of the 1970s.
In 1979, the ATA task force sought to improve on MSG-2 in order to address a new generation of advanced technology aircraft (B757 and B767)[1]. The work of the ATA task force led to the development of a new task-oriented maintenance process defined as MSG-3[1]. Today, MSG-3 is the only method used by commercial airplane manufacturers. Policy states that the latest MSG analysis procedures must be used for the development of routine scheduled maintenance tasks for all new or derivative aircraft. In MSG-3, the structural inspection program is designed to provide timely detection and repair of structural damage occurring during commercial operations. Detection of damages such as corrosionand fatigue cracking by visual and/or NDT procedures are considered [1].The primary objective of the scheduled structural maintenance is to maintain the inherent airworthiness throughout the operational life of the aircraft in an economical manner. To achieve this, the inspections must meet the detection requirements of each of the AD, ED and FD assessments. Inspections related to the detection of AD/ED are applicable to all aircraft when they first enter service [2]. Also inspections related to FD detection in metals are applicable after a threshold [2]. Additionally, accidental Damage (AD) is characterized by the occurrence of a random discrete event [2]. Besides, Environmental Deterioration (ED) is
characterized as structural deterioration resulting from a chemical interaction with its climate or environment [2]. Finally, Fatigue Damage (FD) is described as the initiation of a crack or cracks due to cyclic loading and subsequent propagation [2]. Moreover, in order to increase the level of safety and economical gain for operators as well as manufactures and to ease the oversight of authorities in the structural division, at first all aircraft structural elements shouldbe classified. Secondly, the group classification of the types of inspections and maintenance intervals has tobe examined.The above-mentioned elements consist of [2]:
1. SSI which in fact are primary structural parts of the aircraft.A Structural Significant Item (SSI) is any detail, element or assembly, which contributes significantly to carryingflight, ground, pressure or control loads, and thefailure of which could affect the structural integrity necessary for thesafety of the aircraft [2].
2.Other elements, known as “Other Structure”,is judged not to be a structural Significant Item. It is defined both externally andinternally within zonal boundaries [2].
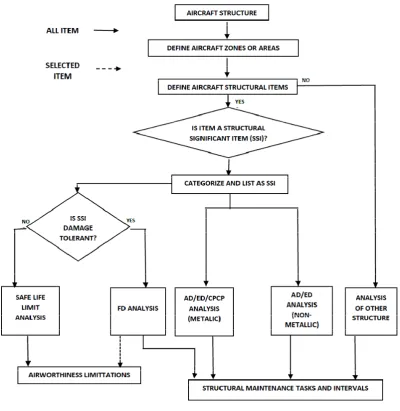
The structural logical diagram“SLD” in the MSG-3. process is shown in Fig. 1.
Extended Fatigue Testing
/
3
Journal of Aerospace Science and Technology Vol. 10 / No. 1/ Winter - Spring 2013 Implementation of “MSG-3” for Crack Growth Analysis of Aircraft …Figure 1. SLD in MSG-3 process
Theoretical Investigation
Introduction of the Part to be investigated
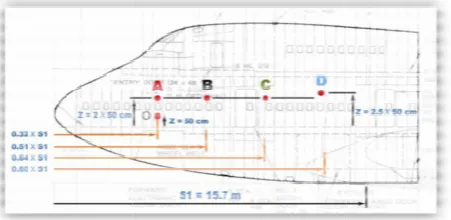
As mentioned in the previous section, the main goal of this study wasto implement the MSG-3 process on selected SSI elements of a Boeing 747 aircraft.The study focused on a part of the structure and according to the SLD and MSG-3 process, the intended part was designated through a structure logic diagram. The selected SSI parts of a Boeing 747; with accumulated 16756 FC and 64555 FH were removed from section 41 of this aircraft andlocated on Frame Station 300[6].The main task in this study was to investigate crack growth rate in crack locations, in a defined direction and under a specified default loading spectrum. Figs. 2 through 4are illustrations of the part under investigation. A hole is shown in one of these areas. The general form of these
4
/
Journal of Vol. 10/ NFigure 3. Im
Figure 4. The
Surface Cra
Fractography failure (fat phenomena).B used to invest reported in th specifically fo
Althoug number of cy fatigue crack could show using an opti crack samp corresponden striation foun cyclic load.T for crack gro each loading configuration role in determ it also provid a part can be the defined s of fracture s was designa Schijve, Nix Matsunaga; w confirm fati aluminum a Consequently
f Aerospace Scien No. 1/ Winter-Sp
mage of selected
e exact location
acks Fractogr
y is a method tigue, corros Because of su tigate and show he 1951 article
ocusingon “fat gh “Orowan”
yclic operation k at a critical p fatigue crack ical microscop ple. They nce between
nd in each lo They also pre owth rate and g cycle as a n. Not only t
mining fatigu des a situation e defined by c space and dis
triation, fatig ated by Laird x and Flowe who declared igue crack alloy unless
y, if there was
nce and Technolog ring 2013
d component at
n of the crack un
raphy
d of analyzin sion, and urface fraction
w damage and es issued by Za tigue striation” ” announced
ns are require position, Fors k in each loa pe and one alu
established n the numbe
oading cycle esented reaso fatigue crack result of fr this result ha ue crack growt n in which loa counting fract stance [7].In r ue crack grow d,Smith, McM er, and also
that there wa growth in e
in a cycle-s no cycle-sign of fr gy
frame STA. 30
nder test analys
ng damage an other simil n, this method d failure signs, affe and Word ” [7].
that a gre ed to start initi ssyth and Ryd ading cycle b uminum fatigu a one-to-on er of fractu
and number onable eviden k propagation racture striatio as a significa
th property, b ading history o
ture striation relation to for wth mechanis Millan, Pellou McEvily an asno evidence either steel -by-cycle bas racture striatio 0 sis nd lar is as den eat ial der by ue ne ure of nce in on ant but on in rm sm ux, nd to or se. on, there for neces of oc and s and s struc are s howe inspe tools micro the e to inv an el fracto crack the l mode size colum edge of st crack crack surfa resul surfa fricti fatigu reaso trigg analy resul Tab ( 8 8 9
e would be so damage and ssary to desig ccurrence and surface fractu smooth materi Mechanism tural elements hort-term load ever, it is po ection of whic
in fractog oscope, and s lectronic micr vestigate surfa lectronic micr ography. Figs k on the part ( eft side of th e is given in T from the first mn is the exa of fracture su triation being k growth rate. k surface fr ace fracture sh
lted from fat ace fracture on on from rubbi ue panels a ons for cra ered this si ysis was acco lting from fati
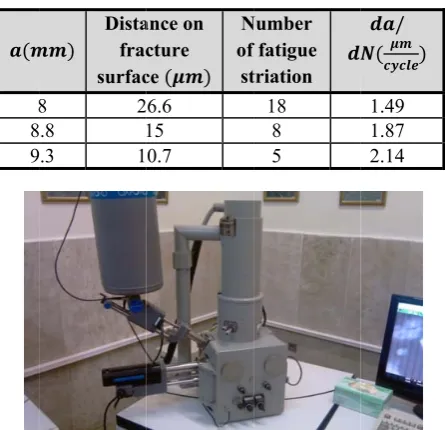
ble1. The result
)
Dista frac surfac
8 2
.8
.3 1
Fig 5. Electron
ome other cau failure ana gnate their m d define the p ure specificatio
ials [7]. for the int s failure whic ding, fatigue, ssible to see ch is done by graphy are similar equipm roscope used w face fractures o roscope (SEM s. 6, 7, and 8 (Fig 4the smal he hole). Crac Table 1. The f
t edge of frac ct location of urface,the third g considered,
. Figs. 9, 10, ractography.
howed that th tigue striatio n the fractogr ing was one o and crack gr
ck initiation ituation. The mplished by gue.
t of fractograph
ance on cture ce ( )
N of st 6.6 15 0.7 nic microscope fractograph S and Nikouee R.
uses, such as alysis. Hence echanism and part operation on, especially
troduction of ch could be in
corrosion, or surface frac fractography. the x-ray, ment[7]. In t was LEO 440 on selected pa M) (Fig 5) wa
8 are related t llest crack is l ck growth rat first column is cture surface,th
f striation from d column is th and forth c and 11 show Fractography he lead crack on; but there raphy.Therefo of the reasons. rowths were n, accidental
erefore, fatig assuming crac
hy around small
Number f fatigue triation 18 8 5
used for the pr hy
Adibnazari S.
s accident, e, it was d situation condition y forbrittle f aircraft vestigated r creeping; ctures, the The main electronic this study, 0i. In order
art cracks; s used for to a small located on te for this s the crack he second m the first he number column is w the large
y of this k initiation
Implementat
Figure 6.
Figure 7.
Figure 8.
Figure 9
tion of “MSG-3”
. Fatigue striati with 500
Fatigue striatio with 1000
Fatigue striatio with 1130
. Fatigue striati with 1134
for Crack Growt
on at 8 mm of c times magnific
on at 88mm of 0 times magnific
on at 9.3 mm of 0 times magnific
ion at 2mm of c 4 times magnific
th Analysis of Air
crack initiation cation
crack initiation cation
f crack initiation cation crack initiation cation rcraft … point n point n point point L In il an p in sp o sa th g d em an cr sp d h lo 6 v ce w sp se li fl Jo Vo
Figure 10. Fa poin
Figure 11. Fati w
Loading
n order to per llustrated in
nalyzed using urpose, the ndicators. As pecification o
f flight, a re ample for larg he general loa
eneral model efine loading mpty operatio nd aircraft op ruising level, peed, fuel c
ifferential ca istory and ai oading spectru 000 flight cy ariable coeffi enter of gravi wasrelated to f pectrum was ervice life of ife of such a lights. The
ournal of Aerospac ol. 10 / No. 1/ Wint
atigue striation a nt with 1560 tim
igue striations a with 2180 times
rform fatigue Figs. 5 and g the finite
first stage it is a comp f applied load ference wasu ge commercia ad spectrum, w
of loading h g included:inte
on weight, m peration data
cruising spe onsumption abin pressure
ircraft reactio um consisted o ycles, which
icient of load ty and differe flight altitude. one-tenth of a wide-bodie aircraft is typ
regular fligh
ce Science and Te nter - Spring 2013
at 6.3mm of cra mes magnificati
at 25.3mm of cr s magnification
crack growth 6, the bigge element meth wasto desig plicated task ding during di used to define
al aircraft and which wasthe history. Param
ended aircraft maximum payl
such as rang ed, takeoff sp as well as
variations, a on in wind g
of the continu wasa combin ding (
∆
g) in ential cabin prThe number f the maximu
d jet aircraft,a pically define ht profile of
/
5
chnologyack initiation ion
rack initiation
6
/
Journal of Vol. 10/ Naircraft is d shown in Fig
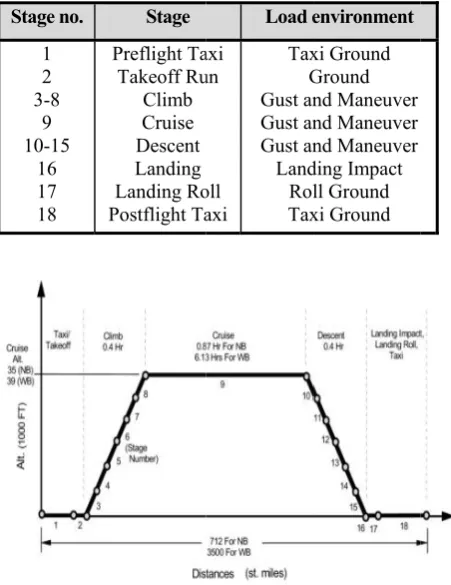
Table 2. Loa
Stage no. 1 2 3-8 9 10-15 16 17 18
Figure 12.
In diffe named in tab could affect groups [8]: - Aircraft climb, an - Aircraft preflight taxiing, t - Wind gu - Internal The firs weredifferen wereaccelera gravity. Sam asthe numbe the period w flight cycles the aircraft reported in T aircraft’s fu structure, n
f Aerospace Scien No. 1/ Winter-Sp
divided into g. 12and name ad Environment Stage Preflight Ta Takeoff Ru Climb Cruise Descent Landing Landing Ro Postflight Ta
. Ordinal diagra
erent flight m ble 2, the cir t fuselage str
flight maneu nd landing sta
ground op t movement, c the landing ph ust loading dur cabin pressure st three circu nt from i ated changes mples of thei er of cycles i wasconverted s [8].The fina
experience i Table C21 ref uselage as numbers for
nce and Technolog ring 2013
different stag ed in table 2 [8 t at Each Stage
Load e axi un oll axi Tax G Gust an Gust an Gust an Land Rol Tax
am for stages of
modes shown rcumferential ructurewasdiv
uvering in d ages
erations incl consistent surf hase, and land
ring weather d e
umferential lo internal cab s in the airc ir variations in a specified d to equal v al acceleration in the center ference [8]. C
a cylindrica r the shear gy
ges, which a 8].
of Flight Profil
environment xi Ground Ground nd Maneuver nd Maneuver nd Maneuver ding Impact ll Ground xi Ground
f flight profile
in Fig. 12 an loading whic vided into fo
different cruis luding aircra face movemen ding impact deterioration. oadings (whic bin pressur craft center werecalculate d period. The values of 600 n spectrum th r of gravity Considering th al monocoqu r stresses are le nd ch our se, aft nt, ch re) of ed en 00 hat is he ue in longi were cylin diffe altitu [8]. asthe cente diffe direc Equa loadi obtai
σ
=
Whe σ: direcσ
: S press/2 :
aircr
∆
g ∶table : on m
σ
woul pane aircr selec nose loadi locat show F itudinal an eomitted and ndrical pressu erential cabinude and is rec The stress s e sum of tow er of grav erential”in th ction of the ation 1.This
ing spectru inedfrom Tab
f
(
p)
+ f(
g)
re:
stress in ction at point
Stress in dam sure equals
2 for circumf Stress in d aft inertia and
Load coeffic e
Stress defin maximum des
.It wasassum ld occur at th l while
σ
w aft and zero cted componesection.Fina ings and the tion would b wn in Fig.14.
igure 13. Vie find
nd circum d calculated urized vessel. n pressure i corded in Tab spectrum of w term, the “ vity” and t he longitudin fuselage cou equation c m to a ble C21 in ref
= σp+
(
1longitudinal of damage
age location
/ for lon ferential crac damaged loc d aerodynam cient accordin
ed in longitu sign stress, s med that ma he upper cro would be zero
distance [8] ent is shown i ally the com e stress spec
e based on th
ew of the loca ding spectrum S and Nikouee R. mferential d as for a
Internal and is related to ble C20in the the damaged stress spectru the “cabin nal or circum uldbe calcula
converts the stress spec ference [8].
∆g
)
σ1gl or circum
because inter ngitudinal cr
ks
cation as a ic loading ng to loading
udinal directi shown in the aximum stres own plate of o at each en ]. The locatio in Fig.13 and mbination of
trum in the he following
ation of dama m loading Adibnazari S. directions a simple d external o aircraft reference d location
um in the pressure mferential ated using e general ctrum as (1) mferential rval cabin racks and result of spectrum ion based e form of ss (
σ
)the wing nd of the on of the d 4m from different damaged diagram,
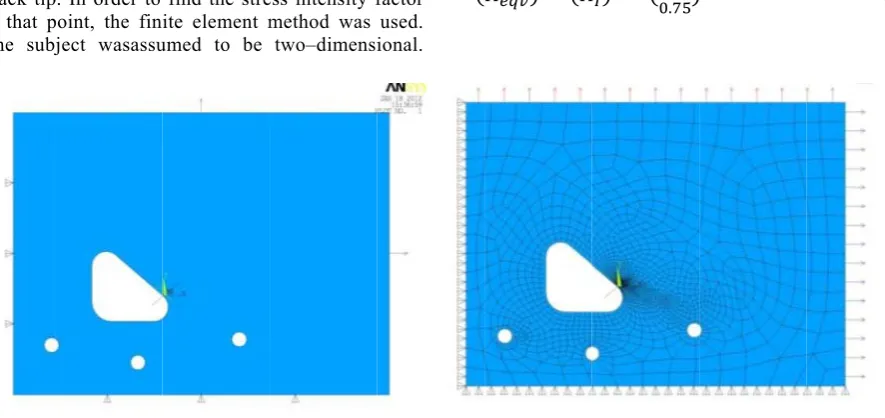
Implementat Figure Finite El One ma mechanic crack tip at that p The subj Figure 1 Critical a The initia in fractur factor eq then crac growth w with the s Whe crack gro the unkn intensity structures everywhe length in
tion of “MSG-3”
e 14. Sample o sho
lementMode
ain point of cs is to find t p. In order to point, the fin
ject wasassu
15. (a) Two dim w
and Initial Cr
al crack length re mechanics, quals the frac ck length will would beunsta speed of soun en the loading owth in the fat nown paramet
factor equals s, loading a ere. So, as a n the integrat
for Crack Growt
of loading spec own in Fig. 13
eling and Ana
fatigue ana the stress inte find the stre ite element m umed to be
mensional mode with second ord
rack Lengths
h was assume , if the crack cture toughnes l be critical. able and the c
d.
g for crack gro tigue mechan ter is the leng
fracture tough and stress a
result, to find ted structure,
th Analysis of Air
trum for locati
alysis
alysis in fra ensity factor ess intensity f
method was two–dimensi
els produced fro der elements ac
s
d 0.05 inch [8 tip stress inte ss of the ma
In this case, crack is propa
owth is know ismis well-de gth, and the hness. In integ are not the d the critical , the crack l
rcraft … ion acture at the factor used. ional. A sa th m p w ca se in p fa cr th re st v
(
om initial 1 mil companying bo 8] and ensity aterial, crack agated wn and efined, stress grated same crack length sh se en w ar Jo Vo Additionally, ame crack, th he loading wa mentioned ana lanetary stre werefrom the
alculation ne elected direct n X and Y
ropagated in actor in thef we rack conditio
he (equ
was calcu esults is show tress intensit
arious crack
)
=
(
llimeter crack a oundary layer an
hould be stud ee the critical nd points of wings. For cri rea, the follow
- Calculate th - Specify the
axis of Fig. - Select the f - Read the c
curve from - This numbe
point
ournal of Aerospac ol. 10 / No. 1/ Wint
it was planne he same boun
as applied acc alyses wereb ess, and the e second or
etwork is ill tion for crack Y direction
compose mo first and sec
recalculated on and appli uvalent of ulated from wn in Fig 16 ty factor vers
sizes.
)
+
(
.
)
round designate nd loading cond
died at critical points in the f this area, m
itical length wing procedur he stress field e calculated st
. 19
first curve und corresponding
guide diagram er is critical c
ce Science and Te nter - Spring 2013
ed with simil ndary layer co cording to Fi based on two e elements der with 8 lustrated in F k propagation
causedthe de and the str cond mode
and for the e cation of Pa
) w equation (2) . This diagra sus longitudi
)
ed hole (b) Mes dition
l points. Refer e first zone fus meaning the at arbitrary p re should be ad at the arbitrar tress field in t
der the K-IC o g number of m
crack length at
/
7
chnologylar holes, the onditions and g. 15(a). The -dimensional to be used nodes. The Fig15(b).The n and loading crack tobe ress intensity ( ). evaluation of aris equation, wasused. The [11] and the am shows the inal stress in
(2)
sh generation
r to ref [8] to selage are the threshold of points of this
dopted: ry point the horizontal
of the material f the selected
8
/
Journal of Vol. 10/ NFor exam the critical se end points/th
Location of
At this point and critical investigation for crack pro because poin (deck) and longitudinal stress level o for selected forcrack p considered:
- being far - being nea
the faced
f Aerospace Scien No. 1/ Winter-Sp
mple, doing th ection of the f hreshold of t
Figur
Initial Crack
t, the initial c crack leng n of this study opagation at p nt “O” is ver reduces th bending Stre of points A, B d points.Thes propagation,
from neutral a ar to end poi
zone fuselage
nce and Technolog ring 2013
his procedure first zone fuse the wings an
re 16. Critical
k
crack length, c gth were de y showed that point “O” in ry close to th efluctuation ess. Therefore
, C, D are mo se are the h
hence tw
axis (deck) ints/threshold e
gy
e for 3 points o elage means th nd, as a resu
crack length
crack directio etermined. Th
the stress lev Fig. 17 is low he neutral ax
range of th e, obviouslyth ore than point
highestpotenti wo featuresa
of the wing on hat ult,
critic mm,
on the critical
on, he vel w, xis he he O ial are
in
point mark This
Fig
cal crack leng and 10mm,re
l section of fir
For this purp ts are shown ked by red, b
coding waske
gure 17. Illustra
gth for A, B, spectively in
rst zone fusela
pose, 4 point in Fig.17,na black, green,
ept in all curve
ation of selected growth analy
S and Nikouee R.
C points are Fig16.
age
ts wereselect amed A, B, C
and blue, res es and diagram
d point for fatig ysis
Adibnazari S.
6 mm, 19
ed. These C, D and spectively. ms.
/
9
Journal of Aerospace Science and Technology Vol. 10 / No. 1/ Winter - Spring 2013 Implementation of “MSG-3” for Crack Growth Analysis of Aircraft …Fatigue Crack Growth Analysis
In order to calculate the component fatigue life limit from a fracture mechanics point of view, it wasneeded to consider the subject of fatigue crack growth. In the finite element analysis for crack growth modeling, we need the specific criteria (i.e. finite elements output data) which, in this field of study, are obtained from variable functions in structural analysis. In fact these variables are displacement. If a quantity such as stress, strain, or energy, which is related to these displacements, is considered in the final evaluation, the stress intensity factor which introduces fracture mechanics elasticity wouldhelp find the property thatis in a linear situation with the field of stress at the final stage of the finite element analysis. With the aid of a model based on this property, we canachieve a certain indicator for fatigue crack growth. The item in accord with fatigue analysis from a fracture standpoint in the finite element method is, in fact, crack growth. In this case, using the model and growth criteria hand in the same result, and the fatigue crack rate (i.e. growth length in each loading cycle) wouldbe drawn in the form of extremities of stress intensity factor variations at the point of the crack. Fatigue crack growth rate diagrams (i.e. crack length in each loading cycle) are presented for 3 types of aluminum based on the tensional stress variation of the coefficient extremity at the crack tip [9]. This logarithm diagram is divided into 3 zones which, for the intermediate zone (linear part) power equation, are known as Paris’ law (Equation3,4) [10, 11].
= ( ) (3)
= (∆ ) (4) The material used for the aforementioned modeling wasaluminum T6-7075 and the two constant values“c” and “m” were calculated whilethese two constant values for the proposed aluminum wereselected as 3.6e-11 and 4.1 [9]. Consequently, the part service life time was calculated with the integration in Equation 5being per se derived from Equation (4) [10, 11].
=
(∆ ) (5)
By assuming the final crack a critical crack, its length will be located at the upper limit of the equation (5).In this equation, N wouldbe the final service life of the component. The location and direction of the initial cracks in the structure will determine the amounts of the stress intensity factor during growth and consequently, by assuming a model f(∆k) function, it wouldbe possible to calculate the integral (4). The size and direction of initial crack is the same as the bigger crack, and the situation around the crack is the same as the component used for proposed modeling (bigger crack on right hand side of hole in Fig. 4).With respect
to the number of loading cycles beingknown, the calculationof crack growth was carried out. The calculation of the crack growth rate (∆ ) in this number of cycles was considered and calculated using equation (6), and in this case integration of N wouldbe made [10, 11].
= (∆ )
(6) In other words, ten blocks of loading equaling 6000 cycles were applied to the model at each block. The sum of the block increment for each of them was calculated. Therefore loadings, except cabin deferential pressure, werecalculated as a variation of acceleration at aircraft c.g for 6000 flight block, as reported in Table 21in the reference [8]. Thusfinal acceleration spectrum which the aircraft wouldexperience at c.g was calculated.This acceleration spectrum became fuselage longitudinal stress and after combining with longitudinal and lateral stress caused from internal cabin pressure, the stress spectrum for 1 period of 6000 flights was achieved. Therefore we would be able to do the same calculation for 10 blocks of 6000 flights.
If da/dN is a constant value, it is possible to calculate crack growth rate for 1 loading cycle (1 flight) and then multiply any number of cycles, which result in final length. In fact the practical method is to divide the number of spectrum cycles by 6000 flights, and the number of cycles for 8 different stages of each flight couldbe calculated. This helps the specified code to be capable ofsolving the finite element model for 6000 flights and causes the exact number of flights required for cracking to reach the required specified length.
10
/
Journal of Aerospace Science and TechnologyVol. 10/ No. 1/ Winter-Spring 2013 R.NikoueeandS.Adibnazari
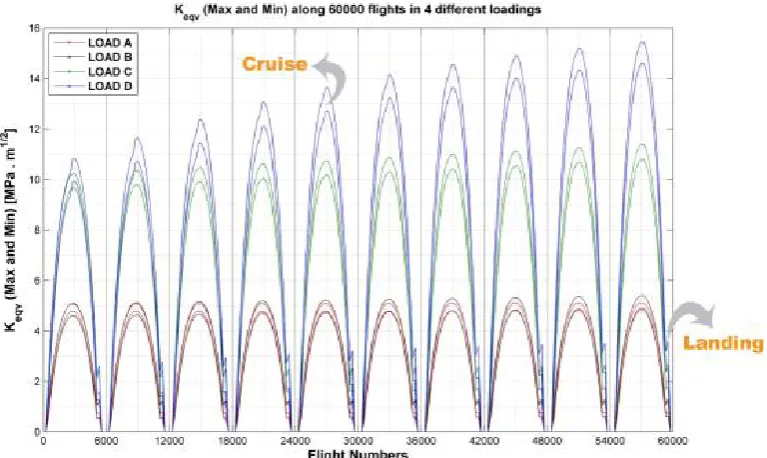
In Fig.18, the stress intensity factor at maximum and minimum loading for60000 flightsis as illustrated for the 4 points of A, B, C, and D at the first zone of the fuselage. Also inthe landing phase an excessive load wouldbe applied to the fuselage, but as interior cabin pressure approaches zero, there is no sign of increase in stress values. For as we see in Fig.19, from maximum and minimum values it is possible to find the range of variation in values.
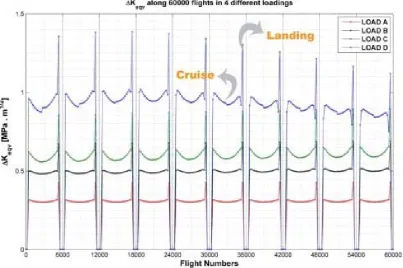
In Fig.20 we can see ∆ for 60000 flight cyclesof 4 specified points at the first zone of fuselage. The limit for cruise flight and landing of aircraft can also be seen in the diagram. One period of calculation consisting of 6000 flights of 54000 to60000 flight cycles for 4 points at the first zone of the fuselage is shown in Fig.21. The main point which should be noticed in comparing Figs.19 and 21 is the significant situation for ∆ at the landing phase and the during cruising conditions. As we can see, the fuselage experiences the most deviation of stress intensity factor during landing phase of the flight; but that does not mean that most crack growth occur during this phase of the aircraft. By referring to reference [8] table 21, we can see that, for 6000 flights the aircraft will experience 6.8 million cycles, but for the aircraft landing phase, only 6000 cycles is applied during 6000 flights. That is to mean that in each flight more than 1 million cycles of variation in the ∆ domain is applied to the fuselage while it cruises, but ∆ for the landing phase occurs only once. For this reason, in order to have a share of each stage of flight represented in crack growth it is better to apply the number of cycles in the calculations.
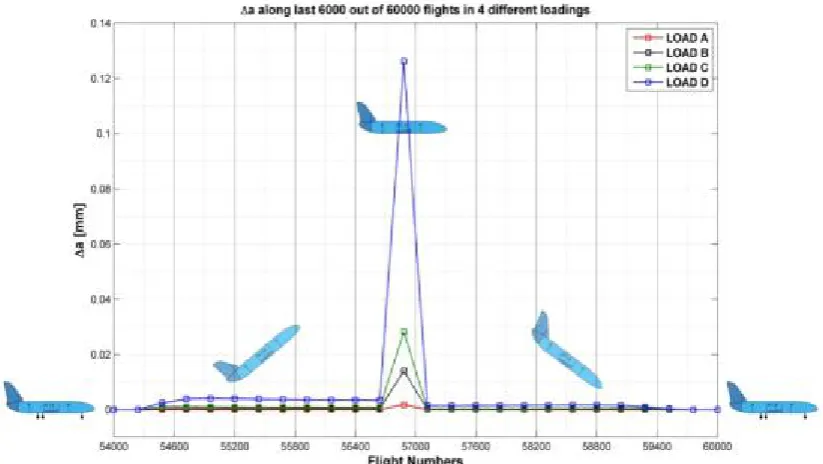
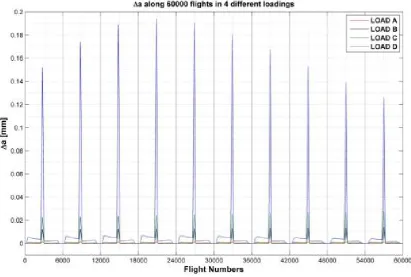
Fig.22 shows the crack growth rate with an initial length of 1 millimeter for assigned points. As we see, crack growth during the aircraft landing phase (third point from right) is approaching zero. In Fig.23 (a, b), crack growth variation based on each phase of flight is shown. It is obvious that a crack with an initial length of 1 millimeter at point A and B does not have considerable variation (the red and black curves). In point C the range of variation is small and rises incrementally with increases in crack length. Even at point D crack length shows no considerable changes, and it is possible to see ascending and descending trends for ∆ . If the calculation of the flights is continued for more than 60000, once again the trend of changes increases. This significant change for ∆ is a result of stress effect respecting the location of the crack. The stress situation at the tip of the crack changes continually, however. In Fig.24, ∆ variation of values can be seen. Also in Fig. 25 these parameters are illustrated in integrated form, including the 1millimeter initial length of the crack. As we can see, cracks with an initial length of 1 millimeter will increase to 3 millimeters as a result of 60000 flight cycles. By limiting flights to 6000, the crack growth value for 6000 cruise flights can be seen. In order to distinguish the trends of change for crack length as shown in Fig.24, the points for the end of each of the 6000 flights is presented.
In Fig. 25, the fatigue crack growth curves are compared with linear conditions, and it is obvious that as a result of less crack growth, the trend of these changes approaches linear conditions. In case of a continued increase in cyclic loading, the growth trend wouldleave the linear situation, and its shape woulddepend on the length of the crack. In addition, we see that at no point wouldthe crack reach the critical length.
Implementat
Figure 1
Figure 2
tion of “MSG-3”
9. Equivalent st
20. Equivalent
for Crack Growt
tress intensity c from
domain of stres
th Analysis of Air
coefficient at m 54000 to 60000
ss intensity coe rcraft …
minimum and ma 0 on 4 points a
fficient change
Jo Vo
aximum loadin t the first zone
s for 60000 flig
ournal of Aerospac ol. 10 / No. 1/ Wint
g in 1 period of of fuselage
ghts on 4 points
ce Science and Te nter - Spring 2013
f calculation,on
s at the first zon
/
11
chnologyn 6000 flights
12
/
Journal of Aerospace Science and TechnologyVol. 10/ No. 1/ Winter-Spring 2013 R.NikoueeandS.Adibnazari
Figure 21. The equivalent domain for stress intensity coefficient changes during 1 period of calculation, on 6000 flights from 54000 to 60000 flights on 4 points at the first zone of fuselage
/
13
Journal of Aerospace Science and Technology Vol. 10 / No. 1/ Winter - Spring 2013 Implementation of “MSG-3” for Crack Growth Analysis of Aircraft …14
/
Journal of Aerospace Science and TechnologyVol. 10/ No. 1/ Winter-Spring 2013 R.NikoueeandS.Adibnazari
Figure 24. Crack length value of first 1 millimeters of sample as a result of 60000 flights on 4 points at the first zone of the fuselage
Figure 25. Crack length value of first 1 millimeters of sample as a result of 60000 flights on 4 points at the first zone of the fuselage
Conclusion
The best ways to promote an aircraft structural design and maintenance program could be using the MSG-3
/
15
Journal of Aerospace Science and Technology Vol. 10 / No. 1/ Winter - Spring 2013 Implementation of “MSG-3” for Crack Growth Analysis of Aircraft …components. For this purpose fractography and the crack growth analyses by FEM wereused.In the selected component and for smaller crack the result of fractography for the surface fracture indicated that the lead crack initiation growth rate and also for bigger crack under life limit cyclic loadingin none of the selected points the crack would reach the critical length;hence, specified periodic inspection would be done. As mentioned before, the MSG-3 process covers all damage types. In future plan the first step for promoting the maintenance program in structure field is that all cracks in SSI components are going to be placed under investigation in selected aircraft tocover the fatigue damage and then the plan on the other components and damages type will be developed.
REFERENCES
1. Shannon, P. Ackert, “Basics of Aircraft Maintenance Programs for Financiers,” Date of Issue: October 1, 2010 www.aircraftmonitor.com 2. ATA (Air Transport Association) “MSG-3
Operator/Manu facturer Scheduled Maintenance Development” revised 2003.
3. Mosinyi, Bakuckas, Awerbuch, Lau,Tan “Crack Growith Assessment of High-Usage in-Service Aircraft Fuselage Structure,” Drexel University /
FAA / Delta Airline -Aging Aircraft Coference FAA/DOD 2005.
4.John G. Bakuckas, Jr - Aubrey Carter “Destuctive Evaluation and Extended Fatigue Testing of Retired Aircraft Fuselage Structure,” Proceedings of the 6th Joint FAA/DoD/NASA Conference on Aging Aircraft, September 2002, San Francisco, CA
5.John G. Bakuckas, Jr - Aubrey Carter “Destuctive Evaluation and Extended Fatigue Testing of Retired,” Aircraft Fuselage Structure: Projet Update Proceedings of the 7th Joint DoD/ FAA/NASA Conference on Aging Aircraft, New Orleans, Louisiana, September 2003,
6. BOEING COMPANY “SRM (Structure Repair Manual)- D6-13592 B747” 2010
7. McEvily A.J. and Matsunaga, H., “On Fatigue Striations,” Scientia Iranica Vol. 17, No. 1. Sharif University of Technology, February 2010.
8. FAA and USAF “RAPID (Repair Assessment Procedure and Integrated Design)” Version 2.1. May 1998.
9. ALCOA Co “Alloy 7075 Technical Sheet, www. millproducts- alcoa.com”
10. A. G, Grandt, Fundamental of Structural Integrity, Wiley and Sons 2003.