in the population sciences published by the Max Planck Institute for Demographic Research Konrad-Zuse Str. 1, D-18057 Rostock · GERMANY www.demographic-research.org
DEMOGRAPHIC RESEARCH
VOLUME 25, ARTICLE 7, PAGES 245-284
PUBLISHED 21 JULY 2011
http://www.demographic-research.org/Volumes/Vol25/7/ DOI: 10.4054/DemRes.2011.25.7
Research Article
Exceptional longevity in Okinawa:
A plea for in-depth validation
Michel Poulain
© 2011 Michel Poulain.
This open-access work is published under the terms of the Creative Commons Attribution NonCommercial License 2.0 Germany, which permits use, reproduction & distribution in any medium for non-commercial purposes, provided the original author(s) and source are given credit.
1 Introduction 246
2 Exceptional longevity in Okinawa 247
3 Validation of individual and population longevity 251
4 Reliability of available data sources 252 4.1 The civil registration system (Koseki) 252 4.2 The population registration system (Jyuminhyo) 253 4.3 Annual lists of centenarians (Zenkoku Koureisha Meibo) 254 4.4 Vital statistics (Jinkô dôtai chôsa) 254 4.5 Population censuses (Kokusei chôsa) 254 4.6 Compatibility of data sources with regard to the number of
centenarians
257
5 Evolution of the population of Okinawa 260 5.1 Age and sex structure of the population 260 5.2 Evolution of mortality in Okinawa 263
6 The reliability of demographic data for Okinawa 267 6.1 Reconstruction of the Koseki after WW II 267 6.2 Can demographic data afford misreporting of age? 270
7 Discussion 273
8 Acknowledgements 276
References 277
Exceptional longevity in Okinawa:
A plea for in-depth validation
Michel Poulain1
Abstract
The topic of this article is the exceptional longevity in Okinawa. This phenomenon should be thoroughly validated at both the individual and population levels. This contribution analyzes the demographic data available for the population of Okinawa, in order to explain the presence of large numbers of centenarians. The mortality crossover obtained by comparing mortality rates in Okinawa and Japan could be attributed either to different behavior of the generations born before and after WW II, or to bad data. Arguments are presented in favor of both possible explanations. The reconstruction of the Koseki to replace the original, which was destroyed during WW II, could be a source of misreporting of age and would support the bad data hypothesis. Nevertheless, no concrete proof of invalid data has been found. Therefore, the author does not favor either of these explanations, but is calling for a more in-depth validation of longevity in Okinawa.
1. Introduction
Okinawa is one of the 47 prefectures of Japan. It consists of a group of 44 inhabited islands that extend 800 miles south of the main Japanese islands, north of Taiwan. These islands, part of the Ryukyu Kingdom, were incorporated into the Japanese Empire in 1879. The people of Okinawa still consider themselves different from those of mainland Japan, and there are dissimilarities between some features of their cultures and traditional life styles. For 80 days in 1945 Okinawa was the site of the last and most decisive battle of WW II between Japanese and American soldiers. More than 100,000 soldiers died, as well as an equal number of civilians. The territory was subsequently under U.S. administration until 1972, when it was returned to Japan. Its population of 1.3 million inhabitants is considered to be among the less economically developed of Japan. Since the excellent contribution of Irene Taeuber (1955), no in-depth studies of the demography of Okinawa have been conducted, although these are essential in order to validate its alleged exceptional longevity.
Studies of centenarians are frequently used to investigate the determinants of healthy aging and exceptional longevity. Most of these studies involve individual centenarians and compare their behaviors and characteristics with younger members of the same population.2 A few other studies have analyzed populations which are
somewhat isolated and often ethnically distinct that experience exceptional longevity. These studies assess not only individual longevity but also the longevity of the population as a whole. The mountainous areas of Sardinia and Okinawa are the two most important regions where population longevity has been recently investigated in more detail.3
Verification of extreme age and exceptional longevity is crucial to the validity of all research on the oldest olds. Individual longevity and population longevity are complementary concepts that may contribute to the analysis of the determinants of longevity, but their validation process differs. For individual longevity, the age of every oldest old person is carefully checked before inclusion in the analysis, or exclusion in case of error. For population longevity, individual age validation is also required,4 but
an exhaustive enumeration of the oldest olds has to be ensured from a basic analysis of the demographic evolution of the population.
2 For example, see the methodology followed in the EU-funded research project GEHA (Franceschi et al. 2007).
3 For Sardinia, see Poulain et al. (2006) and for Okinawa, Willcox et al. (2001).
A recent paper by Willcox et al. (2008) might be considered to be a direct response to the need for a complete validation of population longevity in Okinawa. It presents a battery of arguments that support the conclusion that the high prevalence of centenarians in Okinawa is valid and warrants further study of its genetic and environmental correlates. The present article intends to revisit these arguments, to assess the demographic aspects of the longevity of the population of Okinawa, and also to consider recent research by Saito (2010) on the age validation of super-centenarians in Japan.
2. Exceptional longevity in Okinawa
Population longevity is often assessed by computing the prevalence of centenarians, which is the number of centenarians reported among the total population at a given time (Table 1). Although the prevalence of centenarians is the most commonly used global index for comparing longevity, it is not necessarily the most appropriate (Canudas-Romo 2010). Important potential biases are linked to the fact that a population born a century ago and living in a particular place cannot be compared with the total population of that locale. Variations in fertility and mortality occurring over the course of a century, as well as selective migration, may profoundly influence this index and make it completely unusable for comparative purposes. Nevertheless, as shown in Table 1, the prevalence of centenarians in Okinawa is exceptionally high, especially among women. The prevalence computed for both sexes since 1963 has been consistently higher for Okinawa than for Japan as a whole (Figure 1 and Annex 1).
Period life expectancy might be a better index for comparing levels of longevity between different populations, although it describes only the current survival rates of the population and applies them to a fictitious cohort. A comparison of figures for 20055 reveals that the life expectancy at birth for females exceeds 86 years for
Okinawa, which is higher than that of every other country shown in Table 2.
Table 1: Number of centenarians in Okinawa, Sardinia, and other selected countries in 2008, and their corresponding prevalence expressed as the number of centenarians per one million inhabitants
Total Males in thousands Total Females in thousands Male centenarians Female centenarians Male prevalence Female
prevalence Sex ratio
Japan 62251 65441 5076 31200 81.5 476.8 5.85
Okinawa 674 702 94 744 139.5 1059.8 7.60
Italy 28949 30669 2287 10301 79.0 335.9 4.25
Sardinia 817 848 87 242 106.5 285.4 2.68
Austria 4054 4278 132 809 32.6 189.1 5.81
Belgium 5224 5443 144 1237 27.6 227.3 8.25
Denmark 2713 2763 103 628 38.0 227.3 5.99
Spain 22357 22926 1412 4394 63.2 191.7 3.03
France 30982 32771 4036 16213 130.3 494.7 3.80
Greece 5554 5660 854 1781 153.8 314.7 2.05
Netherlands 8112 8293 193 1293 23.8 155.9 6.55
Norway 2360 2377 106 510 44.9 214.5 4.78
Sweden 4564 4619 225 1233 49.3 266.9 5.41
Sources: Belgian National Institute of Statistics; Japanese Ministry of Health, Labor and Welfare; Japanese Statistics Bureau, Human Mortality Database, Okinawa Prefecture; StatBank Denmark; Statistics Iceland; Statistics Sweden; US Census Bureau.
Table 2: Life expectancies for selected countries and regions in 2005
Country and regions Males Females
Japan 78.6 85.5
Okinawa 77.7 86.3
Italy 78.1 83.7
Sardinia 77.6 83.9
Austria 76.7 82.3
Belgium 76.2 81.9
Denmark 76.0 80.5
Spain 77.0 83.7
France 76.8 83.7
Greece 76.8 81.6
Netherlands 77.3 81.7
Sweden 78.5 82.9
Norway 77.8 82.7
Switzerland 78.7 84.0
USA 75.2 80.4
Sources: Eurostat Database; Hellenic Republic Ministry of Economy and Finance; INED; Japanese Ministry of Health, Labour and Welfare; Human Mortality Database; Italian National Institute of Statistics; Spanish Institute of Statistics; StatBank Denmark; Statistic Iceland; Statistics Sweden; and US National Center for Health statistics.
These data also show the exceptional prevalence of female centenarians in Okinawa. It is two or three times higher than for Japan as a whole and other European and North American countries, and life expectancy is also higher.
Figure 2 compares female life expectancy at 65 and 80 years for all Japanese prefectures and selected countries in 2000. Okinawa is clearly in the lead, followed at some distance by the other Japanese prefectures, and at an even greater distance by the European and North American countries with the highest life expectancies. We therefore conclude that the situation in Okinawa definitely appears to be exceptional. Nevertheless, such an extraordinary demographic situation needs to be fully validated. All of the other alleged cases of exceptional population longevity, e.g., the Caucasus, Ecuador, and Pakistan, have been found to be invalid (Jeune and Kannisto 1997), except for Sardinia,where males have been proven to live significantly longer in the mountainous populations (Poulain et al. 2004).
died at 115, have found nothing that would invalidate either case (Wilmoth et al. 1996, Robine and Allard 1998).
Figure 2: Female life expectancy at 65 and 80 for all Japanese prefectures and selected countries in 2000
Sweden
France
DenmarkUSA Switzerland
Okinawa
Japan
Canada
Belgium Iceland
7.0 8.0 9.0 10.0 11.0 12.0 13.0
18 19 20 21 22 23 24 25
e65
e80
Other Japanese prefectures
Because Japanese demographic data have always been considered extremely reliable, an in-depth investigation was probably never undertaken until we raised the question (Naito and Poulain 2004, Poulain and Naito 2005). Some doubt persists with regard to the absolute reliability of the Japanese data; therefore no unassailable conclusion can be reached from current research into longevity and the determinants of healthy aging in that country. Recent media reports reinforce this statement.6
Population registration and census enumeration procedures have not been completely
6 See, for example, Number of Registered Centenarians in Japan Gets Smaller as Records Culled The Yomiuri Shimbun - McClatchy-Tribune News Service, TOKYO, Sept 05, 2010, accessed at
Okinawa.
free from error. It is clear that in-depth investigation is essential to legitimate all research into the exceptional longevity in Okinawa, and this study should also be viewed as a contribution toward any research using demographic data on
3. Validation of individual and population longevity
According to Thoms (1873), “the proof of [the age of a centenarian] should be clear, distinct and beyond dispute.” With regard to the probability of finding centenarians before 1800 and supercentenarians before 1950, Hynes (1999) said that validation could face “a range of difficulties, which might be impossible to overcome.”If one important piece of information is missing, we cannot conclude that there is “no doubt at all” about the validation: if one element is wrong, the whole validation process is disproved. It is definitely easier to prove that a person is not a centenarian than the opposite. In fact, a well-founded argument is sufficient to invalidate with high probability the age of an alleged centenarian, whereas an imposing set of consistent documents are required to establish a high probability of age validation (Poulain 2010).
Similar rules apply to validating population longevity. The age validation of individual centenarians or a representative sample has to be conducted very carefully. The identification of a few invalidated cases does not necessarily invalidate the longevity of the whole population.7 These cases simply have to be eliminated or
corrected when computing longevity indexes for comparative purposes. Additional rules apply for assessing the comprehensiveness of data collection – all demographic data have to be investigated, including the demographic evolution of the population going back more than a century. This is a key factor for validating exceptional population longevity. However, validating will never be as easy as invalidating individual longevity by means of well-documented arguments. Ensuring the validation of individual longevity on Okinawa is sufficient for identifying the characteristics of centenarians as compared to younger controls. However, any attempt to prove the exceptional longevity of the population of Okinawa, based on the prevalence of centenarians or the level of life expectancy, imperatively requires the validation of the longevity of the whole population.
4. Reliability of available data sources
Several data sources are available to support demographic studies: civil registration (Koseki), the population register (Jyuminhyo), annual lists of centenarians (Zenkoku Koureisha Meibo), vital statistics (Jinkô dôtai chôsa), and population censuses (Kokusei chôsa).
4.1 The civil registration system (Koseki)
The Japanese civil registration system is based on the Koseki, in which official data related to each family are transcribed, including births, deaths, marriages, and divorces. The Koseki is a family register, which records all family relationships. It gives the respondent’s date and place of birth, rank in the family (e.g., first or second son, third daughter), and complete information on parents, siblings, grandparents, and spouse(s). The original Koseki – the Jinshin Koseki – was standardized as the identity register for the whole of Japan on 4 April 1871. However, Kitou (1997) noted that the system could only be considered complete and accurate as of 1886. Moreover, as the Ryukyu Kingdom, which includes Okinawa, was integrated into the Japanese Empire in 1879, the Koseki was introduced progressively starting from 1879, but Matsumoto (1977) concluded that the Koseki in Okinawa has only been fully operational since around 1900.
Due to issues of sensitivity related to the caste system, the Jinshin Koseki was replaced by the Genko Koseki according to a law (Koseki ho) enacted 22 December 1947. All of the Koseki have therefore been updated and the old versions are no longer available for validation purposes. The most important difference between the Jinshin Koseki and the Genko Koseki is that the new system groups individuals by nuclear families (parents and children), whereas the old system registered them according to family lineage, called Ié.8 From an operational perspective, after leaving the parental
home, a child establishes a new Koseki. Two types of Koseki certificates are issued: the Koseki tohon, which contains exact and complete information on all family members, and the Koseki shohon, whichprovides the identical information for an individual who requests this document. The latter document serves as an official birth certificate, as no birth or death register exists in Japan. The Honseki or legal domicile is the place where an individual is registered in the Koseki and where he or she may request these
certificates; it is not necessarily the individual’s usual place of residence. The situation is more complex in Okinawa, as most of the old Koseki were destroyed during WW II and a provisional Koseki was reconstructed both by American authorities in Okinawa and Japanese authorities in Fukuoka. As will be explained later, only following the return of the territory to Japan in 1972 was the new Koseki unified and can it be considered fully operational in Okinawa.
4.2 The population registration system (Jyuminhyo)
In addition to the Koseki, a population register called the Kiyori seido (literally Residence System) was created in 1914. The system was revised according to a law enacted 25 July 1967, and is now known as the Jyumin Kihon Daïcho (literally Resident Population Register). This register contains information on the date and place of birth, sex, marital status, relationship to the head of household, and address of the place of usual residence of all individuals currently living in the same household. The Jyumin Kihon Daïcho continuously updates the usual place of residence of the individual and is thereafter grouped by household rather than family. These documents are used for electoral and other administrative purposes and maintained by the administration of the place of usual residence. The Jyuminhyo serves as official proof of residence. The relationship between the Koseki and the Jyuminhyo is unidirectional: a certified copy of the Koseki has to be presented for registration in the Jyuminhyo, and the legal domicile of the Koseki is recorded in the Jyuminhyo, but the usual place of residence is not included in the Koseki. As Saito (2010) explained, there is another important difference between the Koseki and the Jyuminhyo with regard to accessing individual records. Only family members may request an extract or duplicate of the Koseki, while a certificate of residence for every individual may easily be extracted from the Jyuminhyo for research purposes. Unfortunately, the Privacy Protection Law of 2005 has largely restricted access to the Jyuminhyo. Moreover only individual information is included, limiting the usefulness of that document for age validation.9
4.3 Annual lists of centenarians (Zenkoku Koureisha Meibo)
Lists of the names of centenarians have been compiled by the Ministry of Health and Welfare on September 30 of each year since 1963, in order to celebrate the centenarians on Elders Day, a national holiday now known as Respect for the Aged Day, Keirō no Hi. Since 2003 this day has been celebrated on the third Monday of September. Lists based on the Jyuminhyo are prepared on September 1st and include those who are or
will become centenarians from October 1st to April 1st of the following year.10 The
selection of these dates was linked to the fiscal year, which begins April 1st and ends
March 31. As Robine, Saito, and Jagger (2003) explained, these lists can be used to estimate the number of centenarians on October 1st, considering that some of those
listed will die before October 1st and others who are 99 years old will celebrate their
100th birthday before March 31st. The Ministry in charge of releasing these figures
therefore makes some necessary corrections.
4.4 Vital statistics (Jinkô dôtai chôsa)
Vital statistics on births and deaths by age and sex have been produced annually at the local level since the end of the 20th century. At the beginning of the 20th century, the
delays in reporting births and deaths were quite limited in Japan but in Okinawa births were sometimes reported late, or not at all in the event of early death (Kono 1998). This could have resulted in a lower level of registered infant mortality compared to Japan as a whole, until after WW II, as shown in Figure 3.
4.5 Population censuses (Kokusei chôsa)
In Japan, censuses have been conducted on October 1st every five years since 1920,11
except in 1945. Up until 1940 the de facto population was considered; starting from 1950 it has been the de jure population. U.S. authorities in cooperation with the Government of Okinawa carried out censuses from 1950 to 1970. The reliability of the 1985, 1990, and 1995 Japanese censuses is considered very high, but a more thorough investigation by Iibuchi and Kato (1987) for the Prefecture of Okinawa and two similar
10 The list for 2010 is accessible at http://www.mhlw.go.jp/stf/houdou/2r9852000000roq6-img/2r9852000000rorn.pdf (accessed on April 4, 2011).
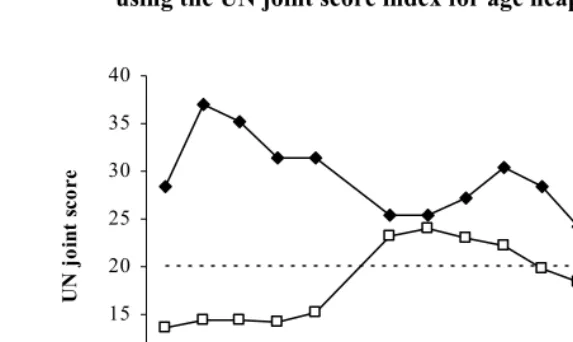
prefectures identified some discrepancies. They compared two successive censuses – 1975 and 1980 – and the deaths registered between them, but only for birth cohorts up to 30 years of age. The UN joint score index can be used for checking age heaping up to age 75. Figure 4 shows opposite trends for Japan as compared with Okinawa, where levels have remained relatively high without signs of recent improvement. With regard to the reliability of the censuses, it is worth mentioning that the number of individuals of unknown age enumerated was higher for Okinawa than for Japan as a whole, except for 2005 (Figure 5).
Figure 3: Infant mortality rates for Okinawa compared with Japan, 1906-1976
0 20 40 60 80 100 120 140 160 180 200
qx
year
Okinawa Japan
Sources: Okinawa Prefecture and the Japanese Statistics Bureau
Figure 4: Comparative reliability of censuses for Okinawa and Japan, using the UN joint score index for age heaping up to age 75
10 15 20 25 30 35 40
19201925193019351940194519501955196019651970197519801985199019952000
U
N
jo
in
t s
co
re
Okinawa Japon Border accurate level
Source: Japanese Statistics Bureau
Figure 5: Proportion of enumerated individuals of unknown age in Okinawa and Japan from 1975 to 2005 (per thousand)
0 1 2 3 4 5 6 7 8 9
1975 1980 1985 1990 1995 2000 2005
Okinawa females
Japan females
Okinawa males
Figure 6: Comparative proportions of oldest olds in Okinawa and Japan as of the 2005 census (per one million inhabitants)
19.610
13.580
33.473
25.574
8.904
7.212
19.782
17.497
3.378 3.082
9.635 9.613
664 761
2.595
3.756
60 133 330 910
-5.000 10.000 15.000 20.000 25.000 30.000 35.000 40.000
Males Japan Males Okinawa Females Japan Females Okinawa
80-84 85-89 90-94 95-99 100+
4.6 Compatibility of data sources with regard to the number of centenarians
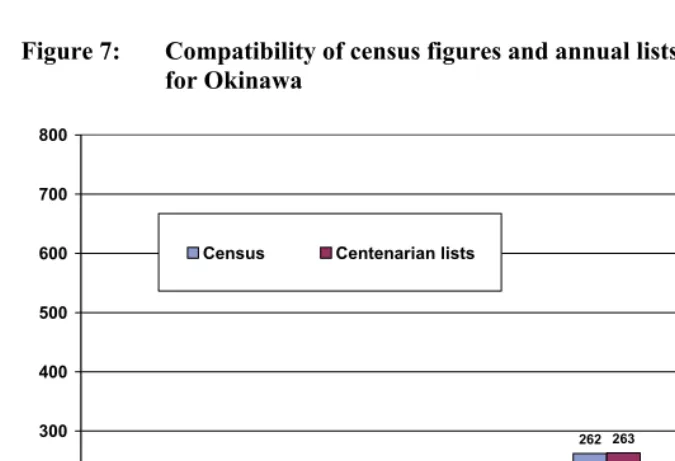
Age is self-reported on censuses, but the annual lists of centenarians are based on administrative records (Jyuminhyo). The compatibility of these two data sources should be checked, even if it can be assumed that most individuals have reported their age as stated in their Koseki. Figure 7 compares these figures for Okinawa. The figures are extremely consistent, except for the last two censuses. The likely reason for these differences is the correction methodology applied by the Ministry for issuing annual figures on centenarians.
The numbers of deaths of centenarians according to vital statistics may also be contrasted with figures obtained by comparing successive annual lists of centenarians. The annual lists do not report the number of centenarians who have died. These lists are dated October 1st, whereas death statistics are produced on an annual basis. A method of
migration after age 100.12 The result of this procedure is applied to Okinawa in
Figure 8. It shows a slight overestimation for the data obtained by comparing successive annual lists of centenarians.
Figure 7: Compatibility of census figures and annual lists of centenarians for Okinawa
37 39
75
162
262
371
720
28 36
76
158
263
401
699
0 100 200 300 400 500 600 700 800
1975 1980 1985 1990 1995 2000 2005
Census Centenarian lists
Source: Japanese Statistics Bureau
Figure 8: Number of centenarian deaths according to vital statistics and by comparing successive annual lists of centenarians
129
308
409
666
123
255
371
588
15 26
48
86
12 20 39
69
0 100 200 300 400 500 600 700
1983-87 1988-92 1993-97 1998-2002
cen
ten
ari
an
s d
ea
th
s
Year
estimated 100-104
vital stat 100-104
estimated 105-109
vital stat 105-109
Sources: Japanese Ministry of Health, Labor and Welfare, and Okinawa Prefecture.
Death registration is considered to be exhaustive; therefore this overestimation should be investigated more thoroughly. A possible explanation is that annual lists might include individuals who survive “administratively” in the Jyuminhyo because their deaths were not registered. The names of these individuals were later removed when the administrative error was found, but they were not included in the death records of that year.13 Access to individual data would be required in order to test this
hypothesis.
5. Evolution of the population of Okinawa
The long-term population trends of Okinawa and the evolution of its age and sex structure have been affected by considerable emigration during the first half of the 20th
century and large human losses during WW II (Figure 9).
Figure 9: The global evolution and sex ratio of the population of Okinawa (F/M) (1876-2009) 0,90 0,95 1,00 1,05 1,10 1,15 1,20 1,25 0 200000 400000 600000 800000 1000000 1200000 1400000 1600000 18 76 18 81 18 86 18 91 18 96 19 01 19 06 191 1 19 16 19 21 19 26 19 31 19 36 19 41 19 46 19 51 19 56 19 61 19 66 19 71 19 76 19 81 19 86 19 91 19 96 20 01 20 06 Se x r at io T ota l p op u la tio n
Total population Sex ratio
5.1 Age and sex structure of the population
A large number of Okinawans left in a short period of time.14 The emigration rate
was among the highest in Japan: by 1940, one out of ten Okinawans had emigrated. The reasons were economic – Okinawa was poor and has natural disadvantages because of its geological location, socio-political – the Ryukyu Kingdom land allocation system was replaced by individual ownership, and personal – emigrants’ success stories and emigration agencies encouraged individuals to leave.
Figure 10: Emigration from Okinawa (1899-1993) (absolute figures)
0 500 1000 1500 2000 2500 3000 3500 4000 4500 5000
1899 1902 1905 1908 1911 1914 1917 1920 1923 1926 1929 1932 1935 1938 1941 1944 1947 1950 1953 1956 1959 1962 1965 1968 1971 1974 1977 1980 1983 1986 1989
Source: Ryukyu Shimpo Journal (http://ryukyushimpo.jp/variety/page-31.html).
The population of Okinawa experienced extreme suffering during WW II, especially during the Battle of Okinawa in 1944. Of the 240,000 casualties listed in the Okinawa Prefectural Peace Memorial Museum, approximately 150,000 were native civilian Okinawans.15 The Peace Memorial and the Okinawa Prefecture tabulated the
comparative age structure of the population in 1940 (Japanese census) and 1945
14 From 1900 to 1940, 20,000 Okinawans left for Hawaii, 17,000 for the Philippines, 14,000 for Brazil, and 11,000 for Peru, according to data published on the Okinawa Prefectural Government web site (accessible at www.pref.okinawa.jp/english/).
(American estimates) (Figure 11). The losses were exaggerated by the fact that many civilians had been evacuated to mainland Japan and had not yet returned in 1945.
Figure 11: The comparative age and sex structure of the population of Okinawa in 1940 (Japanese census before WW II) and 1945 (US estimates after WW II)
60000 40000 20000 0 20000 40000 60000
0 - 4 5 - 9 10 - 14 15 - 19 20 - 24 25 - 29 30 - 34 35 - 39 40 - 44 45 - 49 50 - 54 55 - 59 60 - 64 65 - 69 70 - 74
75 - 79 80+ Female population in 1940
Male P opulation in 1940 Female population in 1945 Male population in 1945
Figure 12: Author’s estimate of the proportion of the Okinawa population who died during WWII, by sex and birth cohort
0% 10% 20% 30% 40% 50% 60% 70% 80% 90% 100%
1935‐39 1930‐34 1925‐29 1920‐24 1915‐19 1910‐14 1905‐09 1900‐04 1895‐99 1890‐94 1885‐89 1880‐84 1875‐79 1870‐74
Males Females
5.2 Evolution of mortality in Okinawa
Comparative life tables are available for Japan and Okinawa every five years at the time of each census, beginning in 1920. A comparison of mortality levels by five-year age groups reveals a clear mortality crossover, as previously discussed (Poulain and Naito 2005, Naito and Poulain 2004). Figure 13 shows the mortality crossover for the 2000 life table; the mortality rates for Okinawa are higher before and lower after age 60, relative to Japan.
the mortality rates in Okinawa and Japan are provided in Table 3. Kaneko (1987) and Takahashi (1993) have previously drawn attention to this contrast between the two groups of cohorts. According to Coale and Kisker’s hypothesis, these two groups of cohorts should have experienced different selection effects or differences in the reliability of their data. More precisely, according to the first hypothesis we might suppose that those born before 1945 experienced more difficult life conditions than the succeeding cohorts, as compared with Japan as a whole. The second hypothesis might be that the age reporting is less reliable for cohorts born in Okinawa before 1945 than in Japan as a whole. The first hypothesis has been supported by several studies that demonstrated the positive impact of caloric restriction on the first group of cohorts (Willcox et al. 2006) and the negative effects of “westernization”, which mainly applies to the younger generations (Kagawa 1978). More recently, Hokama and Binns (2008) attributed this contrast to lower birth weights among the post WW II cohorts.
Even if the first group of factors is acknowledged to have a significant impact on longevity for nutritional reasons, the possible lower quality of the data cannot be excluded because of the sizable impact of the crossover. This impact is more obvious in Tables 4 and 5 where, using data from life tables, the cumulated number of deaths up to age x (Table 4) and life expectancy at age x (Table 5) have been compared for Okinawa and Japan as a whole.16 These data confirm the large differences between the two
groups of generations. The Okinawa life tables show more deaths for both sexes of the generations born after 1940, and higher life expectancy for the generations born before that year. The magnitude of these differences for women is two times greater than it is for men.
Figure 13: Mortality crossover between Okinawa and Japan in 2000
0 1 10 100 1000
0-4 5-9
10-1415-1
9
20-2
4
25-2930-3435-3
9
40-4
4
45-4950-5455-5
9
60-6465-6970-7
4
75-7980-8485-89
Age
qx
Okinawa male
Okinawa female
Japan male
Japan female
Table 3: Corresponding mortality rates for Okinawa and Japan (both sexes)
Age groups 1980 1985 1990 1995 2000 2005
0-4 1.010 1.131 1.196 1.111 1.218 0,932
5-9 0.900 0.922 1.073 0.798 0.920 1.170
10-14 1.200 0.836 1.198 0.895 0.767 1.120
15-19 1.497 1.349 1.179 1.233 1.096 0.840
20-24 1.274 1.316 1.196 1.009 1.133 1.008
25-29 1.344 1.283 1.425 1.132 1.232 1.087
30-34 1.297 1.247 1.356 1.255 1.224 1.288
35-39 1.076 1.116 1.209 1.246 1.345 1.275
40-44 0.929 1.008 1.215 1.187 1.386 1.226
45-49 0.945 0.841 1.033 1.180 1.243 1.385
50-54 0.891 0.818 0.909 1.044 1.039 1.185
55-59 0.932 0.903 0.890 0.937 1.032 1.061
60-64 0.838 0.911 0.882 0.879 0.940 1.059 65-69 0.811 0.806 0.852 0.891 0.959 0.993 70-74 0.743 0.769 0.785 0.866 0.908 0.914 75-79 0.742 0.719 0.785 0.796 0.902 0.873 80-84 0.750 0.710 0.757 0.775 0.819 0.852
Sources: Japanese Ministry of Health, Labor and Welfare and Okinawa prefecture.
Table 4: Ratio of deaths for Okinawa and Japan, cumulated up to age x, as per life tables
Year Age x Males
Okinawa
Females Okinawa
Males Japan
Females Japan
Ratio males
Ratio females
1975 35 5196 3124 3925 2505 1.324 1.247
1980 40 4854 2508 3880 2341 1.251 1.071
1985 45 5128 2812 4372 2540 1.173 1.107
1990 50 6827 3292 5358 3034 1.274 1.085
1995 55 8603 4479 7434 4125 1.157 1.086
2000 60 12472 5558 10448 5238 1.194 1.061
2005 65 16343 7538 14336 6923 1.140 1.089
Table 5: Ratio of life expectancy at age x, for Okinawa and Japan
Year Age x Males
Okinawa
Females Okinawa
Males Japan
Females Japan
Ratio males
Ratio females
1975 35 40.23 46.04 39.04 43.52 1.0305 1.0579
1980 40 37.25 43.35 35.52 40.21 1.0487 1.0781
1985 45 34.04 40.45 31.98 36.95 1.0644 1.0947
1990 50 29.95 36.35 28.19 33.51 1.0624 1.0848
1995 55 25.84 32.33 24.42 29.60 1.0583 1.0922
2000 60 22.37 28.52 21.44 26.85 1.0434 1.0622
2005 65 18.34 24.40 18.13 23.19 1.0119 1.0522
Average 1.0460 1.0750
6. The reliability of demographic data for Okinawa
The key data source for age validation is the Koseki, in which the date of birth is originally recorded. However, a large majority of original Koseki was destroyed at the end of WW II. The particulars of the reconstruction of the Kosekiin Okinawa after 1945 are therefore crucial to assessing the reliability of the current sources of age data.
6.1 Reconstruction of the Koseki after WW II
According to Nishihara (1977), almost all of the Okinawa Koseki were destroyed during WW II – original documents as well as copies. Maeda’s more recent research (2004) found that only 5 of the 41 municipalities, constituting less than one tenth of the population of Okinawa, had intact original documents.17 Six other municipalities had
some original Koseki.
Nishihara (1975, 1977), a jurist and sociologist from Okinawa, undertook an in-depth analysis of the difficult circumstances under which the Okinawa Koseki were reconstructed during the American occupation, from 1945 to 1972. He concluded that the task was extremely difficult due to the lack of documents, original Koseki or other official documents, resource persons, and poor coordination between the U.S. and Japan. The reconstruction of the Koseki was undertaken by American authorities in Okinawa, and by their Japanese counterparts in the Prefecture of Kagoshima (south of
mainland Japan), for all individuals born in Okinawa who were evacuated to mainland Japan during or after WW II.
In the first few months following the end of WW II, no method of documentation existed to estimate the surviving population as support for re-establishing social order. In September 1946 the U.S. administration issued guidelines for establishing a temporary Koseki. The development of this Kosekibegan in early 1947with a limited amount of information.18 The principal aim of the temporary Kosekiwas to distribute
food and manage migration (internal migration, emigration, and repatriation). Another important function was the organization of compulsory work for Okinawans assisting the U.S. administration. The reliability of the data from these temporary Koseki was rather poor, due to the circumstances under which they were collected. It is important to analyze these circumstances in order to assess the reliability of the data. The reconstruction was based on personal interviews with acquaintances or family members. Classmates were sometimes interviewed because the whole family had died in the war. Some discrepancies may also have resulted from the confusion and shock occasioned by the war. “It is evident that this state of shock affected the reliability of the reporting system, and although Okinawans considered age very sacred, there were genuine reasons for unwillingness to participate.”19 The extreme fatigue of the
interviewees made them appear older than they were, the American interviewers probably encountered language barriers, and they also had difficulty interpreting birth dates based on the calendar in use during the Meira era, from 1868 to 1911. In March 1954 the Ryukyu government under U.S. administration finally passed a law instituting a provisional Koseki. The temporaryKosekicontinued to be used, with the result that errors remained even if further information was added. Consequently, numerous inconsistencies arose between the information in the provisional Kosekiand the Koseki developed by the Japanese administration in the Prefecture of Kagoshima, for individuals born in Okinawa but who were living or had lived on mainland Japan. This duplication of the Okinawa Kosekipersisted up to reunification in 1972. Many juridical actions have been initiated requesting changes in the registered information, even after reunification. The actions resulted in changes of surname, given name, filiations, birth date, etc. These types of juridical actions were 30 times more numerous in Okinawa as compared with the Japanese average. Their number varied at different times, but according to Nishihara (1975) certain peaks of activity may be linked to the adoption of particular laws.20 The first such law concerned the welfare of the elderly, and it brought
18 The temporary Kosekiincluded the following information: head of the Kosekior head of household, marital status, address, and members of the household who had died or disappeared during the war. 19 Personal communication of David ITOKAZU, Chairman of the Okinawa International Collaboration on Longevity, 2003.
substantial improvements for those aged 65 years and over. The second, enacted in 1969, instituted a welfare pension for all individuals born before 1899. The third, adopted in 1968 but only operationalized in 1970, granted a welfare pension and a national pension to all male workers above the age of 60 and to female workers above the age of 55 if they had worked more than 20 years. Nishihara reported that the relative number of changes requested during these years was higher for Okinawa compared with the national average, and he did not exclude the possibility of false declarations.
In order to assess the reliability of the local Koseki, we examined the number of legal actions for changes in the Koseki in the 1950s and 60s, as reported by Nishihara (1975, 1977). The number of requests for changes for each municipality was compared with the number of inhabitants, and then with longevity. To assess longevity we divided the total number of centenarians in each municipality born between 1863 and 1903 by the number of inhabitants enumerated in the 1990 census. As shown in Figure 14, the correlation between the number of legal actions and apparent longevity by village is significant (R2 = 0.62).
Figure 14: Correlation between the number of requests for changes in the Koseki and the number of centenarians born between 1863 and 1903 (both figures are reported to the size of the population of each municipality)
R2 = 0,6188
r = 0,79
‐200 0 200 400 600 800 1000 1200
0 200 400 600 800 1000 1200
Number of requests for Koseki changes per 10.000 inhabitants
Nu m b er of ce nt en ar ian s pe r 10 .00 0 in ha b itan ts
6.2 Can demographic data afford misreporting of age?
In a situation where misreporting of age is plausible, it is worth checking whether the demographic data can support such a hypothesis. Four types of errors can be identified with regard to misreporting of age. The first is inadvertent and can be considered as randomly distributed around the actual age, following a Gaussian distribution. In the second type the reported ages are also randomly distributed, but exhibit an innate tendency toward overestimation. The third type of error is an intentional exaggeration of age in order to gain financial benefit; however, as discussed above, this situation is less common. The last situation could be caused by the fact that some reported ages might be exactly 12 years older, due to the twelve signs of the Japanese zodiac.
Preston, Elo, and Stewart (1999) demonstrated that misreporting of age always involves the underestimation of mortality rates at old ages, even if the reported ages are randomly distributed around the actual ages. Consequently, in the instance of any of the above-mentioned types of errors, life expectancy as well as the number of centenarians is overestimated.
By comparing successive censuses we verified whether the evolution of the age and sex structure is compatible with the consequences of possible misreporting of age. We limited our analysis to females, as longevity in Okinawa is primarily a female phenomenon. We used the census data in Annex 2 to calculate the probability of survival from one five-year census to the next, assuming that emigration has not been considered for the population above 50 years of age, and that the probabilities reflect survival between the two censuses. Figure 13 includes all censuses between 1920 and 1970, except for those from 1940 to 1950, as these are more questionable and less comparable, according to Taueber (1955). The six curves are grouped into two sets: censuses before WW II (with a lower likelihood of age misreporting), and those after WW II (with a greater probability of age misreporting). This analysis clearly seems to support the incidence of age misreporting.
Japanese women. The following basic equation allows us to estimate that this “p” would be 30%, assuming that the mortality profile of Japan is applicable and that net migration was negligible.
(
15,773−p)
⋅0.8253+( )
p ⋅0.8830 13,107=Figure 15: Probability of survival for females in Okinawa between two successive censuses before and after WWII
40% 50% 60% 70% 80% 90% 100%
50 - 54 / 45 - 49
55 - 59 / 50 - 54
60 - 64 / 55 - 59
65 - 69 / 60 - 64
70 - 74 / 65 - 69
75 - 79 / 70 - 74
80 - 84 / 75 - 79
1925/20 1930/25
1935/30 1960/55
1965/60 1970/65
Sources: Japanese Ministry of Health, Labor and Welfare, and Okinawa Prefecture.
A third exercise focused on women born at the beginning of the 20th century. Our
intent was to estimate the impact of possible misreporting to explain the high number of females aged 100-104 in 2005 (574 according to the last census) and 105-109 in 2010 (91 according to the list of centenarians21). We assume that, due to misreporting, part of
a given five-year age group was actually born in the following cohort. Therefore a proportion of women reported to be born in 1900-1904 were actually born in 1905-1909. In order to avoid the period of U.S. administration and to limit the possible
impact of migration, the starting date of this exercise is the 1975 census, and we assume that among women born in 1900-1904 aged 70-74 years, a proportion – “p” – was born in 1905-1909 and was actually 65-69 years of age. For example, let us suppose that this proportion is successively 10%, 20%, and 30% of the 12,125 women reported to be 70-74 years of age at the time of the 1975 Okinawa census. In Table 6 we use Japanese life tables to estimate the number of these women who will survive between each pair of censuses, up to 2005. The results show that the number of women who would be 100-104 years of age in 2005 in Okinawa would only be 246, had the population experienced the same mortality rates as Japan as a whole. If we assume that 10% of women declared to be aged 70-74 at the time of the 1975 census actually belonged to the cohorts born in 1905-1909, and apply the survival rates for the younger age group, 318 would be alive in 2005. If 20% misreporting is assumed, 389 of these women would be alive in 2005, and a 30% age misreporting assumption would yield a figure of 461, of whom only 173 are centenarians (37%).
Table 6: Estimating the effect of possible age misreporting: third exercise (see preceding text)
Newborn
cohorts 1975 1980 1985 1990 1995 2000 2005 2010
Japan survival rates
1900-1904 81.7% 73.1% 61.3% 53.7% 45.7% 22.6% 10.4% 1905-1909 89.8% 84.7% 77.0% 65.1% 53.6% 38.9% 23.9%
Number of those surviving, assuming no age misreporting
1900-1904 12125 9910 7248 4445 2387 1090 246 26
Number of those surviving, assuming 10% misreporting as of the newborn cohorts
1900-1904 10192 8919 6523 4001 2149 980 222 23
1905-1909 1213 1088 922 710 462 248 96 23
Total 12125 10007 7445 4711 2611 1228 318 46
Number of those surviving, assuming 20% misreporting as of the newborn cohorts
1900-1904 9699 7928 5798 3556 1910 871 197 20
1905-1909 2426 2176 1844 1420 924 496 192 46
Total 12125 10104 7462 4976 2834 1367 389 66
Number of those surviving, assuming 30% misreporting as of the newborn cohorts
1900-1904 8486 6937 5073 3112 1671 762 173 18
1905-1909 3639 3264 2766 2310 1386 744 288 69
7. Discussion
A classical individual validation of the age of alleged centenarians is not sufficient to validate the exceptional longevity of the population of Okinawa. Validating population longevity requires several types of demographic analysis, as well as verification of the accuracy of the demographic data.
Saito (2010) has confirmed that individual age validation of the oldest olds in Japan is quite difficult because of limited access to original data sources. Certificates of residence (Juminahyo) may be obtained quite easily, but these are secondary sources that do not provide enough information for age validation purposes, and, furthermore, such data can be discarded five years after death. The Koseki tohon contains more information, but the authorization of the family is required to access this data. Only copies of the original Koseki in which the birth of the person was initially recorded can be obtained. However, a full reconstruction of the family cannot be achieved on the basis of that document. The situation in Okinawa is even more problematic, as almost all the original Koseki have disappeared, and the existing Koseki were reconstructed after WW II under very difficult conditions.
We compared the longevity of the population of Okinawa with one of the other Japanese prefectures and the best examples of longevity from European and North American countries. The use of centenarian prevalence (the number of centenarians relative to the population) should be avoided, as it is not a valid index for comparing longevity between different populations. By presenting life expectancies at 65 and 80 years of age, based on official life tables, we demonstrate that Okinawa is in the lead, followed at a considerable distance by all the other Japanese prefectures and selected countries. According to the life tables longevity in Okinawa definitely appears to be exceptional, and validation of the longevity of the population is required.
The demographic analysis conducted to validate the exceptional longevity of the population of Okinawa exhibits a mortality crossover when comparing Okinawa and Japan. According to Coale and Kisker (1986) this crossover could result from a selection effect or bad data. We think that both could apply to the findings for Okinawa. The differences in behavior and nutrition between the two groups of generations in Okinawa and Japan have been established (Kagawa 1978), and caloric restriction only affected those born before WW II (Willcox et al. 2006). Nevertheless, the impact of nutrition would have to be enormous to justify the survival rates, and such a hypothesis would have difficulty explaining the considerable difference between males and females. Therefore, the “bad data” hypothesis has to be thoroughly investigated.
The circumstances in which the Koseki in Okinawa was reconstructed after WW II, up to the reunification with Japan in 1972, support the hypothesis that the age of a significant number of persons born before 1945 could have been misreported. We believe that, although there were reasons for overstating age, most of the errors were probably inadvertent. Longevity can be compared between areas where the Koseki were reconstructed and others where they remained intact, but the differences are not statistically significant. In order to assess the possible effect of the reconstruction of the Koseki on reported longevity, we preferred to consider the number of legal actions initiated in the 1950s and 60s for changes in the Koseki, as reported by Nishihara (1975, 1977). As shown by his research, the correlation between the number of legal actions and longevity by village is significant. This conclusion contradicts that proposed by Willcox et al. (2008) and confirms the necessity of considering the bad data hypothesis.
the validity of the longevity of the population. However, such arguments are necessary but not sufficient for validating population longevity, as random misreporting and overstating of age may easily meet all these requirements. For example, the observation that the maximum reported age at death is 112 for both men and women is not sufficient to validate longevity. We must bear in mind that local authorities usually scrutinize more closely the data for the oldest olds, and any error discovered would therefore be immediately corrected. The high female/male sex ratio among the oldest olds also cannot be regarded as validating longevity in Okinawa, because it has been proven that, for regions of Italy, higher longevity is associated with a lower ratio (Robine et al.
2006).
The two simple theoretical exercises we have proposed in this article lend credence to the assumption that misreporting, e.g. overstating of the age of some individuals born before WW II, has influenced the age and sex structure of the population of Okinawa. These results do not prove the existence of bad data, but point to the need for in-depth validation.
8. Acknowledgments
References
Canudas-Romo, V. (2010). Three measures of longevity: Time trends and record values. Demography 47(2): 299-312. doi:10.1353/dem.0.0098.
Coale, A.J. and Kisker, E.E. (1986). Mortality crossovers: Reality or bad data?
Population Studies 40(3): 389-401. doi:10.1080/0032472031000142316.
Coale, A.J. and Li, S. (1991). The effect of age misreporting in China on the calculation of mortality rates at very high ages. Demography 28(2): 293-301. doi:10.2307/ 2061281.
Franceschi, C., Bezrukov, V., Blanché, H., Bolund, L., Christensen, K., de Benedictis, G., Deiana, L., Gonos, E., Hervonen, A., Yang, H., Jeune, B., Kirkwood, T.B., Kristensen, P., Leon, A., Pelicci, P.G., Peltonen, L., Poulain, M., Rea, I.M., Remacle, J., Robine, J.M., Schreiber, S., Sikora, E., Slagboom, P.E., Spazzafumo, L., Stazi, M.A., Toussaint, O., and Vaupel, J.W. (2007). Genetics of healthy aging in Europe: The EU-integrated project GEHA (Genetics of Healthy Aging). Annals of the New York Academy of Sciences 1100: 21-45.
doi:10.1196/annals.1395.003.
Hokama, T. and Binns, C. (2008). Declining longevity advantage and low birthweight in Okinawa. Asian-Pacific Journal of Public Health 20(Suppl.): 95-101.
Hynes, J. (1999). The oldest old in pre-industrial Britain: Centenarians before 1800 – Fact or fiction? In: Jeune, B. and Vaupel, J.W. (eds.). Exceptional Longevity: From Prehistory to the Present. Odense University Press.
Iibuchi, Y. and Kato T. (1987). Futatsu no seikaku no kotonaru jinko tokei wo tsukatta shibousha ni kansuru kenkyu – Okinawa ken to ta san ken tono hikaku –.
Statistics 52: 16-27.
Jeune, B. and Kannisto, V. (1997). Emergence of centenarians and super-centenarians.
Longevity: To the Limits and Beyond. Berlin: Springer: 77-89.
Kagawa, Y. (1978). Impact of westernisation on the nutrition of Japanese: Changes in physique, cancer, longevity and centenarians. Preventive Medicine 7(2): 205-217. doi:10.1016/0091-7435(78)90246-3.
Kaneko, T. (1987). Trends in regional differences in age-specific mortality rates. Jinko Mondai Kenkyu/Journal of Population Problems 184(Oct): 39-51.
Kitou, H. (1997). Meijiotaishoki jinko tokei ni okeru shussho. Jyochi Keizai Ronshu
43(1): 41-65.
Kono, S. (1998). Okinawa no heikinjumyo no tokeiteki kenkyu [Statistical research on life expectancy in Okinawa]. Program: 119, Conference of Population Association of Japan, Chuo University, June 4-6, 1998.
Maeda, T. (2004). Koseki teisei to Okinawa [Modification of the Koseki and Okinawa].
Geppo Shiho shoshi [Judicial reporter’s monthly report] 388(6). (http://www.shiho-shoshi.or.jp/web/publish/geppou/200406/2004_06_021.html). Matsumoto, T. (1977). Sengo Okinawa no kazoku to ho [Family and laws in Okinawa
after the war]. The Sociology of Law 29: 80-90.
Naito, K. and Poulain, M. (2004). Okinawa ken ni okeru 2000 nen made no shibouritsu suii [Mortality trends in Okinawa up until 2000]. The Journal of Population Studies 35: 13-33.
Nishihara, J. (1975). Sengo Okinawa no seiji to ho [Changes and problems with the Koseki law]. In: Politics and Laws in Okinawa after the War: 653.
Nishihara, J. (1977). Sengo Okinawa no Koseki housei [Koseki legislation in Okinawa after WWII]. The Sociology of Law 29: 90-100.
Oblak Flander, A. (2009). The study of administrative survivers among centenarians, nonagerians and octogenarians. The Slovenian Statistical Office.
Poulain, M. (2010). On the age validation of supercentenarians. In: Maier. H., Gampe, J., Jeune, B., Robine, J.M., and Vaupel, J.W. (eds.). Supercentenarians.
Demographic Research Monographs. Springer-Verlag: 3-30.
Poulain, M., Deiana, L., Ferrucci, L., Pes, G.M., Carru, C., Franceschi, C., and Baggio, G. (2006). Evidence of an exceptional longevity for the mountainous population of Sardinia. In: Robine, J.M. and Horiushi, S. (eds.). Human longevity, individual life duration and the growth of the oldest-old population. Springer-Kluwer: 146-166.
Poulain, M. and Naito, K. (2005). L’évolution de la longévité à Okinawa. Cahiers québécois de démographie 33(1): 29-49.
Preston, S.H., Elo, I.T., and Stewart, Q. (1999). Effects of age misreporting on mortality estimates at older ages. Population Studies 53(2): 165-177.
doi:10.1080/00324720308075.
Robine, J.M. and Allard, M. (1998). The oldest human. Science 279(5358): 1831.
doi:10.1126/science.279.5358.1831h.
Robine, J.M., Caselli, G., Rasulo, D., and Cournil, A. (2006). Differentials in the femininity ratio among centenarians: Variations between Northern and Southern Italy from 1870. Population Studies 60(1): 99-113. doi:10.1080/00324720500 466000.
Robine, J.M., Saito, Y., and Jagger, C. (2003). The emergence of extremely old people: The case of Japan. Experimental Gerontology 38(7): 735-739. doi:10.1016/ S0531-5565(03)00100-1.
Saito, Y. (2010). Supercentenarians in Japan. In: Maier. H., Gampe, J., Jeune, B., Robine, J.M., and Vaupel, J.W. (eds.). Supercentenarians. Demographic Research Monographs. Springer-Verlag: 75-99. doi:10.1007/978-3-642-11520-2_5.
Taeuber, I.B. (1955). The population of the Ryukyu Islands.Population Index 21(4): 233-263. doi:10.2307/2730846.
Takahashi, S. (1993). Health and mortality differentials among the elderly in Japan: A regional analysis with special emphasis on Okinawa. Institute of Population Problems (Working Paper Series 17: 26).
Thoms, W.J. (1873). Human longevity, its facts and its fictions. London: John Murray. Willcox, B.J., Willcox, D.C., and Suzuki, M. (2001). The Okinawa Program: How the
world’s lived people achieve everlasting health and how you can, too. New York: Clarkson Potter Publishers.
Willcox, D.C., Willcox, B.J., He, Q., Wang, N., and Suzuki, M. (2008). They really are that old: A validation study of centenarian prevalence in Okinawa. Journal of Gerontology: Biological Sciences 63A(4): 338-349.
Willcox, D.C., Willcox, B.J., Todoroki, H., Curb, J.D., and Suzuki, M. (2006). Caloric restriction and human longevity: What can we learn from the Okinawans?
Biogerontology 7(3): 173-177. doi:10.1007/s10522-006-9008-z.
Annexes
Annex 1: Evolution of the number of centenarians by sex in Okinawa and Japan 1963-2010
YEAR OKINAWA M OKINAWA F JAPAN M JAPAN F Okinawa prevalence
Japan prevalence
Sex ratio F/M Okinawa
Sex ratio F/M Japan
1963 20 133 - 0.1591 6.65
1964 31 160 - 0.1965 5.16
1965 36 162 - 0.2015 4.50
1966 0 10 46 206 1.06 0.2544 4.48
1967 0 8 52 201 0.84 0.2539 3.87
1968 1 12 67 260 1.36 0.3244 12.00 3.88
1969 3 13 70 261 1.68 0.3244 4.33 3.73
1970 2 7 62 248 0.95 0.3006 3.50 4.00
1971 3 6 70 269 0.96 0.3249 2.00 3.84
1972 5 9 78 327 1.46 0.3830 1.80 4.19
1973 5 23 91 404 2.82 0.4580 4.60 4.44
1974 8 18 96 431 2.55 0.4817 2.25 4.49
1975 5 23 102 446 2.68 0.4926 4.60 4.37
1976 5 22 113 553 2.55 0.5924 4.40 4.89
1977 2 29 122 575 2.89 0.6141 14.5 4.71
1978 5 19 132 660 2.22 0.6916 3.80 5.00
1979 8 23 180 757 2.83 0.8115 2.88 4.21
1980 6 30 174 794 3.25 0.8322 5.00 4.56
1981 8 32 202 870 3.58 0.9146 4.00 4.31
1982 10 34 233 967 3.89 1.0169 3.40 4.15
1983 12 46 269 1085 5.06 1.1399 3.83 4.03
1984 11 57 347 1216 5.85 1.3077 5.18 3.50
1985 11 65 359 1381 6.45 1.4468 5.91 3.85
1986 22 68 361 1490 7.55 1.5304 3.09 4.13
1987 19 78 462 1809 8.07 1.8686 4.11 3.92
1988 18 100 562 2106 9.75 2.1864 5.56 3.75
1989 21 126 630 2448 12.07 2.5135 6.00 3.89
1990 19 139 680 2618 12.93 2.6874 7.32 3.85
1991 25 147 749 2876 13.99 2.9447 5.88 3.84
1992 30 163 822 3330 15.58 3.3626 5.43 4.05
1993 34 172 943 3859 16.49 3.8792 5.06 4.09
1994 40 191 1093 4500 18.31 4.5080 4.78 4.12
1995 47 216 1255 5123 20.66 5.1312 4.60 4.08
1996 50 232 1400 5973 21.98 5.9122 4.64 4.27
1997 54 261 1570 6921 24.40 6.7948 4.83 4.41
1998 66 297 1812 8346 27.90 8.1101 4.50 4.61
1999 61 304 1973 9373 27.82 9.0455 4.98 4.75
2000 57 344 2158 10878 30.42 10.3779 6.04 5.04
2001 55 402 2541 12934 34.42 12.2907 7.31 5.09
2002 58 467 2875 15059 39.24 14.2324 8.05 5.24
2003 64 505 3159 17402 42.18 16.1112 7.89 5.51
2004 77 558 3523 19515 46.79 18.0426 7.25 5.54
2005 84 615 3760 21593 51.14 19.8430 7.32 5.74
2006 74 666 4150 24245 54.09 22.2217 9.00 5.84
2007 75 717 4613 27682 57.68 25.2757 9.56 6.00
2008 94 744 5076 31200 60.90 28.4090 7.91 6.15
2009 107 821 5447 34952 66.97 25.2757 9.56 6.00
Annex 2a: Age and sex structure of the population of Okinawa 1890-2005, females
1890 1895 1900 1905 1910 1915 1920 1925 1930 1935 1940 1945 Females
0 - 4 23192 27586 23996 24948 33393 30886 40450 40518 41965 42352 40234 5 - 9 21965 23233 26464 23140 28412 31711 34401 36440 37641 38997 38791 10 - 14 21276 22114 22887 25549 24972 28015 32307 31008 33991 35116 35723 15 - 19 21366 21419 22048 22687 25115 24929 28429 21654 25105 24894 22075 20 - 24 19436 20985 20928 21816 22764 26154 23144 20965 21902 21312 19061 25 - 29 16064 19087 20720 20781 21466 22784 21793 19461 20175 19871 17862 30 - 34 14327 15317 18487 19299 20074 21107 18566 18553 17875 19032 17674 35 - 39 12004 13714 14523 17299 18007 19270 17304 16806 15755 16949 17638 40 - 44 10861 11215 12987 13733 16353 17274 15981 15766 15775 16610 15784 45 - 49 11266 10319 10622 12088 13083 15651 15112 14812 14933 14865 15624 50 - 54 7847 10518 9627 9728 11279 12142 13818 14002 13934 13915 13974 55 - 59 6556 7188 9457 8623 8827 10061 10578 12477 12836 12892 12723 60 - 64 6577 5923 6248 8359 7697 7820 8788 9634 11304 11744 11683 65 - 69 4603 5409 4766 5224 6588 6166 6335 7343 8030 9633 9890 70 - 74 3761 3474 3862 3564 3928 4844 4719 4950 5819 6395 7683 75 - 79 1982 2447 2093 2349 2445 2488 3323 3108 3333 4033 4346 80 - 84 980 1025 1138 1123 1430 1362 1238 1676 1639 1808 3088
85 - 89 365 329 358 475 517 660 388 428 591 610
90 - 94 54 82 56 89 182 191 58 81 99 155
95 - 99 4 5 11 16 41 67 10 6 10 14
>= 100 1 8 29 1 1 1
Annex 2a: (Continued)
1950 1955 1960 1965 1970 1975 1980 1985 1990 1995 2000 2005 Females
0 - 4 56170 65675 59209 52933 50146 54896 50945 49249 45266 41805 40151 39824 5 - 9 38038 55467 66259 59645 53141 51719 56368 51945 49602 46128 42569 41247 10 - 14 42332 37797 55220 65941 59207 53661 51867 56417 51592 49417 46128 42683 15 - 19 39398 41797 35044 47094 52075 50031 46496 47392 52162 48915 46741 44005 20 - 24 32826 37425 37702 31158 35424 44240 39828 39984 40334 48171 43000 42191 25 - 29 26518 31409 35654 36865 30550 40127 48360 45405 42231 43861 49817 46852 30 - 34 22593 25775 30746 33872 35217 32295 41519 50233 45747 43938 45117 52381 35 - 39 19974 22532 25443 29495 32826 36167 32505 41586 49813 46211 44249 46274 40 - 44 17707 19497 22041 24643 28626 33005 35863 32100 40829 49358 45808 44506 45 - 49 15915 17233 19099 21375 23944 28732 32871 35556 31457 40555 48646 45934 50 - 54 13414 15457 16751 18889 20647 23358 28504 32439 35027 31407 39674 48558 55 - 59 12224 12791 14980 16051 17387 19989 23190 28041 31914 34918 30745 39911 60 - 64 10373 11773 12208 14212 15241 17255 19807 22835 27477 31615 34463 30753 65 - 69 8001 9236 10839 11281 13017 14670 16707 19183 22185 27002 30795 33918 70 - 74 5870 7014 8117 9679 10175 12125 13878 15846 18242 21457 25929 29786 75 - 79 3684 4578 5658 6683 7804 8602 10801 12636 14668 16987 19772 24342 80 - 84 2390 2515 3283 3994 4855 5982 7006 9039 10747 12761 14856 17725
85 - 89 933 1886 2386 3055 4019 4988 6745 8298 9909 12127
90 - 94 - 1953 621 831 1121 1537 2244 2951 4098 5337 6663
95 - 99 - 135 219 200 298 513 811 1221 1889 2603
>= 100 - 4 18 28 32 65 145 215 318 631
Unreported 24 73 27 0 560 466 299 3784 365 4430 178
Total 367427 418928 460279 486483 493736 531818 562867 597995 623729 648703 670343 693092
Annex 2b: Age and sex structure of the population of Okinawa 1890-2005, males
1890 1895 1900 1905 1910 1915 1920 1925 1930 1935 1940 1945
Males
0 - 4 23563 27688 25059 21013 34022 32465 40032 40238 42492 42314 41474 5 - 9 22459 23507 26738 24628 29764 31948 34572 36461 38319 40189 39467 10 - 14 22084 22597 23303 25824 25752 29469 32130 33052 34708 36567 38154 15 - 19 21750 22021 22268 22761 25685 25809 28209 26165 26672 28149 22691 20 - 24 20086 21581 21588 21886 22675 25825 20553 18766 17899 18434 17436 25 - 29 16668 19604 21169 21160 21709 22492 20758 15799 15564 16161 14204 30 - 34 13778 16013 18793 20104 20642 20679 16314 16063 14098 14895 13120 35 - 39 11953 14009 14974 17784 18552 19460 16179 13685 14627 13569 13281 40 - 44 10990 11203 12935 14225 16142 17892 15296 14010 12554 13843 12536 45 - 49 10949 10106 10358 11862 13015 15223 14409 13644 13030 11792 12869 50 - 54 7308 9732 9031 9137 10847 11737 12448 12669 12461 12007 10871 55 - 59 5795 5498 8176 7680 7817 9327 8851 10601 10990 10994 10604
60 - 64 5141 4702 4969 6367 6394 6210 6543 7243 8768 9351 9227
65 - 69 3206 3660 3358 3722 4779 4686 4031 4839 5289 6731 7129
70 - 74 2300 1996 2279 2237 2677 3043 2581 2573 3177 3609 4628
75 - 79 989 1235 1006 1273 1342 1463 1384 1431 1413 1814 2000
80 - 84 422 436 496 485 617 580 411 552 570 633 942
85 - 89 122 131 122 199 210 245 111 118 142 187
90 - 94 11 21 15 27 60 72 13 21 22 26
95 - 99 1 - 1 4 8 17 4 3 2 1
>= 100 - 1 4 0 0 -
Annex 2b: (Continued)
1950 1955 1960 1965 1970 1975 1980 1985 1990 1995 2000 2005 Males
0 - 4 58575 68096 61186 55191 51599 57413 53301 51631 47619 44026 42443 41975 5 - 9 39749 57956 68247 61183 54948 53581 59125 54576 52037 48535 44631 43530 10 - 14 43557 39756 57432 68155 60281 55268 53787 58705 53720 51391 48357 44944 15 - 19 38705 41759 36091 49014 51371 51735 48144 48970 53200 50697 48771 46038 20 - 24 27767 35286 34830 27672 31894 46299 40597 39763 38271 48122 43467 41843 25 - 29 19787 27342 34510 34533 28532 42975 51440 46584 40955 42127 48895 46053 30 - 34 16917 19915 27142 33715 34089 32791 44593 54600 46480 43646 43743 51493 35 - 39 15461 17031 19662 25963 33104 36850 33322 45424 52829 47497 44259 45398 40 - 44 13717 15679 16776 18976 25054 34794 36665 33357 43767 52813 47132 44799 45 - 49 12145 13587 15155 16146 18137 25907 33855 36068 31887 43353 51829 47122 50 - 54 10727 11832 13063 14584 15292 18051 25053 32920 34442 31254 42325 51718 55 - 59 9854 10057 11189 12074 13080 14869 17375 24265 31505 33755 30335 41993 60 - 64 7427 9190 9183 9957 10996 12645 14187 16597 22960 30539 32810 30224 65 - 69 5291 6344 8049 7874 8690 10010 11533 13115 15406 21641 28707 31460 70 - 74 3590 4303 5106 6378 6435 7346 8725 10224 11735 13927 19604 26264
75 - 79 1865 2414 3061 3540 4471 4917 5760 7146 8548 9856 11889 16821
80 - 84 831 1049 1455 1804 2176 2938 3337 4099 5264 6378 7465 9078
85 - 89 285 710 901 1111 1666 1959 2502 3273 4056 4821
90 - 94 - 650 171 272 369 438 742 897 1133 1613 2060
95 - 99 - 28 68 56 75 138 219 273 365 509
>= 100 - 1 3 9 7 10 17 47 53 89
Unreported 19 56 24 0 820 707 209 4409 454 5128 270