The Effects of Changes in Height on the Aerodynamic
Performance of Automobiles
Hossein Afshar1*, Alireza Fahimi2, Mohammad Ali Keshvari3
1 Department of Mechanical Engineering, East Tehran branch, Islamic Azad University, Tehran, Iran, 2 Mechanical Engineering, MA student at Islamic Azad University, Center Tehran 3 Department of Mechanical Engineering, Science and Research Branch, Islamic Azad University, Tehran, Iran,
Abstract
In this study, the fluid flow around a Pride vehicle was solved in a two-dimensional design using numerical methods. To do so, a two-dimensional figure of a Pride was modeled and gridded, and different surfaces were introduced. Then, governing equations the fluid flow was solved for the standard K-ε model and the appropriate boundary conditions. Areas that increased lift and drag forces were specified through studying the results and observing flow lines, pressure distribution, and vortices created around the automobile. In this way, the ideal height for different speeds was determined through examining the changes in those forces at different heights. In this study, the Pride was examined at different heights 80, 120, 160 (standard), 200, and 250 mm for the speeds 10, 20, 33, and 40 m/s. The results showed that lift and drag forces depended on the height of the automobile and changed at different heights
Keywords: Aerodynamic, Surface effect, Pride vehicle, Computational fluid dynamics (CFD)
1. Introduction
Forces on moving objects are of important matters in designing them. The change in the height of an automobile can affect the lift and drag forces exerted by the air. Regarding the changes in forces on the automobile following the change in height, the automobile can be examined in terms of different aspects, including resistance, fuel consumption, forces exerted by the ground, and other items.
In 1958, Hoerner introduced the underbody of the automobile as one important and unavoidable component in making drag force on the automobile, and explained that the drag force on an automobile with flat underbody changes from 0.3 up to 0.6 for an automobile with uneven and open underbody [1]. Carr G. W. showed aerodynamic effects of the underbody components of an automobile on a model through laboratory studies [2]. Holt (1982) showed that the automobile underbody could be discussed as a basic part of aerodynamics [3]. Copper (1998) showed that a high percentage of lift and drag forces were affected by the automobile underbody [4]. Skea
(1998-2000) provided methods for underbody aerodynamics and studied the feasibility of CFD as an appropriate instrument for analysis of such matters [5, 6]. Casella examined CFD‟s feasibilities related to the underbody and obtained favorable results because his answers conformed well to the experimental values [7].
2) Geometric characteristics of the automobile
• Length: 3935 mm • Width: 1605 mm • Total height: 1455 mm
• The automobile height from its bottom to the ground: 160 mm
Considering limitations for two-dimensional designing of real objects, curvatures along the width of the automobile and accessories, such as mirrors, tires, wipers, and underside pieces of the automobile were excluded from the study.
3) Grid generation around the automobile
The design was gridded systematically regarding the geometric complexities and also to increase the
vertical and horizontal directions. Moreover, K- ε model was used to model turbulences in the momentum equation.
The continuity equation:
0 y u x u
Momentum equation in the vertical and horizontal directions:
x
y
u u x P y u V x u U P 2 2 2 2 Momentum equation for turbulent flows:
. ij
D
p g F
Dt
(3)
The k-ε equations: G k k x x u
x k j
t j i i ) ( ) (
(4) 2 2 1 ) ( )
( C G C
x x u x j t j i i
(5)
should be non-slip were simulated using wall functions.
6) Solution
The Cartesian coordinate system was chosen as the reference system. Discretization of equations was done using the first-order method, and speed and pressure equations were coupled using SIMPLE algorithm with first-order accuracy. The standard K- ε model was used to model turbulences.
Besides the standard height, the automobile was examined at four other heights 80, 120, 200, and 250 mm for the input speeds 10, 20, 33, and 40 m/s.
The domain around the automobile was gridded with 147000, 168000, and 242000 cells, and the obtained results were examined. Regarding the insignificant changes with the increase in grids, the results of 168000 cells were examined.
7) Results
Distribution of speed and pressure
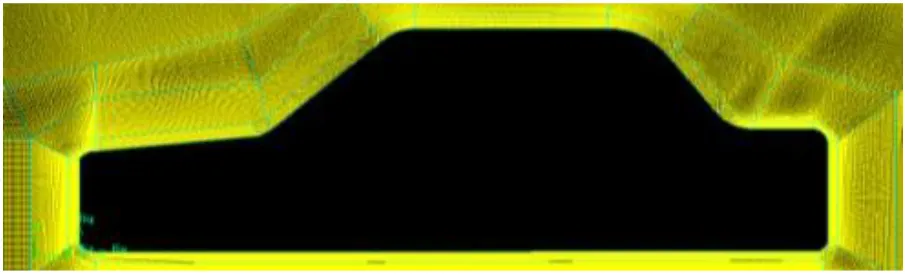
Figure 2 shows the changes in the pressure exerted on the automobile at the height 80 mm and the speed 33 m/s.
Fig .1. Grid generation around the automobile
Fig. 2. Changes in the pressure exerted on the automobile at the height 80 mm and the speed 33 m/s
Fig. 3. Maximum and minimum pressure around the automobile
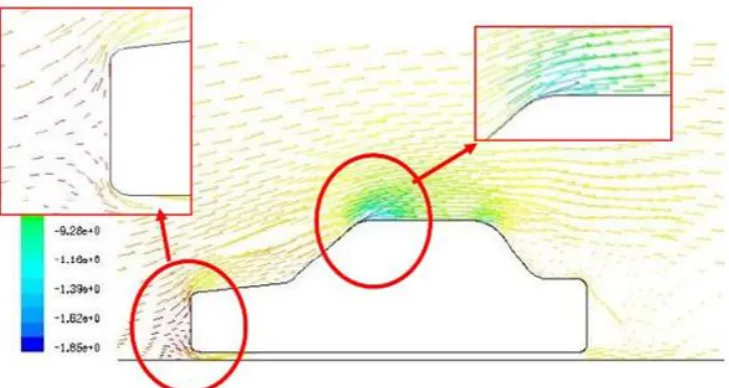
Fig.4. Pressure vectors for the height 80 mm and the speed 10 m/s
As shown by Figure 3, at all heights, maximum pressure was exerted on the front part and minimum pressure was exerted on the initial part of the automobile roof.
In the automobile aerodynamics, the static pressure and its distribution around the automobile were of special importance. Figure 4 shows pressure vectors for the height 80 mm and the speed 10 m/s.
considering the above pattern, the pressure was higher than the environmental pressure in some parts and was lower than the environmental pressure in some other parts. The decrease in the pressure on the curvatures and mentioned parts was due to the separation of flow from the automobile surface. Regarding the large part at the rear of the automobile, maximum drag force was exerted on this area.
Aerodynamic Forces and Moments
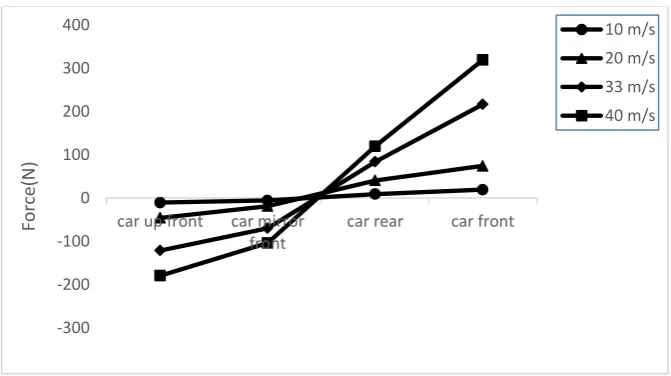
Figure 6 shows the forces exerted on the automobile in the direction of horizontal axis.
very insignificant as the speeds lower than 10 m/s could be disregarded. This showed a direct correlation between speed and the torque around the automobile center of gravity.
Fig .5. Pressure vectors for the height 80 mm and the speed 10 m/s
Fig.6. Maximum and minimum drag forces at different speeds and the height 250 mm
-300 -200 -100 0 100 200 300 400
car up front car mirror front
car rear car front
Force(
N
)
10 m/s 20 m/s 33 m/s 40 m/s
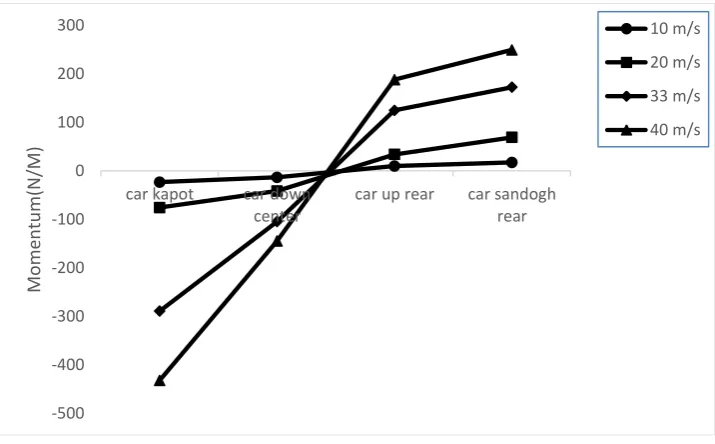
Fig.7. Maximum and minimum lift forces at different speeds and the height 250 mm
Fig.8. the torque exerted on the automobile at different speeds and the height 250 mm
The effects of changed height on drag forces
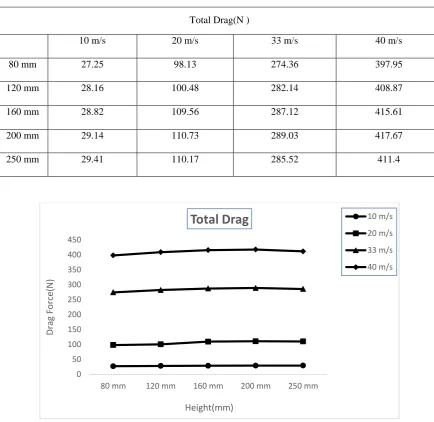
Table 1 provides the total drag force exerted on the automobile in terms of different heights and speeds. Figure 9 shows changes in drag force in terms of different heights and speeds. As seen in the figure, the
drag force exerted on the automobile increased with the increased height from 80 mm to 200 mm but decreased at heights over 200 mm.
-500 -400 -300 -200 -100 0 100 200 300
car kapot car down center
car up rear car sandogh rear
Mo
m
en
tu
m
(N/M)
10 m/s
20 m/s
33 m/s
40 m/s
200 mm 29.14 110.73 289.03 417.67
250 mm 29.41 110.17 285.52 411.4
Fig.9. changes in drag force in terms of different heights and speeds
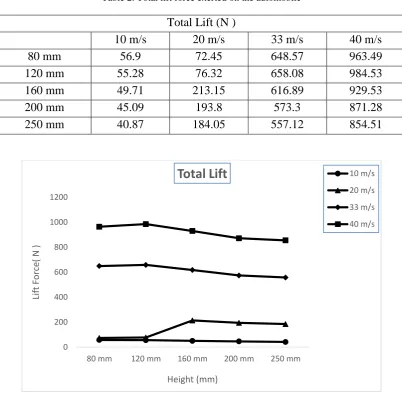
The effects of changed height on lift forces
Table 2 provides the total lift force exerted on the automobile in terms of different heights and speeds. Figure 10 shows changes in lift force in terms of different heights and speeds. As seen in the figure, the lift force exerted on the automobile increased significantly with the increased speed at each height up to the height 120 mm but decreased at heights over 120 mm and constant speed.
The effects of changed height on the torque
around the automobile center of gravity
Table 3 provides the total torque around the automobile center of gravity in terms of different heights and speeds. Figure 11 shows changes in the torque around the automobile center of gravity in terms of different heights and speeds As seen in the figure, the torque around the automobile center of gravity had a direct correlation with the increased height and speed of the automobile.
0 50 100 150 200 250 300 350 400 450
80 mm 120 mm 160 mm 200 mm 250 mm
Drag
Force(
N
)
Height(mm)
Total Drag
10 m/s20 m/s
33 m/s
40 m/s
Table 2. Total lift force exerted on the automobile
Total Lift (N )
10 m/s
20 m/s
33 m/s
40 m/s
80 mm
56.9
72.45
648.57
963.49
120 mm
55.28
76.32
658.08
984.53
160 mm
49.71
213.15
616.89
929.53
200 mm
45.09
193.8
573.3
871.28
250 mm
40.87
184.05
557.12
854.51
Fig.10. Changes in lift force in terms of different heights and speeds.
Table3. Total torque around the automobile center of gravity
Total Momentum(N/M )
10 m/s
20 m/s
33 m/s
40 m/s
80 mm
3.66
50.29
67.14
103.89
120 mm
15.08
105.8
182.22
270.63
160 mm
24.2
110.4
277.44
408.96
200 mm
32.24
130.69
357.5
525.16
250 mm
40.31
163.43
444.82
652.31
0 200 400 600 800 1000 1200
80 mm 120 mm 160 mm 200 mm 250 mm
Lif
t
Force(
N
)
Height (mm)
Total Lift
10 m/s20 m/s
33 m/s
40 m/s
Fig.11. Changes in the torque around the automobile center of gravity