DEMOGRAPHIC RESEARCH
VOLUME 29, ARTICLE 17, PAGES 441-472
PUBLISHED 10 SEPTEMBER 2013
http://www.demographic-research.org/Volumes/Vol29/17/ DOI: 10.4054/DemRes.2013.29.17
Research Article
An examination of black/white differences
in the rate of age-related mortality increase
Andrew Fenelon
© 2013 Andrew Fenelon.
This open-access work is published under the terms of the Creative Commons Attribution NonCommercial License 2.0 Germany, which permits use, reproduction & distribution in any medium for non-commercial purposes, provided the original author(s) and source are given credit.
1 Introduction 442
2 Background 443
3 Data and methods 447
3.1 Data 447
3.2 Causes of death 447
3.3 Methods 448
3.4 Rate of mortality increase and the black/white crossover 450
4 Results 451
4.1 Rate of mortality increase and the black-white crossover 455
5 Discussion 458
6 Conclusion 461
7 Acknowledgement 462
References 463
An examination of black/white differences in the rate of age-related
mortality increase
Andrew Fenelon1
BACKGROUND
The rate of mortality increase with age among adults is typically used as a measure of the rate of functional decline associated with aging or senescence. While black and white populations differ in the level of mortality, mortality also rises less rapidly with age for blacks than for whites, leading to the well-known black/white mortality “crossover”.
OBJECTIVE
This paper investigates black/white differences in the rate of mortality increase with age for major causes of death in order to examine the factors responsible for the black/white crossover.
METHODS
The analysis considers two explanations for the crossover: selective survival and age misreporting. Mortality is modeled using a Gompertz model for 11 causes of death from ages 50-84 among blacks and whites by sex.
RESULTS
Mortality increases more rapidly with age for whites than for blacks for nearly all causes of death considered. The all-cause mortality rate of mortality increase is nearly two percentage points higher for whites. The analysis finds evidence for both selective survival and age misreporting, although age misreporting is a more prominent explanation among women.
CONCLUSIONS
The black/white mortality crossover reflects large differences in the rate of age-related mortality increase. Instead of reflecting the impact of specific causes of death, this pattern exists across many disparate disease conditions, indicating the need for a broad explanation.
1. Introduction
Human mortality rates begin to increase with advancing age starting around age 20 in most populations. Especially at older ages, age-related increases in the observed mortality rate are thought to reflect functional decline and processes associated with physiological aging. Gompertz (1825) originally noted that adult mortality increases exponentially as a function of age with remarkable consistency. That is, age-specific death rates increase at a nearly constant exponential rate for each year of age. Gompertz’ model has enjoyed success as the most heavily used model of adult mortality, and remains a quintessential tool for demographers and gerontologists. Among the many attractive characteristics of the Gompertz model is an estimate of the percentage increase in mortality for each additional year of age, the Rate of Mortality Increase (RMI). Although this measure is assumed to be a species-typical indicator of physiological aging, human population subgroups exhibit significant differences in the rate of mortality increase (Horiuchi et al. 2003). Group differences in the rate of age-related mortality increase may reflect differences in accumulated risk over the life course or in the timing of the onset of specific diseases (Carey and Liedo 1995; Horiuchi and Wilmoth 1997; Luder 1993). In examining life course trajectories of mortality, comparing group differences in the rate of increase with age can supplement our understanding of differences in the level of mortality. One important comparison is blacks and whites in the United States. Although the vast majority of research on this topic focuses on black/white differences in the level of mortality, blacks and whites also differ in the slope of age-related increase (Elo and Drevenstedt 2004; Geronimus et al. 1996; Hayward et al. 2000). This leads to categorically distinct trajectories of mortality in the adult age range.
statistical artifact, reflecting inaccurate mortality data at the oldest ages (Rosenwaike and Hill 1996).
In recent years, the widespread availability of reliable cause of death data in developed countries has greatly facilitated analysis of respective components of the mortality schedule. Cause of death analysis, the disaggregation of mortality and aging processes into specific ailments has been integral to demographic and gerontological studies of aging (Elo and Drevenstedt 2004; Finch 2009). Early research by Preston (1976) examined national differences in mortality by cause of death, which informed subsequent approaches to understanding the how components of the age pattern of mortality vary across populations (Himes 1994). Examining cause-specific mortality within rather than between populations helps to illuminate how specific diseases contribute to age-related functional decline or senescence (Carnes et al. 2006). Mortality from some causes of death rises rapidly at older ages. For instance, mortality from cardiovascular diseases is low in early adulthood and increases precipitously with age (Horiuchi et al. 2003). As a result, ischemic heart disease and stroke come to dominate mortality after age 65 (National Center for Health Statistics 2012).
The goal of this paper is to examine differences in the rate of mortality increase between non-Hispanic whites and non-Hispanic blacks in the United States. Given the large amount of literature focused on explaining the unexpected black/white mortality crossover, an understanding of how actuarial aging varies among these groups will inform future analyses of black/white disparities in old-age mortality. The analysis exploits variation among individual causes of death in order to examine several possible sources of the observed black-white difference in the rate of actuarial aging.
2. Background
of death will lead to only small reductions in mortality unless the underlying “top” components of the mortality schedule are substantially altered (Carnes and Olshansky 1993). Individual deaths that are prevented from specific causes of death may be filtered down to other diseases, reflecting the broad and multidimensional senescence of the body.
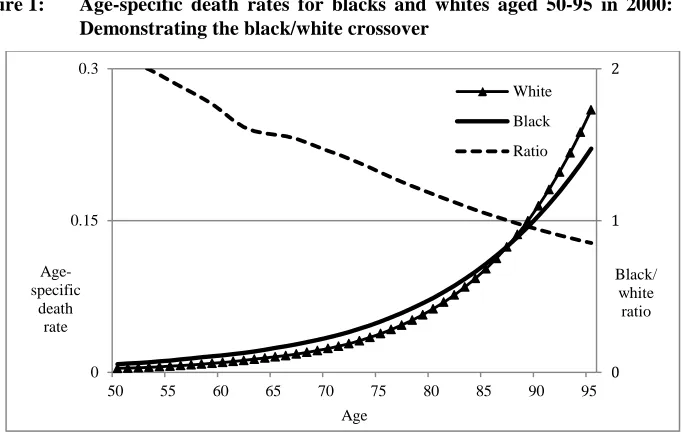
Blacks in the United States exhibit higher mortality levels than whites throughout the life course and into old age until around age 85, at which point the observed mortality rates of whites begin to exceed those of blacks (see Figure 1). Although the black/white mortality crossover has been documented using multiple sources of data and a variety of different study populations, it remains controversial (Dupre et al. 2006; Lynch et al. 2003; Masters 2012; Wing et al. 1985). It is possible that the crossover reflects differential survival to older ages of blacks and whites (Manton and Stallard 1981). Since the overall burden of mortality is higher for the black population at younger ages, the remaining survivors at older ages may be an increasingly robust subset of the population (Wing et al. 1985). The mathematical dynamics of mortality selection derive from studies assuming heterogeneity of frailty in the population (Vaupel and Yashin 1985). As cohorts age, they experience differential mortality, with the frailest members of the population dying first. The remaining members of the cohort represent a more robust subset of the original cohort, and may thus experience lower-than-expected levels of mortality (Vaupel et al. 1979). Supporters of the selective survival hypothesis claim that elevated mortality risks among blacks at younger ages single out the frailest members of the cohort, leaving a relatively healthy remaining group of individuals that experiences lower mortality risk in old age. Evidence for mortality selection comes from cohort studies documenting that death rates among whites begin to exceed those of blacks at the oldest ages (Berkman et al. 1989; Corti et al. 1999; Manton et al. 1991). Although there is very little direct evidence for the contribution of selective mortality, similar methods have been used to detect the expected consequences of differential mortality selection (Horiuchi and Wilmoth 1998; Manton and Stallard 1981).
al. 1996). As a result, there is more noise in mortality estimates among blacks at older ages and black mortality may be biased downwards relative to whites (Hussey and Elo 1997). However, instead of reducing data quality to a level that precludes interpretation of observed mortality, previous research suggests that age misreporting leads to mortality biases with recognizable patterns (Preston et al. 1999). Some of these patterns may be indirectly observed by examining the black/white difference in the rate of mortality increase.
Figure 1: Age-specific death rates for blacks and whites aged 50-95 in 2000: Demonstrating the black/white crossover
Source: National Center for Health Statistics U.S. life tables 2000.
Notes: Age-specific death rates denote risk of death per person-year of exposure. Death rates for blacks exceed those for whites throughout the life course until age 87. The black/white mortality ratio exhibits relatively consistent monotonic decline across the adult age spectrum.
This paper pursues two goals with respect to the black/white difference in the rate of mortality increase with age – a lower mortality slope among blacks than among whites. The analysis refers to this slope as the Rate of Mortality Increase (RMI), interpreted as the proportional increase in the annualized death rate per year of age (Horiuchi et al. 2003). The first goal is to determine to what extent the pattern of black/white differences in cause-of-death-specific RMI reflects the two primary hypotheses explaining the black/white mortality crossover. The selective survival
0 1 2
0 0.15 0.3
50 55 60 65 70 75 80 85 90 95
Black/ white ratio Age-
specific death
rate
Age
hypothesis suggests that RMI for blacks should be reduced relative to whites as the black population is increasingly composed of more robust individuals. Stronger mortality selection at younger ages for specific causes of death should be reflected in lower RMI for those causes of death. Thus, causes of death with larger relative black/white mortality gaps will be expected to exhibit larger gaps in the force of mortality selection, and thus in RMI. Selective survival suggests that there should be a positive association, across causes of death, between the black/white disparity in mortality at younger ages and the black/white disparity in RMI.
The age misreporting hypothesis instead argues that inaccurate ascertainment of age among older African-Americans leads to a downward bias in observed death rates. Preston and colleagues (1999) demonstrate that all forms of age misreporting (understatement, overstatement, both) lead to lower observed death rates than exist in unbiased data. However, this bias increases rapidly at the oldest ages and is relatively minor at younger adult ages. As a result, causes of death that tend to rise more rapidly with age (higher RMI) will endure larger effects. Age misreporting suggests that there should be a positive association, across causes of death between RMI level among white and the overall black/white difference in RMI. Similar methods have been used to obtain indirect evidence for age misreporting (Horiuchi and Coale 1990). These studies compare the expected unbiased age-pattern of mortality to mortality schedules of populations in which age misreporting is more prevalent. The black/white comparison is an appropriate example of this phenomenon (Preston et al. 1996). These two hypotheses will be examined using data on the 11 leading causes of intrinsic mortality among individuals over age 50.
3. Data and methods
3.1 Data
Data come from U.S. vital statistics from the year 2000. Death totals come from the Multiple Cause of Death (MCD) public-use files maintained by the National Center for Health Statistics. Deaths were aggregated by race, sex, age, and cause of death. Age-specific death rates were calculated using population figures from the 2000 US census (US Census Bureau 2003). Black and white populations include only individuals identifying as one race, black or white alone. Individuals of Hispanic origin (either black or white) are excluded from the analysis. In order to avoid small cell sizes for certain causes of death, death rates are aggregated to five-year age groups between 50-54 and 80-84. Although mortality data are available for more recent years, it is not clear that population estimates in non-censal years are sufficiently reliable for the analysis.
3.2 Causes of death
of obesity. (7) Colorectal cancer is a major cause of cancer death among both men and women. (8) Reproductive cancers include testicular and prostate cancer among men and ovarian, uteri, and cervical cancer among women. (9) Influenza and pneumonia represent the largest cause of infectious/parasitic disease death. (10) All other types of cancer are included in a residual “other cancer” category. This primarily includes cancers of the pancreas, stomach, and skin. (11) All other diseases of the heart, including rheumatic heart disease and hypertensive heart disease make up the “other heart diseases” category. The residual category, which comprises all causes of death not included in the 11 categories above, makes up slightly less than 20-25% of all deaths between ages 50 and 84. This category includes, among others, infectious diseases other than influenza, chronic liver disease, and external causes of death. To ensure that the results are not driven by the choice of causes of death, I perform the analysis by including the 35 largest causes of death in this age group (including external causes). The results are shown in Appendix Table A2.
3.3 Methods
It is necessary to specify mathematically what is meant by the rate of mortality increase with age. When mortality is modeled using a Gompertz function the force of mortality 𝜇(𝑥) is given by
𝜇(𝑥) = 𝛼 𝑒𝛽𝑥
with level and shape parameters 𝛼 and 𝛽, respectively. Since we are interested in the proportional change in the force of mortality, we take the derivative of 𝜇(𝑥) divided by 𝜇(𝑥)
𝑅𝑀𝐼 =𝜇(𝑥) 𝑑𝑥𝑑 𝜇(𝑥) = 𝛼 𝛽𝑒𝛼 𝑒𝛽𝑥𝛽𝑥= 𝛽.
fits for the model (Horiuchi et al. 2003). The model is applied to all-cause mortality as well as each cause of death. The model has the form
ln� 𝑀5 𝑥𝑖� = 𝛼𝑖+ 𝛽𝑖(𝑥)
where 5 𝑥𝑀𝑖 is the death rate from cause 𝑖 between ages x and x+5, and 𝛼𝑖 and 𝛽𝑖 are parameters estimated by least squares. 𝛽𝑖 is the RMI for cause of death 𝑖. Because all causes of death sum to all-cause mortality, it is possible to express all-cause RMI as the sum of cause-specific RMIs (𝛽𝑖) weighted by the proportionate cause of death distribution as
𝑅𝑀𝐼 ≅ � 𝛽𝑖∙ Πi 𝑛
𝑖=1
where 𝛽𝑖 is the RMI for the total population (or population subgroup) and Πi is the proportion of deaths due to cause 𝑖 in the age-range 50-84 (see Appendix for more detailed derivation). The equation is an approximation due to slight cause-specific deviations from the Gompertz model, but in practice this equation gives a very similar RMI to that estimated separately by Equation 1. Kitagawa (1955) developed a method for decomposing the difference between two demographic rates which is applicable to measures that are made up of additive components, such as the mortality component and age-structural component of the crude death rate. Using this framework, the black-white difference in RMI can be decomposed into analogous components
𝑅𝑀𝐼
𝑊 − 𝑅𝑀𝐼𝐵 = �� 𝛽𝑊 𝑖− 𝛽𝐵 𝑖� ∙ �𝐵 iΠ + Π𝑊 i
2 � +
𝑛
𝑖=1
�� Π𝐵 i− Π𝑊 i� ∙ �𝐵 𝑖𝛽 + 𝛽𝑊 𝑖
2 �
𝑛
𝑖=1
Figure 2: Age-specific death rates for U.S. women: 2000
Source: Human Mortality Database (2008).
3.4 Rate of mortality increase and the black/white crossover
The black/white mortality crossover reflects differential rates of aging between blacks and whites over the adult age range, a function of the black/white difference in RMI. Finding evidence for selective survival and age misreporting depends on indirect detection of the impact of each process on the observed age pattern of mortality. Support for selective survival relies on the expectation that causes of death with higher death rates will produce greater mortality selection and lead to more rapid removal of more frail individuals (Manton et al. 1986). To the extent that the selective survival hypothesis is true, RMI for blacks should be lower for causes of death with heavy mortality selection at younger ages (Horiuchi and Wilmoth 1998). Diseases that show a larger black disadvantage at younger ages will also be expected to rise more slowly with age for blacks. Thus, the size of the black/white difference in RMI should be positively associated with the size of the black/white difference in the level of mortality.
0.0001 0.001 0.01 0.1 1
20 25 30 35 40 45 50 55 60 65 70 75 80 85 90 95 100 μ(x)
Age
Alternatively, indirect evidence for age misreporting relies on detectable signs of deviation in the age pattern of mortality (Horiuchi and Coale 1990). The hypothesis suggests that inaccurate ascertainment of ages biases death rates downwards among older blacks, more so than among whites (Preston et al. 2003). The extent of this bias also rises with age, leading to a greater impact of age misreporting at the very oldest ages (Coale and Kisker 1986). As long as the likelihood of misreporting ages does not vary significantly by cause of death, the relative impact of misreporting on the black/white RMI difference will be larger for causes of death that rise rapidly with age (Preston et al. 1999). That is, the downward RMI bias due to age misreporting will be more severe for causes of death that have a high RMI to begin with. Thus, to the extent that age misreporting can help to explain the crossover, there should be a positive association between the RMI level and the size of the black-white difference in RMI across the 11 causes of death considered.
4. Results
Table 1: Cause of death distributions by sex and race: 2000
Percentage of deaths between ages 50 and 84
Men Women
Black1 White1 Black White
(1) Ischemic Heart Disease 20.9% 24.4% 20.5% 18.9%
(2) Lung Cancer 9.7% 10.2% 5.9% 8.5%
(3) Stroke 6.4% 5.3% 7.9% 7.3%
(4) Chronic Lower Respiratory Disease 3.5% 6.3% 2.9% 7.2%
(5) Breast Cancer -- -- 4.2% 4.4%
(6) Diabetes Mellitus 4.1% 3.0% 6.5% 3.5%
(7) Colorectal Cancer 2.9% 2.9% 3.1% 2.9%
(8) Reproductive Cancers 4.6% 2.6% 2.7% 2.7%
(9) Influenza and Pneumonia 2.0% 2.0% 1.8% 2.2%
(10) Other Cancers 12.0% 13.8% 9.9% 11.3%
(11) Other heart diseases 8.8% 6.7% 9.9% 7.5%
All residual causes 24.9% 22.7% 25.9% 23.7%
All Causes 100% 100% 100% 100%
Total Deaths 90,405 681,246 83,221 590,326
Source: Author’s calculations from Multiple Cause of Death Public-Use fileavailable from theNational Center for Health Statistics, 2000.
1
Refers to non-Hispanic blacks and whites.
Black women’s mortality is 3.5 deaths higher per 1,000. The crossover results from a less rapid increase among blacks across the entire adult age range.
Figure 3: Age-specific death rates for U.S. black and white women ages 50-84: 2000
Notes: Age-specific death rates for 5-year age groups used to estimate RMI. Death rates are graphed on a logarithmic scale to demonstrate near linear mortality increase. Death rates for blacks and whites converge at older ages. The pattern is very similar for men.
Source: Author’s calculations from Multiple Cause-of-Death public-use files available from the National Center for Health Statistics.
Table 2 shows RMI by race, sex, and cause of death. All-cause RMI is significantly higher for whites than for blacks. There is substantial variability in RMI by cause of death. The highest RMIs are seen for influenza and pneumonia, stroke, chronic lower respiratory diseases, and reproductive cancers (among men). The lowest RMIs occur for cancers, primarily lung cancer for men (RMI = 6 - 8%), and breast and reproductive cancers for women (3 - 5%). For all groups, there is also a notable opposition in RMI between cancers and cardiovascular diseases. Cancer mortality appears to increase at a rate below the all-cause average, while other causes of death, particularly ischemic heart disease and stroke (RMI > 12% among whites), increase faster than the average. It is important to emphasize that RMI for whites exceeds that for blacks for each cause of death considered here except reproductive cancers among women. There is some variation in the size of the black-white difference by cause of death, but the pattern is tremendously consistent. The largest differences occur for
0.001 0.01 0.1
50-54 55-59 60-64 65-69 70-74 75-79 80-84
Age-Specific Death
Rate (log scale)
Age
stroke, chronic lower respiratory disease, and other heart diseases, each with greater than three percentage-point gaps.
Table 2: Cause-specific RMI by sex for blacks and whites: 2000
Yearly rate of increase between ages 50 and 84
Men Women
Black White Black White
All Causes 7.3% 9.3% 7.9% 9.8%
(1) Ischemic Heart Disease 7.9% 9.3% 9.6% 12.0%
(2) Lung Cancer 6.2% 7.8% 5.4% 6.7%
(3) Stroke 8.7% 12.3% 9.4% 12.6%
(4) Chronic Lower Respiratory Disease 10.5% 13.2% 8.0% 11.7%
(5) Breast Cancer -- -- 2.8% 4.2%
(6) Diabetes Mellitus 7.2% 8.5% 8.0% 8.8%
(7) Colorectal Cancer 7.5% 8.4% 7.4% 8.4%
(8) Reproductive Cancers 15.2% 15.9% 5.5% 5.2%
(9) Influenza and Pneumonia 9.9% 13.0% 10.6% 12.8%
(10) Other Cancers 5.8% 7.4% 6.9% 7.7%
(11) Other heart diseases 6.6% 9.6% 8.0% 11.2%
All residual causes 5.4% 7.5% 7.0% 8.8%
Black/white difference 1.96% 1.96%
Note: Denotes the percentage increase in the death rate from specified causes for each additional year of age between ages 50 and 84. Estimated using the regression model in Equation 1.
Source: Author's Calculations from Multiple Cause of Death files, 2000
chronic respiratory diseases. Despite this, the overwhelming driver of the black/white RMI gap is consistently lower RMI among blacks for each cause of death.
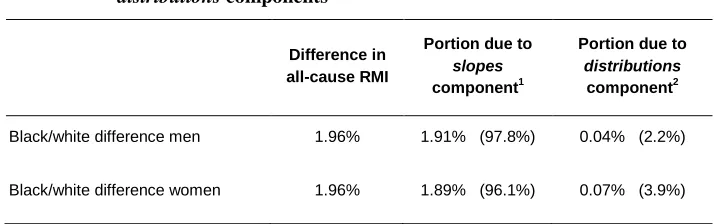
Table 3: Decomposition of black-white difference in RMI into slopes and
distributions components
Difference in all-cause RMI
Portion due to slopes
component1
Portion due to distributions
component2
Black/white difference men 1.96% 1.91% (97.8%) 0.04% (2.2%)
Black/white difference women 1.96% 1.89% (96.1%) 0.07% (3.9%)
Notes: Decomposition component values are calculated using Equation 2. Percent contributions are shown in parentheses. 1
Portion of the all-cause difference attributable to black/white difference in RMI (slopes) for each cause of death. 2
Portion of the all-cause difference attributable to black/white differences in cause-of-death distribution of mortality.
4.1 Rate of mortality increase and the black-white crossover
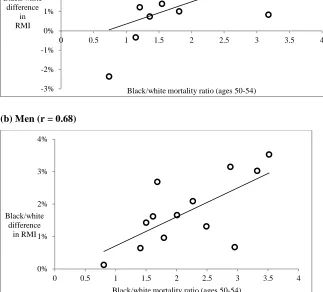
Figure 4: The role of selective survival: Relationship between black-white mortality ratio at age 50 and black/white difference in RMI for each cause of death
(a) Women (r = 0.60)
(b) Men (r = 0.68)
Notes: RMI difference calculated as RMI(whites) – RMI(blacks). Mortality ratio is the age-specific death rate for blacks divided by corresponding rate for whites in the age group 50-54. Each point represents one cause of death.
Source: Author’s calculations from the 2000 Multiple Cause-of-Death public use files available from the National Center for Health Statistics.
-3% -2% -1% 0% 1% 2% 3% 4% 5%
0 0.5 1 1.5 2 2.5 3 3.5 4
Black/white difference
in RMI
Black/white mortality ratio (ages 50-54)
0% 1% 2% 3% 4%
0 0.5 1 1.5 2 2.5 3 3.5 4
Black/white difference
in RMI
There is also some evidence of inaccurate measurement of age as an explanation of the black/white crossover. Because age-misreporting would be expected to have a greater impact on causes of death that dominate at later ages, there should be a relationship between RMI level and the size of the black/white difference in RMI. This relationship is shown in Figure 5 for women (panel a) and men (panel b). There is a strong correlation among women (r = 0.79), but a relatively weak one among men (r = 0.20). This finding suggests that age misreporting may be an important contributor to the black/white crossover, but that its impact is larger for women than for men. This is consistent with previous research indicating that age misreporting is more prevalent among older African-American women (Elo and Preston 1994; Preston et al. 2003).
Figure 5: The role of age misreporting: Relationship between RMI level and black-white difference in RMI for each cause of death
(a) Women (r = 0.79)
-1% 0% 1% 2% 3% 4%
0 0.02 0.04 0.06 0.08 0.1 0.12 0.14
Black/white Difference
in RMI
Figure 5: (Continued)
(b) Men (r = 0.20)
Notes: RMI difference calculated as RMI(whites) – RMI(blacks). RMI level refers to estimated RMI for whites from Equation 1. Each point represents one cause of death
Source: Author’s calculations from the 2000 Multiple Cause-of-Death public use files available from the National Center for Health Statistics.
5. Discussion
This study examined differences between blacks and whites in the rate mortality increase with age. Previous research on the black/white mortality crossover has consistently found a lower Gompertz “slope” among blacks than among whites, and it is clear that this slope difference contributes to the crossover at the oldest ages. Although it is evident that aging-related mortality patterns among blacks were different from those of whites, previous studies provided no explanatory framework for understanding these distinctions. The current analysis employed a Gompertz model of age-related mortality increase and detailed cause of death data in order to examine the two most prominent explanations for the black/white mortality crossover: selective survival and age misreporting. The analysis finds evidence that both processes contribute to the black/white difference in the rate of age-related mortality increase, although age misreporting appears to be more important for the comparison of black
0% 1% 2% 3% 4%
0 0.05 0.1 0.15 0.2
Black/white Difference
in RMI
and white women. The analysis also finds that lower RMI among blacks is seen across each cause of death, a finding that suggests a “top down” approach to aging-related mortality may be more appropriate.
Both selective survival and age misreporting have the potential to reduce RMI for the black population relative to the white population and thus may explain why mortality for white begins to exceed that of blacks at the oldest ages. Selective survival or heterogeneity explanations form the theoretical basis of many empirical analyses of aging-related mortality phenomena, including the deceleration and “flattening” of the mortality curve at very old ages (Vaupel and Yashin 1985; Vaupel 1997). As the more frail members of the population die at younger ages, the population is increasingly composed of robust individuals with lower underlying mortality risks. In this way, the observed mortality curve begins to diverge from the aging experiences of individuals within the population. According to selective survival explanations, the slope of the Gompertz mortality curve for the black population is reduced relative to the slope of the curve for individual risk (Strehler and Mildvan 1960). The impact of population heterogeneity on observed mortality is difficult to observe directly (Vaupel and Yashin 1985), but the current study finds indirect evidence for mortality selection. Cause of death categories with large black/white disparities in the level of mortality at younger ages, such as ischemic heart disease and stroke, are also often the causes of death that exhibit the largest black/white differences in the slope. This may indicate that higher-risk blacks die more often at younger ages, while the remaining cohort members at older ages are relatively healthy.
There is also evidence that greater rates of age misreporting among older African-Americans, particularly women, contribute to the black/white difference in the rate of mortality increase and thus the crossover. Among women, there is a strong correlation between cause-specific RMI level and the size black/white difference in cause-specific RMI. This may reflect the fact that age misreporting has a more pronounced effect on causes of death that rise rapidly with age, all else being equal. Among men, the relationship is much weaker, which is consistent with evidence that age misreporting among older African-Americans is more common among women (Elo and Preston 1994).
This paper also provides evidence that a “top down” approach to understanding aging-related mortality may be the appropriate perspective. The analysis used classical decomposition methods to determine that the black/white difference in RMI results from consistent RMI differences across all causes of death. That is, blacks experience lower rate of mortality increase for nearly all causes of death. Despite large differences in the level of mortality (Elo and Drevenstedt 2004), the proportionate cause of death distribution of mortality is quite similar for blacks and whites. This suggests that the underlying factors responsible for the less rapid age-related mortality increase among blacks operate across causes of death. This finding is significant on two levels. First, it provides a deeper understanding of black/white differences in adult mortality, particularly in the age-pattern of mortality among older adults, which has implications for the black/white mortality crossover. Black and white populations in the United States differ not only in the level of mortality but also in the pattern of aging. Second, it furthers our conceptual approach to studying aging-related mortality processes by cause of death. A top down approach, in which the level of all-cause mortality has a privileged position and individual causes of death are seen as outcomes of this level, may be more appropriate for analysis of cause-specific mortality (Gavrilov and Gavrilova 1991; Himes 1994). Aging-related mortality should thus be understood as reflecting the simultaneous senescence of multiple biological systems, a process that increases risk of death from many varied degenerative conditions (Bains 2000; Gavrilov and Gavrilova 2001; Laird and Sherratt 2009). Future analyses of aging-related mortality increase should not treat mortality from individual causes as independent. Explaining blacks’ and whites’ distinct patterns of aging requires a more comprehensive explanation that covers the experience of the majority of causes of death.
RMI, since estimates for both blacks and whites would similarly be affected by period-cohort inconsistencies. Finally, this study used the age range 50-84, which may ignore important aging-related processes at younger or older ages.
Other studies have modeled mortality using a Gompertz function from ages 40-90 and have found similar levels of fit (Beltrán-Sánchez et al. 2012; Yashin et al. 2002). An expansion of the age range considered does not change the substantive interpretation of the results, although there are small deviations in the contributions of specific causes of death. This consistency suggests that black/white differences in aging-related mortality characterize a much broader age range than that considered here.
The remaining limitation concerns issues of comparability of cause of death information among blacks and whites. The analysis assumes that cause of death coding is similarly complete and accurate among both blacks and whites in the United States. Although the completeness of vital registration in the U.S. is relatively strong, there is some evidence that cause of death coding occurs differently for blacks and whites, particularly for external causes of death (Noymer, Penner, and Saperstein 2011). This may be especially true at the oldest ages, where the range of conditions to which individuals are exposed is significantly larger than at younger adult ages (Manton 1980). This limitation suggests that findings should be replicated using multiple data sources that ascertain cause of death information in various ways (e.g. Corti et al. 1999).
6. Conclusion
many disparate disease categories. Indeed, this pattern appears be driven by both selective survival as well as by differential age misreporting.
Although this paper supports both selective survival and age misreporting as contributors to the black/white crossover, we are left without an understanding of the proximate reasons why mortality increases more rapidly with age for whites than for blacks. One possibility concerns the relationship between the age-pattern of mortality decline over time and the rate of mortality increase with age (Hawkes et al. 2012). As the level of mortality falls, death rates are reduced first at younger ages, which provide large payoffs in terms of life expectancy gains. Once the “low-hanging fruit” of mortality decline has been exploited, future declines must come at older ages, which have smaller marginal effects on life expectancy (Keyfitz 1968; Vaupel 1986). Mortality at older ages is characterized by a greater variety of risks as functional decline occurs in individuals on many dimensions (Finch 2009; Vaupel et al. 1998). In this way, mortality at older ages is more intransigent and less responsive to medical treatment (Wilmoth 2000). Mortality after age 50 in the United States first began to fall significantly starting in the 1950s. Declines in rates of cardiovascular death first occurred at the younger adult ages 35-69, while proportional declines were much smaller at older ages (Wilmoth 2000). Because mortality declined to lower levels among whites than blacks, greater RMI among whites may reflect a faster pace of mortality decline at younger adult ages. Recently there has been some progress against mortality at the oldest ages, with evidence that death rates are declining even at the oldest ages, previously thought to be beyond the realm of medical intervention (Wilmoth 1995). As medical technology begins to make headway against diseases at very old ages (e.g. cancers, dementias), the rate of aging may decline for both blacks and whites (Goldstein and Cassidy 2012). Like the results of this paper, this explanation is also consistent with a top down approach to aging-related mortality. Future research on the mortality crossover should examine the specific diseases that exhibit large black/white differences in the rate of mortality increase with age, bearing in mind that aging-related mortality involves more than simply the sum of individual causes of death.
7. Acknowledgements
References
Bains, W. (2000). Statistical mechanic prediction of non-Gomperzian ageing in extremely aged populations. Mechanisms of Ageing and Development 112(2): 89–97. doi:10.1016/S0047-6374(99)00049-4.
Beltrán-Sánchez, H., Crimmins, E.M., and Finch, C.E. (2012). Early cohort mortality predicts the rate of aging in the cohort: A historical analysis. Journal of Developmental Origins of Health and Disease 3(05): 380–386.
doi:10.1017/S2040174412000281.
Berkman, L., Singer, B., and Manton, K. (1989). Black/white differences in health status and mortality among the elderly. Demography 26(4): 661–678.
doi:10.2307/2061264.
Carey, J.R. and Liedo, P. (1995). Sex-specific life table aging rates in large medfly cohorts. Experimental Gerontology 30(3–4): 315–325. doi:10.1016/
0531-5565(94)00041-Z.
Carnes, B.A., Holden, L.R., Olshansky, S.J., Witten, M.T., and Siegel, J.S. (2006). Mortality partitions and their relevance to research on senescence. Biogerontology 7(4): 183–198. doi:10.1007/s10522-006-9020-3.
Carnes, B.A. and Olshansky, S.J. (1993). Evolutionary perspectives on human senescence. Population and Development Review 19(4): 793–806. doi:10.2307/ 2938414.
Carnes, B.A. and Olshansky, S.J. (1997). A biologically motivated partitioning of mortality. Experimental Gerontology 32(6): 615–631. doi:10.1016/
S0531-5565(97)00056-9.
Coale, A.J. and Kisker, E.E. (1986). Mortality crossovers: Reality or bad data? Population Studies 40(3): 389–401. doi:10.1080/0032472031000142316.
Corti, M.C., Guralnik, J.M., Ferrucci, L., Izmirlian, G., Leveille, S.G., Pahor, M., Cohen, H.C., Pieper, C., Havlik, R.J. (1999). Evidence for a black-white crossover in all-cause and coronary heart disease mortality in an older population: The North Carolina EPESE. American Journal of Public Health 89(3): 308–314. doi:10.2105/AJPH.89.3.308.
Elo, I.T. and Drevenstedt, G.L. (2004). Cause-specific contributions to black-white differences in male mortality from 1960 to 1995. Demographic Research, Special Collection 2(10): 255-276. doi:10.4054/DemRes.2004.S2.10.
Elo, I.T. and Preston, S.H. (1994). Estimating African-American mortality from inaccurate data. Demography 31(3): 427–458. doi:10.2307/2061751.
Finch, C.E. (2009). Evolution of the human lifespan and diseases of aging: Roles of infection, inflammation, and nutrition. Proceedings of the National Academy of Sciences 107(suppl_1): 1718–1724.
Gavrilov, L.A. and Gavrilova, N.S. (1991). The biology of life span: A quantitative approach. Harwood Academic Publishers.
Gavrilov, L.A. and Gavrilova, N.S. (2001). The reliability theory of aging and longevity. Journal of theoretical Biology 213(4): 527–545. doi:10.1006/jtbi.20 01.2430.
Geronimus, A.T., Bound, J., Waidmann, T.A., Hillemeier, M.M., and Burns, P.B. (1996). Excess mortality among blacks and whites in the United States. New England Journal of Medicine 335(21): 1552–1558. doi:10.1056/NEJM1996
11213352102.
Goldstein, J.R. and Cassidy, T. (2012). How slowing senescence translates into longer life expectancy. Population Studies 66(1): 29–37. doi:10.1080/003247
28.2011.635215.
Gompertz, B. (1825). On the nature of the function expressive of the law of human mortality, and on a new mode of determining the value of life contingencies. Philosophical Transactions of the Royal Society of London 115: 513–583.
doi:10.1098/rstl.1825.0026.
Gurven, M. and Fenelon, A. (2009). Has actuarial aging ‘slowed’ over the past 250 years? A comparison of small-scale subsistence populations and European cohorts. Evolution 63(4): 1017–1035. doi:10.1111/j.1558-5646.2008.00592.x.
Hawkes, K., Smith, K.R., and Blevins, J.K. (2012). Human actuarial aging increases faster when background death rates are lower: A consequences of differential heterogeneity? Evolution 66(1): 103–114. doi:10.1111/j.1558-5646.2011.01 414.x.
Himes, C. (1994). Age patterns of mortality and cause-of-death structures in Sweden, Japan, and the United States. Demography 31(4): 633–650. doi:10.2307/
2061796.
Horiuchi, S. and Coale, A.J. (1990). Age patterns of mortality for older women: An analysis using the age-specific rate of mortality change with age. Mathematical Population Studies 2(4): 245–267. doi:10.1080/08898489009525312.
Horiuchi, S., Finch, C.E., Meslé, F., and Vallin, J. (2003). Differential patterns of age-related mortality increase in middle age and old age. The Journals of Gerontology Series A: Biological Sciences and Medical Sciences 58(6): B495– B507. doi:10.1093/gerona/58.6.B495.
Horiuchi, S. and Wilmoth, J.R. (1997). Age patterns of the life table aging rate for major causes of death in Japan, 1951–1990. The Journals of Gerontology Series A: Biological Sciences and Medical Sciences 52(1): B67-B77. doi:10.1093/
gerona/52A.1.B67.
Horiuchi, S. and Wilmoth, J.R. (1998). Deceleration in the age pattern of mortality at older ages. Demography 35(4): 391–412. doi:10.2307/3004009.
Human Mortality Database (2008). University of California, Berkeley (USA), and Max Planck Institute for Demographic Research (Germany). www.mortality.org. Hummer, R.A. (1996). Black-white differences in health and mortality. The
Sociological Quarterly 37(1): 105–125. doi:10.1111/j.1533-8525.1996.tb0 2333.x.
Hussey, J.M. and Elo, I.T. (1997). Cause-specific mortality among older African-Americans: Correlates and consequences of age misreporting. Social Biology 44(3-4): 227–246. doi:10.1080/19485565.1997.9988950.
Keyfitz, N. (1968). Introduction to the mathematics of population. Addison-Wesley Pub. Co.
Laird, R.A. and Sherratt, T.N. (2009). The evolution of senescence through decelerating selection for system reliability. Journal of Evolutionary Biology 22(5): 974–982.
doi:10.1111/j.1420-9101.2009.01709.x.
Luder, H.U. (1993). Onset of human aging estimated from hazard functions associated with various causes of death. Mechanisms of Ageing and Development 67(3): 247–259. doi:10.1016/0047-6374(93)90003-A.
reconsidered. Research on Aging 25(5): 456–483. doi:10.1177/01640275032 54675.
Manton, K.G. (1980). Sex and race specific mortality differentials in multiple cause of death data. The Gerontologist 20(4): 480–493. doi:10.1093/geront/20.4.480.
Manton, K.G., Poss, S.S., and Wing, S. (1979). The black/white mortality crossover: Investigation from the perspective of the components of aging. The Gerontologist 19(3): 291-300. doi:10.1093/geront/19.3.291.
Manton, K.G. and Stallard, E. (1981). Methods for evaluating the heterogeneity of aging processes in human populations using vital statistics data: Explaining the black/white mortality crossover by a model of mortality selection. Human Biology 53(1): 47-67.
Manton, K.G., Stallard, E., and Vaupel, J.W. (1986). Alternative models for the heterogeneity of mortality risks among the aged. Journal of the American Statistical Association 81(395): 635–644. doi:10.1080/01621459.1986.10 478316.
Manton, K.G., Stallard, E., and Wing, S. (1991). Analyses of black and white differentials in the age trajectory of mortality in two closed cohort studies. Statistics in Medicine 10(7): 1043–1059. doi:10.1002/sim.4780100705.
Masters, R.K. (2012). Uncrossing the U.S. black-white mortality crossover: The role of cohort forces in life course mortality risk. Demography 49(3): 773–796.
doi:10.1007/s13524-012-0107-y.
National Center for Health Statistics (2012). Health, United States, 2011. Hyattsville, MD. http://www.cdc.gov/nchs/hus.htm.
Noymer, A., Penner, A.M., and Saperstein, A. (2011). Cause of death affects racial classification on death certificates. PLoS ONE 6(1): e15812.
doi:10.1371/journal.pone.0015812.
Preston, S.H., Elo, I.T., Hill, M.E., and Rosenwaike, I. (2003). The Demography of African Americans 1930-1990. Norwell, MA: Kluwer. doi:10.1007/978-94-017-0325-3.
Preston, S.H., Elo, I.T., and Stewart, Q. (1999). Effects of age misreporting on mortality estimates at older ages. Population Studies 53(2): 165–177.
doi:10.1080/00324720308075.
Preston, S.H., Heuveline, P., and Guillot, M. (2001). Demography: Measuring and modeling population processes. Wiley-Blackwell.
Preston, S.H. (1976). Mortality patterns in national populations. With special reference to recorded causes of death. London, NWI: Academic Press.
Rosenwaike, I. and Hill, M.E. (1996). The accuracy of age reporting among elderly African Americans: Evidence of a birth registration effect. Research on Aging 18(3): 310–324. doi:10.1177/0164027596183003.
Shai, I., Jiang, R., Manson, J.E., Stampfer, M.J., Willett, W.C., Colditz, G.A., and Hu, F.B. (2006). Ethnicity, obesity, and risk of type 2 diabetes in women: A 20-year follow-up study. Diabetes Care 29(7): 1585–1590. doi:10.2337/dc06-0057.
Strehler, B.L. and Mildvan, A.S. (1960). General theory of mortality and aging. Science 132(3418): 14–21. doi:10.1126/science.132.3418.14.
US Census Bureau (2003). Public Use Microdata Sample (PUMS) of the 2000 Census. United States: U.S. Census Bureau.
Vaupel, J. W., Carey, J.R., Christensen, K., Johnson, T.E., Yashin, A.I., Holm, N.V., Iachine, I.A., Kannisto, V., Khazaeli, A.A., Liedo, P., Longo, V.D., Zeng, Y., Manton, K.G., and Curtsinger, J.W. (1998). Biodemographic trajectories of longevity. Science 280(5365): 855–860. doi:10.1126/science.280.5365.855.
Vaupel, J.W. (1986). How change in age-specific mortality affects life expectancy. Population Studies 40(1): 147–157. doi:10.1080/0032472031000141896.
Vaupel, J.W. (1997). Trajectories of mortality at advanced ages. Between Zeus and the salmon: The biodemography of longevity: 17–37.
Vaupel, J.W., Manton, K.G., and Stallard, E. (1979). The impact of heterogeneity in individual frailty on the dynamics of mortality. Demography 16(3): 439–454.
doi:10.2307/2061224.
Vaupel, J.W. and Yashin, A.I. (1985). Heterogeneity’s ruses: Some surprising effects of selection on population dynamics. The American Statistician 39(3): 176–185.
doi:10.2307/2683925.
Wilmoth, J.R. (1995). Are mortality rates falling at extremely high ages? An investigation based on a model proposed by Coale and Kisker. Population studies 49(2): 281–295. doi:10.1080/0032472031000148516.
Wilmoth, J.R. (2000). Demography of longevity: Past, present, and future trends. Experimental Gerontology 35(9-10): 1111–1129.
doi:10.1016/S0531-5565(00)00194-7.
Wing, S., Manton, K.G., Stallard, E., Hames, C.G., and Tryoler, H.A. (1985). The black/white mortality crossover: Investigation in a community-based study. Journal of Gerontology 40(1): 78–84. doi:10.1093/geronj/40.1.78.
Yashin, A.I., Begun, A.S., Boiko, S.I., Ukraintseva, S.V., and Oeppen, J. (2002). New age patterns of survival improvement in Sweden: Do they characterize changes in individual aging? Mechanisms of Ageing and Development 123(6): 637–647.
doi:10.1016/S0047-6374(01)00410-9.
Yashin, A.I., Vaupel, J.W., and Iachine, I.A. (1994). A duality in aging: The equivalence of mortality models based on radically different concepts. Mechanisms of Ageing and Development 74(1–2): 1–14.
Appendix
The force of mortality at a given age, 𝜇(𝑥), can be disaggregated into 𝑛 separate causes of death by
𝜇(𝑥) = 𝜇1(𝑥) + 𝜇2(𝑥) + ⋯ + 𝜇𝑛(𝑥)
where 𝜇𝑖(𝑥) is the force of mortality due to cause 𝑖. Since we are interested in the slope of the above function, we differentiate with respect to age
𝑑
𝑑𝑥𝜇(𝑥) = 𝑑
𝑑𝑥𝜇1(𝑥) + 𝑑
𝑑𝑥𝜇2(𝑥) + ⋯ + 𝑑
𝑑𝑥𝜇𝑛(𝑥).
Dividing through by 𝜇(𝑥) and multiplying each individual 𝑑
𝑑𝑥𝜇𝑖(𝑥) term by 𝜇𝑖(𝑥) 𝜇𝑖(𝑥)
𝑑 𝑑𝑥𝜇(𝑥)
𝜇(𝑥) =
𝑑 𝑑𝑥𝜇1(𝑥)
𝜇1(𝑥) ∙
𝜇1(𝑥)
𝜇(𝑥) +
𝑑 𝑑𝑥𝜇2(𝑥)
𝜇2(𝑥) ∙
𝜇2(𝑥)
𝜇(𝑥) + ⋯ +
𝑑 𝑑𝑥𝜇𝑛(𝑥)
𝜇𝑛(𝑥) ∙
𝜇𝑛(𝑥)
𝜇(𝑥).
Simplifying
𝛽(𝑥) =𝑑𝑥 ln 𝜇𝑑 (𝑥)
=𝑑𝑥𝑑 ln 𝜇1(𝑥) ∙ Π1(𝑥) + 𝑑
𝑑𝑥 ln 𝜇2(𝑥) ∙ Π2(𝑥) + ⋯
+𝑑𝑥𝑑 ln 𝜇𝑛(𝑥) ∙ Πn(𝑥)
where Π𝑖(𝑥) is the proportion of deaths at age 𝑥 due to cause 𝑖 and 𝛽(𝑥) represents the rate of mortality increase (RMI) at age 𝑥 per year of age. Simplifying the above expression yields
The rate of mortality increase at age 𝑥 is equal to the sum of the rate of increase mortality due to respective causes weighted by their proportionate cause contributions to all-cause mortality. As predicted by the Gompertz model, the analysis here assumes that the rate of mortality increase remains constant from age 50 to age 84, so we can express 𝛽(𝑥) as the sum of cause-specific slopes multiplied by the proportionate cause of death distribution
𝛽 ≅ � 𝛽𝑖∙ Πi 𝑛
𝑖=1
This sum allows us to employ classical demographic decompositions methods developed by Kitagawa (1955) to separate differences between the 𝑘 values of two populations into effects of cause-specific slopes and cause of death distribution respectively. To decompose the differences of rates for the black and white populations (𝐵𝛽, 𝛽𝑊 )
𝛽
𝑊 − 𝛽𝐵 = � 𝛽𝑊 𝑖∙ Π𝑊 i− 𝑛
𝑖=1
� 𝛽𝐵 𝑖∙ Π𝐵 i 𝑛
𝑖=1
= �� 𝛽𝑊 𝑖− 𝛽𝐵 𝑖� ∙ �𝑊 iΠ + Π𝐵 i
2 � + �� Π𝑊 i− Π𝐵 i� ∙ � 𝛽
𝑊 𝑖+ 𝛽𝐵 𝑖
2 �
𝑛
𝑖=1 𝑛
𝑖=1
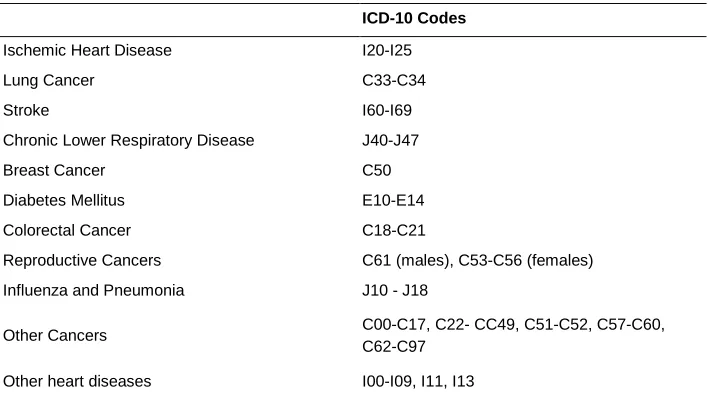
Table A1: International classification of disease 10th revision codes
ICD-10 Codes
Ischemic Heart Disease I20-I25
Lung Cancer C33-C34
Stroke I60-I69
Chronic Lower Respiratory Disease J40-J47
Breast Cancer C50
Diabetes Mellitus E10-E14
Colorectal Cancer C18-C21
Reproductive Cancers C61 (males), C53-C56 (females)
Influenza and Pneumonia J10 - J18
Other Cancers C00-C17, C22- CC49, C51-C52, C57-C60,
C62-C97
Other heart diseases I00-I09, I11, I13
Table A2: Decomposition results using 35 causes of death
Difference in all-cause RMI
Portion due to
Slopes1
Portion due to cause
of death distribution2
Black-white difference men 2.14% 1.89% (88.5%) 0.25% (11.5%)
Black-white difference women 2.04% 1.98% (97.1%) 0.06% (2.9%)
Notes: Decomposition component values are calculated using Equation 2. Percent contributions are shown in parentheses. 1
Portion of the difference attributable to black-white difference in RMI (slopes) for each cause of death. 2