1
Abstract—In this research, the compact-core spun yarns have been produced using RoCoS roller and the effects of filament pre-tension, yarn count and type of sheath fibers were investigated on the physical and mechanical properties of produced yarns such as strength, elongation percentage, hairiness, and abrasion resistance. After statistically analysis on the obtained results, for modeling the core-compact yarn properties, the regression and artificial neural network (ANN) were used to predict the physical and mechanical properties. Trial and error method was considered for determining the best of ANN topology. For this aim, 1110 topologies of ANN (with different hidden layers and neurons in each hidden layer) were investigated for each property. Moreover, to evaluate the accuracy of the created ANN three indexes were used, namely mean absolute percentage error (MAPE), mean square error (MSE), and correlation coefficient (R-value). It was observed that the most accurate results were obtained based on MAPE and the best topology for predicting all properties is a two-hidden layer ANN (maximum MAPE < 0.10) except for the abrasion resistance which is a three-hidden layer ANN (MAPE < 0.17).
Keyword: artificial neural network, compact-core yarn, modeling, physical and mechanical properties, RoCoS roller
I.INTRODUCTION
In the past decades, core-spun spinning has been developed to achieve a better yarn quality and mechanical properties as well as higher production per spinning unit. The special structure of core-spun yarns, in which a filament core is covered by staple fibers, permits to ideally combine the advantages of filaments like high strength with those of the staple fibers like appearance or absorbency properties. Core-spun yarns are used in a wide spectrum of various applications such as military, industrial, technical textiles and sport clothing. Ring and Siro spinning systems are the most conventional systems for production of core-spun yarns. Some researchers [1,2] employed a novel method using ring spinning frame to produce core-spun yarns. Also, a modified ring spinning system has been introduced for producing core-spun yarns [3]. This system utilizes an air jet for better forming of the sheath fiber around the core. Jou and East [4] designed a filament charging device, which was based on the principle of a two–electrode system to separate a multi filament yarn. Embeddable and Locatable spinning (ELS) have
P. Barzoki and M. S. Johari are with the Department of Textile Engineering, Amirkabir University of Technology, Tehran, Iran. M. Vadood is with the Department of Textile Engineering, Yazd University, Yazd, Iran. Correspondence should be addressed to M. Vadood (e-mail:
been introduced in another work [5], in which locating technology is employed to locate filaments and staple fibers so that each staple strand could be reinforced by the filaments, and the staple fiber could be well embedded into the stem of the yarn. Pourahmad and Johari [6] investigated the physical and mechanical properties of Ring, Solo and Siro core–spun yarns at different controllable parameters. Compact spinning is another method for producing core-spun yarns. This system has two different types which are called Elicore and Elicore Twist. Brunk [7] reported that core-spun yarns produced by these systems have better evenness and abrasion resistant in comparison with Ring core-spun yarns.
The artificial neural network (ANN) is one of the intelligent techniques for data processing which has been employed extensively in various textile fields. This technique is useful when there are nonlinear relationships between parameters. There are many published work, in which ANN has been employed to predict the properties of different yarns and fabrics and many other characteristics of textile materials [8-15]. It seems there is a lack of research focused on the predicting properties of core-compact yarns based on the spinning parameters, therefore this paper presents the application of ANN models to predict the properties of core-compact yarns based on the statistically significant controllable factors such as filament pre-tension, yarn count and kind of sheath fibers.
II.NEURAL NETWORK
ANN is a structure inspired from the human brain. ANN is very useful for modeling nonlinear problems and complex functions. ANN consists of three layers including input, hidden, and output layers. Neurons in each layer are connected by associated weights to other neurons in the next layer. The input data is received in input layer and the output is obtained in the output layer by a mathematical function through hidden layers [16]. In ANN there are three operations including training, validation and testing sets. Training is used to train the ANN. Validation is useful when the network begins to overfit the data, and testing group is used to control the error during the training process [17]. In this study for predicting mechanical and physical properties of compact-core yarns, a feed forward multilayer ANN model was used.
III.MATERIALS AND METHODS
In this study, 56 different types of yarn samples were produced on a compact-core spinning system. A blended viscose/polyester and cotton fibers were used as the sheath fiber and multi filament nylon yarn with a count of 100
Modeling the Properties of Core-Compact Spun Yarn Using
Artificial Neural Network
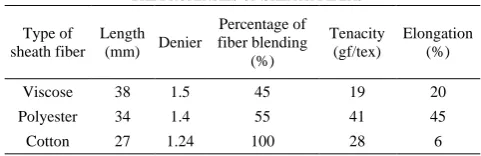
denier was used as the core filament. The sheath fiber properties are shown in Table I.
TABLE I
THE PROPERTIES OF SHEATH FIBERS
Elongation (%) Tenacity
(gf/tex) Percentage of
fiber blending (%) Denier
Length (mm) Type of sheath fiber
20 19
45 1.5
38 Viscose
45 41
55 1.4
34 Polyester
6 28
100 1.24
27 Cotton
The cotton and viscose/polyester roving count were 0.72 and 1.09 Ne, respectively. To produce the compact-core yarns the RoCoS system was installed on SKF lab spinner instead of delivery top roller (Fig. 1), and each roving was fed to the drafting system of the compact-core spinning frame.
Fig. 1. Rotorcraft compact spinning roller (RoCoS).
In order to produce different types of compact-core yarns, the core filament should be pre-drawn before entering the front rollers (RoCoS roller). The filament also should be fed to compactor groove of RoCoS roller. For this aim, guide rod and pre tensioner were used. Fig. 2. shows the process of core-compact yarn production and Table II shows the machine settings for producing compact-core spun yarns.
TABLE II MACHINE SETTINGS
Fig. 2. Production of core-compact yarns.
In this study, the tenacity, elongation percentage, hairiness and abrasion resistance were considered as the physical and mechanical properties of compact-core yarns
Setting parameters Value
Twist per meter 900
Spindel speed (rpm) 22000
Ring diameter (mm) 36
TABLE III
LIST OF YARN SAMPLES AND CONTROLLABLE FACTORS
No. Filament pre-tension Yarn count Type of fiber No. Filament pre-tension Yarn count Type of fiber
1 25 41.5 Viscose/polyester 29 25 48 Viscose/polyester
2 50 41.5 Viscose/polyester 30 50 48 Viscose/polyester
3 75 41.5 Viscose/polyester 31 75 48 Viscose/polyester
4 100 41.5 Viscose/polyester 32 100 48 Viscose/polyester
5 125 41.5 Viscose/polyester 33 125 48 Viscose/polyester
6 160 41.5 Viscose/polyester 34 160 48 Viscose/polyester
7 180 41.5 Viscose/polyester 35 180 48 Viscose/polyester
8 25 41.5 Cotton 36 25 48 Cotton
9 50 41.5 Cotton 37 50 48 Cotton
10 75 41.5 Cotton 38 75 48 Cotton
11 100 41.5 Cotton 39 100 48 Cotton
12 125 41.5 Cotton 40 125 48 Cotton
13 160 41.5 Cotton 41 160 48 Cotton
14 180 41.5 Cotton 42 180 48 Cotton
15 25 43.5 Viscose/polyester 43 25 59 Viscose/polyester
16 50 43.5 Viscose/polyester 44 50 59 Viscose/polyester
17 75 43.5 Viscose/polyester 45 75 59 Viscose/polyester
18 100 43.5 Viscose/polyester 46 100 59 Viscose/polyester
19 125 43.5 Viscose/polyester 47 125 59 Viscose/polyester
20 160 43.5 Viscose/polyester 48 160 59 Viscose/polyester
21 180 43.5 Viscose/polyester 49 180 59 Viscose/polyester
22 25 43.5 Cotton 50 25 59 Cotton
23 50 43.5 Cotton 51 50 59 Cotton
24 75 43.5 Cotton 52 75 59 Cotton
25 100 43.5 Cotton 53 100 59 Cotton
26 125 43.5 Cotton 54 125 59 Cotton
27 160 43.5 Cotton 55 160 59 Cotton
and to determine the effect of controllable factors on these properties, 7 levels of filament pre-tension (25, 50, 75, 100, 125, 160, and 180 g), 4 levels of yarn count (41.5, 43.5, 48 and 59 tex) and two kind of sheath fibers (cotton and polyester/viscose) were chosen. The list of yarn samples and considered controllable factors are shown in Table III.
Instron testing machine (Model M10-8201-1) was used to measure the tenacity and elongation at breakage of yarns with a gauge length of 25 cm. For measuring hairiness (number of hairs, longer than or equal to 3 mm), Shirley Hairiness Tester (Model SDL096/8) was used. The measurement was carried out on 20 m of each yarn sample at the speed of 60 m/min. Abrasion resistance was determined by Shirley Abrasion Tester (Model Y027). All experiments were conducted under the conditions of 22ºC and 65 RH%. In order to determine the tenacity and elongation, each test was repeated 10 times and for abrasion resistance and hairiness the tests were repeated 5 times, and the average values were considered for each measured property.
TABLE IV
THE STATISTICAL RESULTS OF MANOVATEST WITH A %95 CONFIDENCE INTERVAL
Characteristic source SSE df MSE F P-value
Hairiness
Yarn count 295.8 3 98.62 7.29 0.00 Filament
pre-tension 603.39 6 100.57 7.43 0.00 Type of sheath
fiber 1874.11 1 1874.11 138.47 0.00 Error 609.05 45 13.53 - -
total 3382.42 55 - - -
Tenacity
Yarn count 13.24 3 4.41 2.84 0.04 Filament
pre-tension 67.75 6 11.29 7.27 0.00 Type of sheath
fiber 1995.47 1 1995.47 1155.68 0.00 Error 69.91 45 1.55 - -
total 1946.37 55 - - -
Abrasion resistance
Yarn count 73.03 3 24.34 4.64 0.00 Filament
pre-tension 64.38 6 10.73 2.05 0.04 Type of sheath
fiber 234.88 1 234.88 44.78 0.00 Error 236.05 45 5.24 - -
total 608.36 55 - - -
Elongation
Yarn count 39.46 3 13.15 2.94 0.04 Filament
pre-tension 113.18 6 18.46 4.21 0.00 Type of sheath
fiber 2520.81 1 2520.81 563.01 0.00 Error 201.48 45 4.48 - -
total 2874.93 55 - - -
IV. RESULTS AND DISCUSSION
To evaluate the effectiveness of considered parameters on the yarn properties, multivariate analysis of variance (MANOVA) was conducted on the obtained experimental data. The results of MANOVA test with a 95% confidence interval, for each property are shown in Table IV. This test compares the variance explained by factors to the left over variance that cannot be explained. If the calculated P-value
is lower than 5%, it means that the effect of the corresponding factor is significant on the investigated property. The statistically analysis showed that the controllable factors have significant effects on all investigated properties.
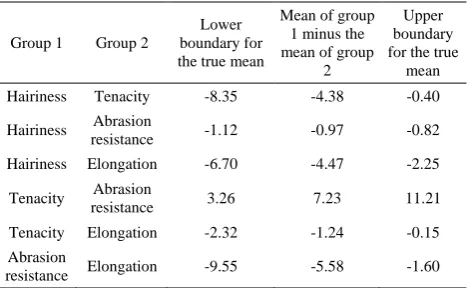
Moreover, in this study, a multi compare test with a 95% confidence interval on the measured properties was conducted to determine whether the collected data are all the same, against the general alternative that they are not all the same. The obtained results are presented in Table V.
TABLE V
THE RESULTS OF MULTI COMPARE TEST WITH A %95CONFIDENCE
INTERVAL FOR EACH GROUP
Group 1 Group 2
Lower boundary for the true mean
Mean of group 1 minus the mean of group
2
Upper boundary for the true
mean Hairiness Tenacity -8.35 -4.38 -0.40 Hairiness Abrasion
resistance -1.12 -0.97 -0.82 Hairiness Elongation -6.70 -4.47 -2.25
Tenacity Abrasion
resistance 3.26 7.23 11.21 Tenacity Elongation -2.32 -1.24 -0.15 Abrasion
resistance Elongation -9.55 -5.58 -1.60
If the confidence interval contains 0, the difference would not be significant. As can be observed in Table V, for none of the pairs of investigated properties the confidence interval is 0, therefore the difference is significant. As a result, separate models were used to predict each property.
A. Regression Model
Linear multiple regression analysis was used to establish a relationship between the core-compact yarn properties and the investigated controllable factors. To this aim, all data were divided randomly into two groups; namely reg-train and test group. Reg-reg-train group (44 data sets) was used to determine the regression coefficients and test group (12 data sets) was used to evaluate the accuracy of obtained regression equation in predicting measured properties. In this paper, three indexes were considered for measuring accuracy; namely mean absolute percentage error (MAPE, Eq. (1)), mean square error (MSE, Eq. (2)) and correlation coefficient (R-value).
1 MAPE 100
1 n yi xi
i
n x i
− ∑
= × ×
= (1)
1 2
MSE (y )
1 n
x
i i
i n
∑
= × −
= (2)
where xi is the actual value and yi is the corresponding
accuracy in modeling obtains when they are 0 or very close to 0. Eqs. (3) to (6) and Table VI present the obtained results for regression analysis.
4.84 0.08 0.01 11.23
Tenacity = − + ×N + × +T ×F (3)
4.67 0.21 0.02 13.34
Elongation = − − ×N + × +T ×F (4)
37.66 0.8 0.07 11.36
Hairiness = − ×N + × −T ×F (5)
3.65 0.04 0.01 2.14
A brasion resistance = − ×N + × −T ×F (6)
where N, T and F are the yarn count, the filament pre-tension and the type of sheath fibers, respectively. Here, cotton and viscose/polyester types were considered 1 and 0, respectively. As can be seen in Table VI, the accuracy of regression model evaluated by R-value is high, but MSE and MAPE are not close to 0 which means the linear regression is not appropriate enough to model the measured properties. It should be mentioned that although using a higher order regression like quadratic leads to better results in prediction as shown in Table VI, this type of regression due to existence of numerous terms and calculation complexity is not easy to use. Hence, a more powerful model such as ANN is required for modeling.
TABLE VI
R-VALUE,MSE AND MAPEBETWEEN REGRESSION PREDICTION AND
CORRESPONDING ACTUAL DATA (TEST GROUP)
R-value MSE
MAPE Property
Model type
0.97 2.18
1.29 Tenacity
Linear Elongation 1.57 10.42 0.66 0.86 12.45
2.77 Hairiness
0.32 3.51
1.34 Abrasion resistance
0.98 1.08
0.81 Tenacity
Quadratic Elongation 1.36 2.74 0.97 0.64 2.30
1.19 Hairiness
0.24 4.93
1.72 Abrasion resistance
B. ANN Model
ANN includes various parameters which influence directly the prediction accuracy, but the most effective ones are the number of hidden layers and the number of neurons in each hidden layer. In this study to find the best set of ANN parameters for each investigated property, the trial and error method was applied. Regarding the literature review, the number of hidden layers and neurons in each hidden layer were considered between 1 to 3 and 1 to 10, respectively. The activation functions for all the hidden and output layers were considered Tangent hyperbolic shown in Eq. (5), and linear functions, respectively.
x x
e e
Tanh x x
e e
− −
= −
+ (5)
ANNs were trained with the error back propagation algorithm using Trainlm function. To train ANN, the data
sets in reg-train group were divided randomly into two groups; namely ANN-train (34 data sets) and validation (10 data sets) groups. As initial weights in ANN were selected randomly, each ANN topology was considered five times and the best result for that topology was considered. To evaluate the accuracy of ANN models, the same test group for regression analysis was used and all three mentioned indexes were calculated. The best topology of ANNs for each investigated property corresponding to different indexes are shown in Table VII.
TABLE VII
THE BEST TOPOLOGY OF ANN FOR EACH INVESTIGATED PROPERTIES
BASED ON MAPE,MSE AND R-VALUE
Considered index to select the best ANN
Properties
Hidden layer (best topology of
ANN)
Accuracy indexes between ANN output with best topology
and corresponding actual values for testing group MAPE MSE R-value
MAPE
Tenacity {8 3} 0.0626 0.8500 0.9929 Elongation {9 9} 0.0600 0.4843 0.9942 Hairiness {6 6} 0.0997 0.3283 0.8374 Abrasion
resistance {2 4 4} 0.1744 1.8600 0.7587
MSE
Tenacity {8 4} 0.0629 0.8550 0.9800 Elongation {7 9} 0.0650 0.4840 0.9950 Hairiness {4 6} 0.0829 0.6400 0.9800 Abrasion
resistance {2 5 5} 0.1754 1.8500 0.7540
R-value
Tenacity {8 6} 0.0628 0.8850 0.9939 Elongation {9 7} 0.0630 0.4950 0.9990 Hairiness {6 8} 0.0815 0.6927 0.9946 Abrasion
resistance {2 5 5} 0.1854 1.9400 0.7589
In Table VII, for example {2 4 4} in the hidden layer column means that ANN contains three hidden layers with 2, 4 and 4 neurons at first, second and third hidden layers, respectively, and this ANN can predict the abrasion resistance with the highest accuracy according to MAPE index. But in using MSE as the accuracy index, the best topology for predicting abrasion resistance is {2 5 5}. Besides the criteria index to select the best ANN topology, the other two indexes were calculated as shown in Table VII.
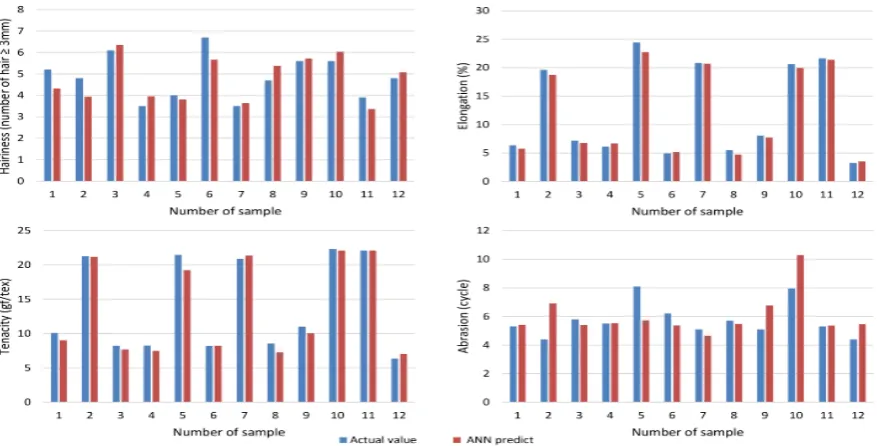
According to Table VII, the perfect prediction ability of ANN model is revealed, but a closer look indicates that considering the MAPE index for choosing the best ANN topology leads to higher accuracy in prediction. Fig. 3 illustrates the ANN outputs based on MAPE index to select ANN topology along with corresponding actual values for different properties.
V.CONCLUSION
Core-spun yarns are used in a wide spectrum of end-uses such as military textiles and industrial textiles. The yarn parameters such as filament pre-tension, yarn count and the type of sheath fiber have a significant influence on physical and mechanical properties of compact-core spun yarns such as tenacity, elongation, hairiness and abrasion resistance. Therefore, modeling these parameters can give in-depth information about yarn properties. In the first step, the significant effect of yarn parameters on the measured properties were investigated statistically. Regarding the results of multi compare test, to predict yarn properties separately, regression and ANN models were considered based on the yarn parameters. To achieve the best result for modeling, three indexes namely MAPE, MSE and R-value were evaluated and finally it was found that considering MAPE as a criterion for selecting the best ANN topology leads to the highest accuracy in prediction. Moreover, the results showed that the best topology for predicting tenacity, elongation and hairiness is a two-hidden layer ANN (maximum MAPE < 0.10) with {8 3}, {9 9} and {6 6} formats, respectively, while for the abrasion resistance the best one is {2 4 4} (MAPE < 0.17).
REFERENCES
[1] A. Sawhney, K. Robert, G. Ruppenicker, and L. Kimmel, “Improved method of producing a cotton covered/polyester staple-core yarn on a ring spinning frame”, Text. Res. J., vol. 62, no. 1, pp. 21-25, 1992.
[2] A . Sawhney, G. Ruppenicker, L. Kimmel, and K. Robert, “Comparison of filament-core spun yarns produced by new and conventional methods”, Text. Res. J., vol. 62, no. 2, pp. 67-73, 1992.
[3] G. L. Louis, H. Salaum, and L. B. Kimmel, “Ring spun–staple core warp yarn- a progress report”, J. Text. Inst., vol. 59, no. 4, pp. 244-246, 1989.
[4] G. Jou, G. East, C. Lawrence, and W. Oxenham, “The physical properties of composite yarns produced by an electrostatic filament-charging method”, J. Text. Inst., vol. 87, no. 1, pp. 78-96, 1996.
[5] W. Xu, Z. Xia, X. Wang, J. Chen, W. Cui, W. Ye, C. Ding, and X. Wang, “Embeddable and locatable spinning”, Text. Res. J., vol. 81, no. 3, pp. 223-229, 2010.
[6] A. Pourahmad and M. S. Johari, “Comparison of the properties of Ring, Solo, and Siro core‐spun yarns”, J. Text. Inst., vol. 102, no. 6, pp. 540-547, 2011.
[7] N. Brunk, “EliCore and EliCoreTwist production of compact core yarns”, Spinnovation, vol. 21, pp. 4-9, 2005.
[8] O. Balci, S. N. Oğulata, C. Şahin, and R. T. Oğulata, “An artificial neural network approach to prediction of the colorimetric values of the stripped cotton fabrics”, Fiber. Polym., vol. 9, no. 5, pp. 604-614, 2008.
[9] B. Behera and R. Guruprasad, “Predicting bending rigidity of woven fabrics using artificial neural networks”, Fiber. Polym., vol. 11, no. 8, pp. 1187-1192, 2010.
[10] A. A. Gharehaghaji, M. Shanbeh, and M. Palhang, “Analysis of two modeling methodologies for predicting the tensile properties of cotton-covered nylon core yarns”, Text. Res. J., vol. 77, no. 8, pp. 565-571, 2007.
[11] A. K. Soe, M. Takahashi, M. Nakajima, T. Matsuo, and T. Matsumoto, “Structure and properties of MVS yarns in comparison with ring yarns and open-end rotor spun yarns”, Text. Res. J., vol. 74, no. 9, pp. 819-826, 2004.
[12] V. K. Midha, V. Kothari, R. Chattopadhyay, and A. Mukhopadhyay, “A neural network model for prediction of strength loss in threads during high speed industrial sewing”, Fiber. Polym., vol. 11, no. 4, pp. 661-668, 2010.
[13] M. Nasiri, M. Shanbeh, and H. Tavanai, “Comparison of statistical regression, fuzzy regression and artificial neural network modeling methodologies in polyester dyeing”, In: International Conference on Computational Intelligence for Modelling, Control and Automation, Vienna, 2005.
[14] P. Soltani, M. Vadood, and M. S. Johari, “Modeling spun yarns migratory properties using artificial neural network”, Fiber. Polym., vol. 13, no. 9, pp. 1190-1195, 2012.
[15] E. Naghashzargar, D. Semnani, S. Karbasi, and H. Nekoee, “Application of intelligent neural network method for prediction of mechanical behavior of wire-rope scaffold in tissue engineering”, J. Text. Inst., vol. 105, no. 3, pp. 264-274, 2013. [16] D. Semnani and M. Vadood, “Improvement of intelligent
methods for evaluating the apparent quality of knitted fabrics”, Eng. Appl. Artif. Intell., vol. 23, no. 2, pp. 217-221, 2010. [17] M. Vadood, D. Semnani, and M. Morshed, “Optimization of
acrylic dry spinning production line by using artificial neural network and genetic algorithm”, J. Appl. Polym. Sci., vol. 120, no. 2, pp. 735-744, 2011.