ARTHROPOD MANAGEMENT AND APPLIED ECOLOGY
Sweep Net Recapture of Marked Lygus hesperus Knight (Hemiptera: Miridae)
Adults After Different Release Times in Cotton
W. Rodney Cooper* and Dale W. Spurgeon
W.R. Cooper* and D.W. Spurgeon, USDA, ARS, WICSRU, 17053 N. Shafter Ave., Shafter, CA 93263
*Corresponding author: Rodney.Cooper@ars.usda.gov ABSTRACT
The elevated status of Lygus spp. as key cot-ton pests has accentuated the need for improved interpretation of population samples. Mark-release-recapture methods were recently developed to investigate factors that affect sweep net sampling of adult L. hesperus Knight. During these efforts, marked bugs were released in the evening before sampling the following morning. Releases closer
to the time of sampling would provide greater flex -ibility in future mark-release-recapture studies, but the effects of release time on subsequent recapture is unknown. Our objective was to compare sweep net collections of marked bugs following different release times. Separate studies were conducted in two plantings of Acala cotton (Gossypium hirsutum
L.). In the first planting (study-1), marked bugs were
released into rows on the evening before sampling or 2 h before sampling. In the second planting (study-2), we included an additional release <5 min before
sampling. In study-1, more marked bugs were
recaptured from rows in which bugs were released 2 h before sampling than from rows in which bugs were released the evening before sampling. This difference was not observed in study-2, but more bugs were recaptured from rows in which bugs were released <5 min before sampling compared with other releases. Based on differences in plant development and observed predation between the two plantings, we hypothesize that the effects of release time on the recapture of marked bugs were caused by increased within-plant redistribution of marked bugs and by increased losses to predation with increased time between releases and sampling.
T
he western tarnished plant bug, Lygus hesperus Knight (Hemiptera: Miridae) and the tarnished plant bug, Lygus lineolaris (Palisot de Beauvois),are key pests of cotton (Gossypium barbadense L.
and G. hirsutum L.) in the western and southeastern
U.S., respectively (Hanny et al., 1977; Sevacherian and Stern, 1972). The pest status of plant bugs has been elevated recently because of reduced insecticide use following the near-eradication of the boll weevil (Anthonomus grandis Boheman) and the adoption of transgenic insecticidal cotton for control of lepidopterous pests (Ellsworth, 2008; Fournier et al., 2007; Musser et al., 2007). The elevated pest status of plant bugs has accentuated the need for improved management strategies. The development of effective management rules for plant bugs depends upon accurate interpretation of population estimates provided by commonly used sampling methods such as the sweep net.
A mark-release-recapture method was recently developed for evaluating sampling methods for adult L. hesperus in cotton (Spurgeon, 2009). Adult
L. hesperus are marked with a small droplet of
MATERIALS AND METHODS
Sample areas. We conducted experiments in two separate plantings of Acala (cv. Phytogen 72) cotton
(G. hirsutum). The first planting was in mid-April
2009, and the second planting was in early June 2009. A 1.02-m row spacing was used for both plantings. The
experiment conducted in the first planting is referred
to as study-1, and the experiment conducted in the sec
-ond planting is referred to as study-2. Each study was designed as a randomized complete block with three replications per sample date. Each block was sampled weekly for 5 wk in study-1 and for 4 wk in study-2 (Table 1). In both studies, a block was composed of 12 to 16 10-m long parallel row sections. Each row section was isolated from the remainder of the row by removing plants from an area ≥1 m long at each end of each section. Each week, rows for sampling were selected based on similarity of plant size and development. Sample rows within a given week were not adjacent to each other and were at least four rows from the field margin. No row section was sampled more than once during the experiment. Each week, time of release treatments were randomly assigned to the selected rows in each block.
To estimate the populations of released L.
hes-perus that remained in the sample rows at the time
of sampling, 1-m row sections (n=2/release time/ date) were established each week of both studies except the first sample date of study-1 (3 June). Row sections were selected based on similarity of plant size and development to rows sampled with sweep nets. For simplicity, 1-m row sections are referred to as recovery rows and 10-m row sections that were sampled with the sweep net are referred to as sample rows.
Marking of Lygus hesperus. Adult L. hesperus were obtained from a colony maintained on green beans (Phaseolus vulgaris L.) and sunflower seeds
(Helianthus annuus L.) at 28-30°C with a 14:10
(L:D) h photoperiod. Cohorts of newly emerged adults were collected each week representing adult ages of 3-6, 6-8, 8-10, and 10-13 d old at the
time of sampling. When sufficient numbers of L.
hesperus could not be obtained from the colony,
adults of unknown age were collected from alfalfa
(Medicago sativa L.). In the first study, colony
reared bugs were used on three sample dates (3, 11, and 18 June), a mixture of colony reared and
field collected bugs were used on 26 June, and field collected bugs were used on 2 July. In the second study, a mixture of colony reared and field collected bugs were used on three sample dates (30 July, 13 and 20 August) and field collected bugs were used on the 6 August sample date. Regardless of origin, bugs were held in the laboratory for ≥24 h before marking. Colony reared marked bugs were held in mixed-gender groups by age cohort in rearing buckets maintained at 24°C with a 14:10 (L:D) h photoperiod. Field collected marked bugs were held in groups in the laboratory at room temperature by collection cohort.
Lygus hesperus were marked using methods
described by Spurgeon (2009). Bugs were lightly anesthetized with CO2 and positioned to provide access to the dorsum. A small droplet of fingernail polish was applied near the posterior tip of the
scutellum in a manner to prevent flight. Bugs ca
-pable of separating their wings were discarded. All bugs released on a single date were marked with the same color.
Releasing of marked Lygus hesperus. On the day of release, marked bugs were aspirated into 55.5-ml vials containing green bean segments (Spurgeon, 2009). Two release times were included in study-1. Releases were made between 1900-2000 h (PDT)
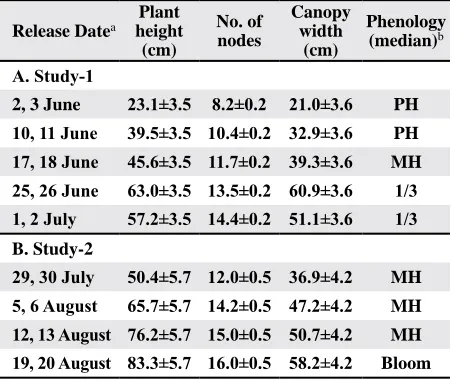
Table 1. Means of plant height, number of mainstem nodes,
canopy width, and median stage of fruiting development from sample rows corresponding to sample dates in studies
examining the effects of release time on sweep net recapture
of marked Lygus hesperus adults in cotton.
Release Datea
Plant height (cm)
No. of nodes
Canopy width
(cm)
Phenology (median)b
A. Study-1
2, 3 June 23.1±3.5 8.2±0.2 21.0±3.6 PH
10, 11 June 39.5±3.5 10.4±0.2 32.9±3.6 PH
17, 18 June 45.6±3.5 11.7±0.2 39.3±3.6 MH
25, 26 June 63.0±3.5 13.5±0.2 60.9±3.6 1/3 1, 2 July 57.2±3.5 14.4±0.2 51.1±3.6 1/3
B. Study-2
29, 30 July 50.4±5.7 12.0±0.5 36.9±4.2 MH
5, 6 August 65.7±5.7 14.2±0.5 47.2±4.2 MH
12, 13 August 76.2±5.7 15.0±0.5 50.7±4.2 MH
19, 20 August 83.3±5.7 16.0±0.5 58.2±4.2 Bloom
a Marked bugs were released between 1900-2000 h (PDT)
the evening before sampling, between 0700-0800 h the morning of sampling (study-1 and -2), and immediately
before sampling (study-2).
b PH=pinhead square (bud 1-3 mm diameter),
on the evening before sampling and between 0700-0800 h on the morning of sampling. An additional release time occurring <5 min before sampling was included in study-2. Sixty marked bugs per 10-m sample row (6 bugs per row meter) were evenly dis-persed into the upper plant canopies of sample rows, except on the weeks of 11 June and 18 June, when 40 bugs per row were released. Each row contained equal numbers of each age (colony reared) and/or collection cohort (field collected). Concurrent with releases into sample rows, eight bugs (2 per age or collection cohort) were released into 1-m recovery rows corresponding to releases on the evening before sampling and 2 h before sampling. Recovery rows were not used for releases occurring <5 min before sampling.
Sampling of marked Lygus hesperus. Marked bugs were collected from each 10-m sample row using 10 pendulum sweeps with a standard 38-cm sweep net. One sweep was a single pass with the net across the row. Sampling began at about 1000 h for all release times. Rows within blocks were sampled by the same person. Each sample was placed into a labeled sealable plastic bag and frozen until marked bugs were counted.
Immediately following sweep net sampling
(≈1030 h), plants within recovery rows were care
-fully dissected and visually searched for marked bugs, which were recorded as missing, alive, or dead (Spurgeon 2009). The presence of natural enemies including nabids (Hemiptera: Nabidae) and assassin bugs (Hemiptera: Reduviidae) was also noted.
Plant phenology. Immediately following sam-pling, plant measurements were recorded from five evenly spaced locations within each sample row. Measurements included plant height (mainstem length from the soil surface to the terminal), main-stem node number (with the hypocotyl as node zero and counting to the uppermost expanded leaf), and canopy width. Plant fruit were categorized as “sub-pinhead square” (bud <1 mm in diameter), ““sub-pinhead square” (bud 1-3 mm in diameter), “match-head square” (bud >3 to <6 mm in diameter), “1/3 grown square” (bud ≥ 6 mm diameter), “candle” (petals elongated but not open), “bloom” (open white flower), and “boll”.
Statistical analyses. In each study, the num-bers of marked bugs collected from 1-m recovery rows, and from 10-m sample rows were analyzed separately using the GLIMMIX procedure (SAS
ver 9.2, SAS Institute, Cary, NC). The fixed ef
-fects were release time, sample date, and time-date interaction, and the random effect was block. De-pendent variables for 10-m sample rows and 1-m recovery rows were the number of marked bugs per 10 sweeps and number of live marked bugs recovered, respectively. On dates using releases of 4 bugs/row m, sweep net counts were multiplied by 1.5 to make the counts equivalent to the release rates on other dates. In a separate set of analyses, sweep net counts from 10-m sample rows were adjusted to account for the loss of marked bugs by dividing the number of marked bugs captured per 10 sweeps by the corresponding proportion of marked bugs collected from recovery rows. Counts from rows in which bugs were released <5 min
before sampling were not adjusted. Data were ex
-amined for evidence of heterogeneity of variance and non-normality of errors by inspecting residual and normal quantile-quantile plots, respectively. Based on these plots, the untransformed counts were analyzed. Where differences among levels of fixed effects were indicated, means were compared using the ADJUST=SIMULATE option of the LSMEANS statement.
RESULTS AND DISCUSSION
Study-1. On the first week of sampling, plants averaged 23 cm tall and 21 cm wide, and had an average of 8 nodes (Table 1A). By the final week of sampling, plants averaged 57 cm tall and 51 cm wide, and had an average of 14 nodes (Table 1A). The median fruit development stage never progressed beyond 1/3-grown squares (Table 1A), which was reflective of generally poor square retention (WRC and DWS, personal observations).
Analysis of collection of live marked bugs from 1-m recovery rows revealed a significant release time effect (F=7.00; df=1, 8; P=0.029), but did not reveal
a significant date effect (F=3.19; df=3, 8; P=0.084)
sampling dates suggests a higher number of marked bugs were captured on the first sample date (3 June) than on the last two sample dates (26 June and 2 July) although P-values adjusted for multiplicity
were not significant (adjusted P range, 0.061-0.088).
The observed pattern of decreasing captures with increasing plant development was consistent with the report of Spurgeon (2009).
A separate analysis was conducted in which the numbers of marked bugs collected with the sweep net were adjusted to reflect the proportion of released bugs that were recovered alive from recovery rows. Because analysis of recovery row data did not reveal a significant date effect or a date × release time interaction, sweep net data were adjusted by dividing the number of marked bugs collected from rows into which bugs were released on the evening before or 2 h before sampling by 0.86 and 0.97, respectively. Analysis of adjusted sweep net collections revealed significant release time (F=9.28; df=1, 18; P=0.007) and date (F=3.42; df=4, 18; P=0.030) effects, and no significant in -teraction between these effects (F=0.38; df=4, 18; P=0.821) (Fig. 2B). These results were similar to those from the analysis of unadjusted data, as was expected because recovery of bugs corresponding to both release times was generally high.
Results of study-1 indicate that recapture of marked bugs with the sweep net was decreased when the amount of time between releases and col-lections increased. Two possible explanations for these results are increased emigration of marked bugs from the sample rows, or increased losses of marked bugs due to predation with increased time between releases and sample collection. Emigration of marked bugs from sample rows seems more likely to occur with increasing time since release. However, Spurgeon (2009) reported little between-row move-ment of marked bugs released into sample rows on the evening before sampling the following morning. Nabids, which are effective predators of L. hespe-rus (Perkins and Watson, 1972), were frequently observed during study-1, and bugs released in the evening were available for predation for a longer period than were bugs released 2 h before sampling. However, neither the generally high proportion of marked bugs found alive in recovery rows or the analysis of sweep net data adjusted for recovery suggest meaningful losses of marked bugs from emigration or predation.
On average, more marked bugs were collected in 10-sweep samples from rows into which bugs were released 2 h before sampling (mean=8.5/10 sweeps) compared with rows into which bugs were released on the evening before sampling (mean=5.3/10 sweeps; F=9.53; df=1, 18; P=0.006). The analyses
also indicated a significant date effect (F=3.00; df=4,
18; P=0.046). The absence of a significant release
time × date interaction (F=0.30; df=4, 18; P=0.877) suggests the influence of release time was consistent over sample dates (Fig. 2A). Comparisons among
Study-1
Mar
k
ed lygus/1-m reco
v
er
y ro
w
Study-2
Mar
k
ed lygus/1-m reco
v
er
y ro
w
Collection date
Figure 1. Recovery of marked Lygus hesperus adults from
The sweep net primarily samples from the upper canopy. Marked and released bugs that redistribute from the outer surfaces of the upper canopy to po-sitions lower in the canopy, or to popo-sitions in the upper canopy that are closer to the plant mainstem, would be less accessible to the sweep net than bugs nearer the original locations of release. Marked bugs released on the evening before sampling had more opportunity to redistribute within the canopy compared with bugs released 2 h before sampling.
Therefore, it seems likely that the differences in sweep net collections observed between release times reflected different within-plant distributions of bugs released at different times.
Study-2. Air and soil temperatures were high in June when study-2 was planted. Most plants did not initiate squares until the 8th or 9th nodes. When
sampling began, plants averaged 50 cm tall and 36 cm wide, and had an average of 12 nodes (Table 1B). The median phenological stage remained at
match-Study-1
Mar
ked lygus/1 s
w
eeps
Study-2
Mar
ked lygus/1 s
w
eeps
Collection date
Figure 2. Effects of release time on sweep net recapture (10 sweeps/10-m sample row) of marked adult Lygus hesperus:
(A) number of marked bugs recaptured with the sweep net in study-1 (3 June to 2 July) from rows into which bugs were released between 1900-2000 h (PDT) (●) or between 0700-0800 h (○) before sampling at 1000 h; (B) study-1 sweep net collections adjusted for the proportion of live marked bugs recaptured from 1-m recovery rows; (C) number of marked bugs recaptured with the sweep net in study-2 (30 July to 20 August) from rows into which bugs were released begin
head square from 30 July to 13 August. However, most plants had at least one white bloom by 20 August when plants averaged 83 cm tall and 58 cm wide (Table 1B). The prolonged pre-bloom squaring period was indicative of the poor square retention observed during the study (Table 1B; WRC and DWS, personal observations).
In study-2, a significant release time × date interaction for the recovery of live marked bugs on 1-m recovery rows (F=12.00; df=3, 7; P=0.004) in-dicated some variation in the effects of release time among sample dates. During each sample date except 30 July (the first week of sampling), significantly more marked bugs were collected from recovery rows into which bugs were released 2 h before sam-pling compared with recovery rows into which bugs were released on the evening before sampling (Fig. 1B). From 6 August through 20 August, an average of 90% of released bugs were collected from recovery rows with releases occurring 2 h before sampling, where as only 67% of marked bugs were recovered from rows with releases occurring on the evening before sampling.
Both release time (F=5.50; df=2, 22; P=0.012) and date (F=4.10; df=3, 22; P=0.019) influenced the numbers of marked bugs collected with the sweep net, and we observed no interaction between these effects (F=0.56; df=6, 22; P=0.759) (Fig. 2C). Numbers of marked bugs collected did not differ be-tween rows into which bugs were released 2 h before sampling (mean=4.3/10 sweeps) and rows into which bugs were released on the evening before sampling (mean=4.2/10 sweeps). However, significantly more marked bugs (mean=7.0/10 sweeps) were caught from rows into which bugs were released <5 min before sampling compared with rows with other release times (Fig. 2C).
Assassin bugs were present in recovery rows and sweep net samples on each collection date of study-2, and were frequently observed predating both marked and unmarked L. hesperus. To examine if the higher sweep net recapture of marked bugs from rows with different release times could be explained by predation, a separate analysis was conducted on sweep net counts adjusted using the corresponding proportions of marked bugs recovered alive from recovery rows. Because the analysis of marked bugs collected from recovery rows revealed a significant date × release time interaction, sweep net counts were adjusted by dividing the number of bugs/10 sweeps by the proportions of marked bugs collected
from recovery rows with different release times on each date (Fig. 1B). Counts from sample rows with marked bugs released <5 min before sampling were assumed to reflect the number of marked bugs that were released into these rows, and therefore were not adjusted. Analysis of adjusted sweep net counts
revealed a significant date effect (F=3.64; df=3, 22;
P=0.029), but did not detect an interaction between release time and date (F=1.11; df=6, 22; P=0.389)
or a significant release time effect (F=1.44; df=2,
22; P=0.259) (Fig. 2D). These results suggest that predation was likely responsible for the observed dif-ferences in unadjusted sweep net collections among the different release times in study-2.
CONCLUSIONS
Further elucidation of sources of variation in-fluencing sweep net recaptures of marked bugs will aid in designing and interpreting future studies that use mark-release-recapture methods. Future studies manipulating plant canopy characteristics such as plant height, canopy width, or square distribution could provide additional insight into the relation-ships between plant architecture, distribution of marked bugs, and recapture of marked bugs with the sweep net.
DISCLAIMER
Mention of trade names or commercial products in this article is solely for the purpose of providing
specific information and does not imply recommen
-dation or endorsement by the United States Depart-ment of Agriculture.
ACKNOWLEDGMENTS
We thank Addison Chavez, Neil Hudson, Nicole Lona, Cameron Snell, and Stephen Wingard for their assistance during these studies.
REFERENCES
Ellsworth, P. 2008. Lygus management: A western per-spective. p. 924–926. In Proc. Beltwide Cotton Conf., Nashville, TN. 8-11 Jan. 2008. Natl. Cotton Counc. Am., Memphis, TN.
Fournier, A., P. Ellsworth, and V. Barkley. 2007. Economic impact of lygus in Arizona cotton: A comparative ap-proach. p. 155-166. In R. Tronstad and E.R. Norton (ed.), Cotton: A College of Agriculture and Life Sciences Re-port. Publication P-151. University of Arizona, Tucson, AZ.
Hanny, B.W., T.C. Cleveland, and W.R. Meredith, Jr. 1977. Effects of tarnished plant bug, (Lygus lineolaris), in-festation on presquaring cotton, (Gossypium hirsutum). Environ. Entomol. 6: 460–462.
Musser, F., S. Stewart, R. Bagwell, G. Lorenz, A. Catchot, E. Burris, D. Cook, J. Robbins, J. Greene, G. Studebaker, and J. Gore. 2007. Comparison of direct and indirect sampling methods for tarnished plant bug (Hemiptera:
Miridae) in flowering cotton. J. Econ. Entomol. 100:
1916–1923.
Perkins, P.V. and T.F. Watson. 1972. Nabis alternatus as a predator of Lygus hesperus. Ann. Entomol. Soc. Am. 65: 625–629.
Sevacherian, V. and V.M. Stern. 1972. Spatial distribution
pat-terns of lygus bugs in California cotton fields. Environ.
Entomol. 1: 695–704.