0 INTRODUCTION
With the rise of cloud computing [1] and the development of Internet of things [2] and other related technologies, the cloud manufacturing based on them provides a new way to realize centralized management, unified scheduling, on-demand use of all kinds of distributed manufacturing resources [3]. Cloud manufacturing, in the form of cloud services, for the whole manufacturing life cycle, provides all kinds of manufacturing resources which can obtain and pay for use at any time [4]. A single cloud service is often difficult to meet customer’s manufacturing requirements. Therefore, with service composition, a cloud manufacturing service platform assembles a number of fine-grained simple cloud services into coarse-grained complex cloud services to meet customer’s complex manufacturing requirements [5]. Implementation of cloud manufacturing is a collaborative process that requires the participation of multiple distributed manufacturing resources. In the cloud manufacturing service platform, it is shown as a series of activities, such as manufacturing demand decomposition, service matching with tasks, service composition optimization, service execution monitoring, etc. [6]. According to the opening degree
of services to users, cloud manufacturing services can be divided into public cloud services and private cloud services [7]. The manufacturing resources of private cloud services are limited to internal use, not for providing services directly to users outside the enterprise. The manufacturing resources of public cloud services are not only available for internal users but also directly provide services to users outside the enterprise. In manufacturing processes, there are a variety of information interaction and material transportation among cloud manufacturing services. It is a kind of complex relationship that is full of mutual dependence, constraints and competition [8]. Therefore, assembling appropriate fine-grained cloud services according to the customer’s manufacturing needs is an important part of the implementation process of cloud manufacturing.
Some scholars have done research on the optimization of service composition. For example, Lartigau et al. [9] proposed an improved artificial bee colony optimization algorithm for solving the cloud manufacturing service composition model based on QoS with geo-perspective transportation; Jeong and Lee [10] proposed a web service composition formal model with business logic process buffer based on CSP (Communication Sequential Process); Castejon
Multi-objective Optimization of Cloud Manufacturing Service
Composition with Cloud-Entropy Enhanced Genetic Algorithm
Li, Y.X. – Yao, X.F. – Zhou, J.F. Yongxiang Li – Xifan Yao* – Jifeng Zhou
School of Mechanical & Automotive Engineering, South China University of Technology, China
To consider the service-matching degree, the composition harmony degree, and the service composition complexity in cloud manufacturing service composition optimization problems, a new composition optimization approach, called cloud-entropy enhanced genetic algorithm (CEGA), is put forward to solve such problems with multi-objectives. The definitions of service-matching degree, composition harmony degree, and cloud-entropy and the corresponding calculation methods are given. A multi-objective optimization mathematical model of cloud manufacturing service composition is built. The manufacturing task of AGV (automated guided vehicle) is taken as an example to verify the proposed CEGA algorithm on the established composition model. The studied result shows that CEGA converges faster than a standard genetic algorithm with shorter time.
Keywords: cloud manufacturing, service composition optimization, cloud-entropy, service-matching degree, composition harmony degree, genetic algorithm
Highlights
• Cloud-entropy enhanced genetic algorithm (CEGA) is proposed.
• Service-matching degree, composition harmony degree, and cloud-entropy are defined, and the corresponding calculation methods are given.
• The multi-objective optimization mathematical model of cloud manufacturing service composition is built.
• The manufacturing task of AGV is taken as an example to verify the proposed CEGA algorithm on its feasibility and effectiveness.
et al. [11] proposed multi-objective optimal design procedure applied to a robotic arm for service tasks; Jovanovic et al. [12] described production cycle scheduling algorithm on the grounds of investigations of manufacturing capacity utilization levels and causes of loss for special-purpose products in complex manufacturing environments; Gaaloul et al. [13] proposed a dynamic mining algorithm based on a statistical technique to discover composite web service patterns from execution logs; Stegaru and Stanescu [14] presented a methodological modeling framework for quality driven web service composition that tackles quality from the user, final product, and process views; Omid et al. [15] proposed a framework for context-aware web service composition using planning techniques; Iordache and Moldoveanu [16] introduced a QoS-aware end-to-end web service composition approach that handles all the stages from the web service discovery step to the actual binding of the services, using a genetic algorithm to compute and compare the aggregated QoS of the composite services; Berlec et al. [17] proposed basic and extended models that take into account the tied-up capital in a production to calculate the optimal batch quantity; Avitabile et al. [18] used component modes from unconnected components as projection matrices to identify the system level full field response; Florjanic et al. [19] proposed an artificial neural network model to address the problem of estimating the volume of manufacturing hours in model manufacturing; Suzic et al. [20] studied mass customized production by using group technology and production flow analysis in a panel furniture manufacturing company; Chifu et al. [21] presented an ant-inspired method for selecting the optimal solution in semantic web service composition; Xiao et al. [22] proposed an improved shuffled frog leaping algorithm for solving the optimization problems of multi-objective production transportation scheduling in a cloud manufacturing environment; Dong and Guo [23] proposed a cloud manufacturing service evaluation and selection optimization model based on a global trust degree and composite template; Jing et al. [24] presented a cloud manufacturing service composition optimization algorithm based on discrete particle swarm optimization and execution reliability; Zhao et al. [25] proposed the service capability evaluation model of small and medium enterprise design knowledge resources and the mathematical model of design knowledge resource serialization combination under a cloud manufacturing environment, and a quantum harmony search algorithm for solving the model was given; Bao et al. [26] divided the service
composition into three stages: the matching of adjacent nodes, the cleaning of broken branch nodes and the combination of atomic services, and put forward three steps service composition algorithm of the combination of atomic services based on knowledge. The above documents built service composition models and the corresponding solution algorithms mainly based on the analysis of service composition targets, most of which idealized a cloud manufacturing service as a kind of “rigid body”, which was separated from the social relationship, seldom considering the relationships between the cloud manufacturing services and manufacturing tasks, and between cloud manufacturing services on the service composition optimization. However, to meet the personalized needs in the cloud manufacturing environment, it requires collaborative participation among customers and cloud manufacturing service providers and others [27]. The matching degree of cloud manufacturing services and manufacturing tasks, the harmony degree of cloud manufacturing services in service composition, and the complexity of service composition have great influence on the completion of customized/personalized product manufacturing tasks. Therefore, it is imperative to consider those factors for studying the optimization of cloud manufacturing service composition.
This study constructs a cloud manufacturing service composition optimization mathematical model with the consideration of the matching degree of service and task in the process of cloud manufacturing service composition, the composition harmony degree, and the complexity of service composition, and then proposes a cloud-entropy enhanced genetic algorithm (CEGA) to solve the problem. Finally, the model and the algorithm are verified by an example of an automatic guided vehicle manufacturing task.
The remainder of this paper is organized as follows: Section 1 analyzes the objectives and the strategies of cloud manufacturing service composition; Section 2 gives the definitions of service-matching degree, composition harmony degree, and cloud-entropy, as well as the corresponding calculation methods; Section 3 proposes CEGA algorithm; Section 4 analyzes the application case; and Section 5 concludes the whole paper and gives future work.
1 CLOUD MANUFACTURING SERVICE COMPOSITION ANALYSIS
manufacturing service platform service composition modules. The goal of cloud manufacturing service composition is that various product manufacturing tasks are allocated to private cloud services and the most appropriate public cloud services, making the service composition meet the technical requirements of product, process time constraints and other conditions, and to obtain the maximum economic benefit [28]. The matching degree of cloud manufacturing services and manufacturing tasks, the harmony degree of cloud manufacturing services in service composition, and the complexity of service composition have significant impacts on the service composition, so cloud service composition should not only consider the product delivery period, manufacturing cost and other traditional factors, but also address service-matching degree, composition harmony degree and cloud-entropy.
In the cloud manufacturing service composition, matching manufacturing tasks with public cloud services and/or enterprise private cloud services is necessary. If the cloud manufacturing service provider cannot understand its customers’ manufacturing needs completely, or in the cloud manufacturing service platform it is hard to accurately express customers’ requirement, customers and cloud manufacturing service providers need to communicate, coordinate, and collaboratively participate in product manufacturing processes. If the cloud service customer belongs to a branch of a group company, due to the restriction of its equipment manufacturing capacity and technical level, it is difficult for the customer to complete a manufacturing task alone, so it needs to be completed with the enterprise private cloud services or public cloud services. The main effect of customers’ participation in manufacturing processes is the verification and feedback of product manufacturing requirements. Such a manufacturing model in which customers are directly involved in the product manufacturing processes is different than traditional closed-door manufacturing and networked manufacturing based on the knowledge of the customers’ description of manufacturing requirements. Its outstanding advantage is that customers can directly inspect and provide feedback on a manufacturing process or even some parts and components in the process of product development or manufacturing, and without any need to wait for all the manufacturing tasks to be completed before the product information feedback. To a certain extent, it can reduce a product’s defect rate and ensure that the product meets customer’s customized manufacturing needs with high standards. Moreover, it also shortens
the time of trial production and the rework time of unqualified products, reduces production costs, and ensures the product’s quality and delivery time.
In the composition process, first of all, determining the service composition strategy based on the decomposition of customer’s manufacturing requirements should be considered, specifically, the basic strategies for selecting cloud manufacturing services according to the manufacturing tasks; secondly, service-matching degree, composition harmony degree, cloud-entropy, and other problems should be addressed. Based on the above analysis, the following cloud manufacturing service composition strategies are given:
1. All manufacturing tasks must be allocated to one or more corresponding public cloud services or private cloud services to complete.
2. Manufacturing tasks that include core product technologies and need to be kept strictly confidential must be allocated to enterprise private cloud services to be completed.
3. The comprehensive optimization objective of the cloud manufacturing service composition scheme should be as close to the ideal value as possible, which is composed of service-matching degree, composition harmony degree, cloud-entropy, and so on.
Service composition according to the above strategies could provide support for the construction of a scientific and rational organization structure of the cloud manufacturing and the optimization of the use of distributed manufacturing resources.
2 MODELING CLOUD MANUFACTURING SERVICE COMPOSITION
2.1 Problem Description
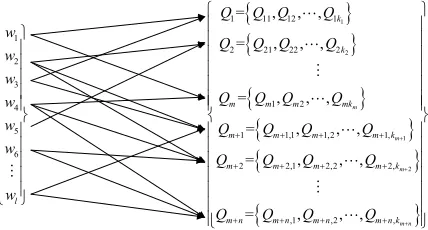
Suppose that a customized product manufacturing project can be broken down into l sub-tasks, namely W = {w1, …, wl}, it is necessary to select the
appropriate public cloud services in n public cloud service sets and enterprise private cloud services in m private cloud service sets from the cloud resource pool to complete. The m private cloud service sets are represented as Q1, …, Qm. The number of private
cloud services contained in each set is represented as k1, …, km. The ith private cloud service set is
represented as Qi= {Qi,1, …, Qi,ki}. The n public cloud
service sets are represented as Qm+1, …, Qm+n. The
number of public cloud services contained in each set is represented as km+1, …, km+n. The ith public cloud
manufacturing tasks are allocated to the most appropriate public cloud services in
∑
i mm n= ++ 1k
i and the most suitable enterprise private cloud services ink
i i m=
∑
1 to compete for the task collaboratively. The allocation relationship is shown in Fig. 1.
1 2
1 2
1 11 12 1
2 21 22 2
1 2
1 1,1 1,2 1,
2 2,1 2,2 2,
,1 ,2 ,
= , , , = , , ,
= , , ,
= , , ,
= , , ,
= , , ,
m
m
m
m n
k
k
m m m mk
m m m m k
m m m m k
m n m n m n m n k
Q Q Q Q
Q Q Q Q
Q Q Q Q
Q Q Q Q
Q Q Q Q
Q Q Q Q
1
2
3
4
5
6
l
w w w w w w
w
Fig. 1. Cloud manufacturing service composition mapping relationship
2.2 Service-Matching Degree Definition and Calculation
In cloud manufacturing, whether manufacturing services are suitable for manufacturing tasks has a significant influence on the cloud manufacturing service composition. The higher the suitability of cloud manufacturing services for manufacturing tasks, the greater the ability to control the manufacturing tasks, the better the completion quality of the manufacturing tasks. Therefore, in the process of service composition, considering the suitability of cloud manufacturing services for manufacturing tasks is of great significance, which is defined as the service-matching degree.
• Definition 1: Service-matching degree: the quantitative level of suitability of cloud manufacturing services (including private and public cloud services) for the manufacturing tasks. Many factors may affect the suitability of public and private cloud services for manufacturing tasks, such as the geographic location of manufacturing resources mapped by cloud manufacturing services, the frequency and experience of implementation of similar manufacturing tasks, the software and hardware strength of manufacturing resources mapped by cloud manufacturing services, the interest in undertaking the manufacturing tasks, and so on. The specific description is as follows: 1. Capacity factor. Capacity matrix C = (cij)(m+n)×lis
introduced to describe the manufacturing capacity of m private cloud services and n public ones. cij
(1 ≤ i ≤ m) represents the manufacturing capacity of the ith private cloud service for completing the jth manufacturing task. cij(m+1 ≤ i≤m+n)
represents the manufacturing capacity of the ith public cloud service for completing the jth manufacturing task. The value of cij is represented by a six-dimensional rank vector [0, 0.2, 0.4, 0.6, 0.8, 1], measured by technical level, project execution rate, corporate performance, the number of completed similar manufacturing tasks, and so on.
2. Desire factor. Desire factor dij(0 ≤ dij ≤ 1) is
introduced to describe the desired degree of a cloud manufacturing service to undertake and complete a manufacturing task. The higher the idle rate of manufacturing resources mapped by cloud manufacturing services, the greater the demand for manufacturing tasks, the bigger the desire factor. Thus the desire matrix D = (dij)(m+n)×l
can be constructed. dij(1 ≤ i ≤ m) represents the
desired degree of the ith private cloud service for undertaking and completing the jth manufacturing task. dij(m+1 ≤ i ≤ m+n) represents the desired
degree of the ith public cloud service for undertaking and completing the jth manufacturing task.
3. Equipment factor. Equipment factor eij is
introduced to describe the equipment level of private and public cloud services. Equipment level is divided into international advanced equipment level, domestic advanced equipment level, and general equipment level. The corresponding equipment factors in turn are expressed as eij=[0.8, 0.6, 0.4].
4. Position factor. Position factor pij is introduced to
describe the relative position between customers and manufacturing resources mapped by cloud manufacturing services. For example, if the cloud manufacturing resource is in the customer’s city, then pij=1; otherwise, pij=0.6.
Based on the above analysis, the service-matching degree matrix is established as:
V
v v
v
v v
l
ij
m n m n l
=
+ +
11 1
1 ...
...
,
, ,
(1)
where vij = α×cij+β×dij+γ×eij+δ×pij, where α, β, γ
and δ are the corresponding weighted coefficients. vij (1 ≤ i ≤ m) represents the service-matching degree of
the ith private cloud service for the jth manufacturing task. vij (m+1 ≤ i ≤ m+n) represents the
2.3 Composition Harmony Degree Definition and Calculation
In cloud manufacturing, the harmony degree between cloud manufacturing services in a service composition scheme is an easily overlooked but crucial factor. The higher the harmony degree between cloud manufacturing services, the agiler the information interaction, the smoother the material transportation, the more successful the progress of manufacturing tasks, the shorter the time to complete the tasks. In contrast, the lower the harmony degree, information interaction and material transportation between the cloud manufacturing services are hindered, the delivery time of products is extended, and the manufacturing cost is increased. Therefore, in the cloud manufacturing service composition, it is necessary to analyse the degree of harmony between the cloud manufacturing services, which is defined as composition harmony degree.
• Definition 2: Composition harmony degree: the quantitative representation of the harmony degree between private and public cloud services, which can be calculated based on execution time. For example, the composition harmony degree of the composite services for manufacturing tasks wi and wjis [29]:
h t t
t
ij i j
ij
= + ,
where tiand tjare respectively the execution times of
the manufacturing tasks wi and wj, and tijis the total
execution time of the two tasks.
The calculation of the total execution time of manufacturing tasks is closely related to the interaction between them. It is relatively simple when the manufacturing tasks are independent of each other, in serial or parallel. For coupled tasks, the calculation of the total execution time is relatively complex. Assuming that the tasks wi and wj are coupled, the
corresponding execution times are respectively ti and
tj, then the total execution time is [29]:
t
ij= + +
t t
i j2
g t t
ij i j,
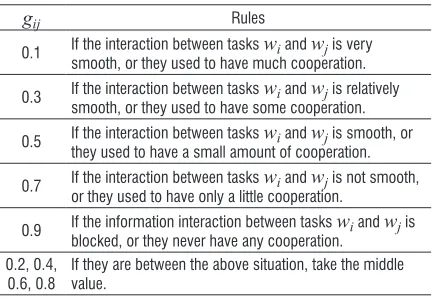
(2)where gij is the coupling coefficient between tasks
wi and wj, whose value is mainly on the basis of the
flexibility of information interaction, the patency of material transportation, the times of cooperation and the degree of tacit understanding, as shown in Table 1.
Table 1. Interaction coupling coefficient values and rules
gij Rules
0.1 If the interaction between tasks wi and wj is very
smooth, or they used to have much cooperation.
0.3 If the interaction between tasks wi and wj is relatively
smooth, or they used to have some cooperation.
0.5 If the interaction between tasks wi and wj is smooth, or
they used to have a small amount of cooperation.
0.7 If the interaction between tasks wi and wj is not smooth,
or they used to have only a little cooperation.
0.9 If the information interaction between tasks wi and wj is
blocked, or they never have any cooperation. 0.2, 0.4,
0.6, 0.8
If they are between the above situation, take the middle value.
Based on the above analysis, the composition harmony degree matrix is established as below:
H
w w w w
w w
h h
h
h h
i l
i
l
l
ii
l l l
=
1
1 11 1
1
, ,
.
(3)
2.4 Cloud-Entropy Definition and Calculation
effectiveness of the implementation, and it is used as a service composition optimization index to study the problem of cloud manufacturing service composition. According to the entropy measurement of the complexity of manufacturing system in [30], cloud-entropy for cloud manufacturing service composition is obtained as follows [30]:
EnC t
T t
T EnC EnC
i ij i
ij i j S
i i
N i
= − =
= =
∑
ln ,∑
,1 1
sum (4)
where EnCi is the cloud-entropy of the ith cloud
manufacturing service; EnCsum is the total cloud-entropy for the service composition, which reflects the complexity of the service composition scheme; si is
the total state number of the ith cloud manufacturing service; N is the total number of cloud manufacturing services in the service composition scheme; tij is
the time of the ith cloud manufacturing service in the jth state; and Ti is the total time for the ith cloud manufacturing service to complete the manufacturing task.
The starting time point of the cloud manufacturing service is that for the first operation of the cloud manufacturing service. The end time point of the cloud manufacturing service is that of the last operation of the manufacturing process. The starting time point of the workpiece is the starting time for the first process. The end time point of the workpiece is the bigger one between the end time of the process and the delivery time. To illustrate the cloud-entropy calculation, assume that an equipment manufacturing task has two candidate cloud manufacturing services. The longest continuous working time of the first candidate cloud manufacturing service is 24 hours, the maintenance time is 5 hours, and the total execution time is 66 hours. The longest continuous working time of the second candidate cloud manufacturing service is 16 hours, the maintenance time is 4 hours, and the total execution time is 66 hours. Their processing sequence is shown in Fig. 2.
R1, R2, and R3 represent the different working states of a cloud manufacturing service. M1 and M2 represent the different maintenance states of a cloud manufacturing service. The numbers above the block diagram represent the processing time. The cloud-entropy of the equipment manufacturing tasks in the corresponding cloud manufacturing services is calculated as follows:
EnC1 2
24 66
24
66 2
5 66
5 66
8 66
8
66 1 382
= − ×( ln + × ln + ln )= . ,
EnC2 3
16 66
16
66 3
4 66
4 66
6 66
6
66 1 758
= − ×( ln + × ln + ln )= . .
a)
b)
Fig. 2. Gantt charts of the candidate cloud manufacturing services; a) Gantt chart of the first candidate cloud manufacturing
service; and b) Gantt chart of the second candidate cloud manufacturing service
The cloud-entropy of the second candidate cloud manufacturing service is bigger than that of the first candidate one. The main reason is that the state transition frequency of the second service is greater than the first one. The second one is more complex and chaotic, while the first one is more orderly, which is consistent with the actual manufacturing experience. As can be seen from the above example, cloud-entropy can be used to determine the order of the cloud service composition or its complexity. The total cloud-entropy of the service composition can be obtained by summing up that of each service. In order to evaluate the complexity of the service composition, the smaller the cloud-entropy, the simpler the cloud manufacturing service composition is, the more reliable it is, the greater the probability of successful completion of the manufacturing task.
2.5 Service Composition Multi-Objective Optimization Model
The purpose of the cloud manufacturing service composition is to allocate the manufacturing tasks to the most suitable private cloud services and/or public cloud services, obtaining the biggest composition harmony degree and the smallest cloud-entropy, and meeting the production time and production cost constraints. Based on the above discussion, the mathematical model of cloud manufacturing service composition can be constructed as follows:
maxI (v xij ij),
j l
i m n
1 1 1
= ⋅
= = +
∑
∑
(5)maxI h x xij pi qj,
q k
p k
j m n
i
m n i j
2
1 1 1 1
= ⋅ ⋅
= = = +
= +
∑
∑
∑
∑
(6)maxI h x xij pi qj,
q k
p k
j m n
i
m n i j
2
1 1 1 1
= ⋅ ⋅
= = = +
= +
∑
∑
∑
s.t. max(t1, t2, ..., tl) ≤ T0 (8)
ci t y Ci i i
m n
i m n
= ⋅ ≤
= +
= +
∑
∑
1 1
0, (9)
xij i m n
= +
∑
≥1
1, (10)
where ci is the execution cost of the ith manufacturing
task; yi is the unit time cost; and xij, xpi and xqj are the
switch variables, whose values can be obtained with the following formula:
x
j
i
ij=
if the manufacturing task is
allocated to the
th
t
1, hh cloud
manufacturing service;
otherwise; 0,
.. (11)
Eq. (5) represents the maximum value of the total service-matching degree. Eq. (6) represents the maximum value of the total composition harmony degree. Eq. (7) represents the minimum value of the total cloud-entropy of service composition (namely m+n cloud services). The constraint function formula (Eq. (8)) indicates that the maximum value of the execution time of the manufacturing task must be within the allowable time T0. Eq. (9) indicates that
the maximum value of the execution cost of the manufacturing task must be within the allowable cost C0. Eq. (10) indicates that each manufacturing task must be allocated to one or more public and/or private cloud services to be performed.
3 SERVICE COMPOSITION MULTI-OBJECTIVE OPTIMIZATION ALGORITHM
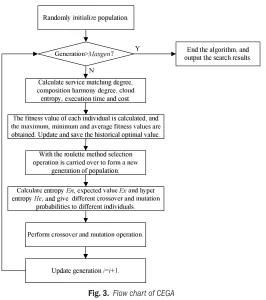
Cloud manufacturing service composition is a multi-objective composition optimization NP-Hard problem [31]. Using the traditional method, it is difficult to solve such problems and to get the optimal results quickly. Genetic algorithm (GA) is a kind of search optimization algorithm which simulates the process of biological evolution [32]. It has a strong global search capability, but the local optimization ability of genetic algorithm is poor, easy to fall into local optimum, and prone to premature convergence [33]. Thus it is necessary to improve the search quality of traditional GA and then apply it. In view of the non-linear multi-objective composition optimization characteristics of the cloud manufacturing service composition model, based on the introduction of the normal cloud model [34] to improve the traditional GA, CEGA is proposed to solve such service composition, as shown in Fig. 3.
The normal cloud model is a random set that follows the normal distribution law and has a stable tendency. It is described by the expected value Ex, the entropy En, and the hyper entropy He. Based on the random and stable tendency characteristics of the cloud particle of the normal cloud model, the crossover probability and the mutation probability of the genetic algorithm are designed. In the initial stage of the algorithm, larger crossover and mutation probabilities are set to speed up the generation of excellent individuals. In the later stage of the algorithm, smaller crossover and mutation probabilities are set. The excellent individuals with high fitness are involved in the crossover and mutation with small probabilities of protecting the excellent individuals from being damaged so that the global convergence of the algorithm is accelerated. Crossover and mutation probabilities are produced by the normal cloud model formulas. With control parameters of the normal cloud model, the adaptive adjustment is carried out when the population fitness is changed, to improve the algorithm in the search range and precision accuracy.
The adaptive generation formulas of crossover and mutation probabilities are as follows [34]:
Crossover probabilitypc
pc = k e f f
k p f f
f f p p
f Ex Enn 1
2
3
2
2 − −
≥
+ −
− −
( )
( )
min max
max min
max min
( c ( c c ))) f < f
, (12)
where Enn = Rand(n) × He + En, Ex = f , where f is the average fitness value of the population; En = (fmax–f )/C1, where C1 is the control coefficient; He = En / C2, where C2 is the control coefficient;
Mutation probabilitypm
pm = k e f f
k p f f
f f p p
f Ex Enn
2 2
4
2
2 − ′−
′ ≥
+ − ′
− −
( )
( )
min max
max min
max m
( m ( m m iin))
,
′ <
f f
(13)
where Enn = Rand(n) × He + En, Ex = f ,
En = (fmax–f )/C3, where C3 is the control coefficient; He = En / C4, where C4 is the control coefficient;
In Eqs. (12) and (13), fmax, fminand f are the maximum, minimum and average fitness values of the population respectively; f is the larger of the two crossover individual fitness values; f ' is the fitness value of the mutation individual; pcmax and pcmin respectively represent the maximum mutation and minimum crossover probabilities of the population; pmmax and pmmin respectively represent the maximum
and minimum mutation probabilities of the population; and k1, ..., k4 are constants of [0,1] with k1 = k2 = 0.5, and k3 = k4 = 1.
According to Eqs. (12) and (13), the initial values of pc and pm are larger, but gradually reduced with the continuous evolution of the population. In the same generation, different individuals have different crossover and mutation probabilities. The individuals with high fitness value should be protected, and their crossover and mutation probabilities are reduced. The individuals with low fitness value should increase their crossover and mutation probabilities. Therefore, each individual in each generation has different crossover and mutation probabilities, so as to realize the adaptive crossover and mutation.
Entropy En, expected value Ex, hyper entropy He and standard deviation Enn are important control parameters of the normal cloud model. Among them, the value of standard deviation Enn is mainly affected by the two parameters of entropy En and hyper entropy He. Entropy En reflects the steepness of the cloud model; expected value Ex reflects the horizontal position of the cloud model; hyper entropy He reflects the cloud particle discrete degree [34]. Cloud particles fluctuate near the expected value, and the fluctuation degree is controlled by He. The stability of the normal cloud model is decreased when the hyper entropy He is too large, and the randomness of the normal cloud model is declined when the hyper entropy He is too small. The algorithm ensures that the best individuals around the maximum fitness value maintain the stable tendency of a normal cloud model, improving the search ability of the individual with a lower fitness value, thus, producing new individuals in larger space, improving the randomness of the algorithm effectively, and restraining premature convergence. The specific steps of the cloud-entropy genetic algorithm are discussed as follows.
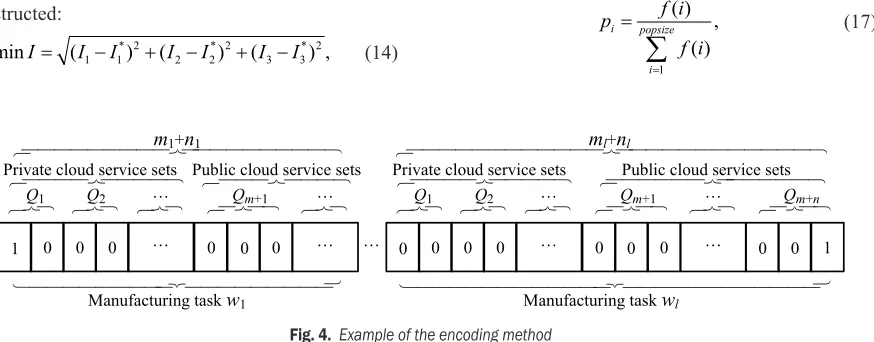
3.1 Encoding Strategy
The algorithm uses a binary encoding method, in which each chromosome is divided into l segments, and each gene segment represents a manufacturing task. Assuming that the number of the candidate public cloud services to complete the ith manufacturing task is ni, and that of the candidate private ones to
complete the ith manufacturing task is mi, then the total number of the candidate cloud manufacturing services to complete the ith manufacturing task is mi+ni. In encoding, the genetic value of 0 indicates
services; whereas the genetic value of 1 indicates that the manufacturing task corresponding to the gene segment is allocated to a public/ private cloud service. Such encoding can also be used to decode the chromosome.
An example of such encoding is given in Fig. 4, which indicates that the manufacturing task w1 is allocated to the first service of the private cloud service set Q1 with a genetic value of 1. In the same segment, the other genetic values corresponding to the other candidate cloud services are 0. Similarly, the manufacturing task wl is allocated to the third service
of the public cloud service set Qm+n.
3.2 Fitness Function
Cloud manufacturing service composition is a non-linear and multi-objective optimization problem, and there is a certain link among multiple objectives. It is difficult to directly give the optimal value of such a multi-objective optimization problem, but the ideal positive point (i.e. the most desired value) and the ideal negative point (i.e. the least expected value) of the single objective can be given easily. Therefore, it is more appropriate to choose the ideal point method to construct the fitness function in the cloud-entropy genetic algorithm.
The ideal point method is based on the distance between the objective function value and the ideal point to evaluate the advantages and disadvantages of the composition service scheme. The smaller the distance, the better the scheme. The ideal point is composed of the ideal value of each objective function. The ideal value can be specified by the decision maker, and also can be obtained from the single objective optimal value. According to the above analysis, the evaluation function of the cloud manufacturing service composition problem can be constructed:
minI= (I I1− 1*) +(I −I*) +(I −I*) , 2 2 2 2 3 3 2 (14)
where (I I I1 2 3
* * *
, , ) is the ideal point, which is composed
of the optimal values of three single objective functions. (I1, I2, I3) is the objective function value of the cloud manufacturing service composition. I is the distance between objective function value of the cloud manufacturing service composition and the ideal point, namely deviation.
The quantity level and the important degree of the objective functions I1, I2 and I3 are not the same, so they should be dealt with dimensionless correction and be distinguished with weight coefficients. Thus the evaluation function can be modified as follows:
min ( ) ( ) ( ) ,
* * * * * * ′ = − + − + −
I I I
I
I I
I
I I
I
ε1 ε ε
1 1 1 2 2 2 2 2 2 3 3 3 3 2 (15)
where ε1, ε2 and ε3 are the weight coefficients of the objective functions, and ε1 + ε2 + ε3 = 1. Their values can be determined by the expert evaluation.
According to the above analysis, the fitness function of CEGA is constructed as:
f i U I I I
I I I
I I I
i i i
( ) ( ) ( ) ( ) , * * * * * *
= − ε1 − +ε − +ε −
1 1 1 2 2 2 2 2 2 3 3 3 3
2 (16)
where f(i) is the fitness function of the ith chromosome;
Ii
1, I2i and I3i are the objective function values
corresponding to the ith chromosome; and U is a positive and sufficiently large number.
3.3 Selection Operation
The roulette method is adopted to perform the selection operation. According to its fitness, each generation has the corresponding probability to be copied to the next generation. Given that the population size is popsize, and the fitness of the individual is f(i), then the selection probability to be copied to the next generation can be calculated as follows.
p f i
f i i i popsize = =
∑
( ) ( ) , 1 (17) 1Qm+n
0 0 0 0
1 0
Manufacturing task w1
Private cloud service sets
m1+n1
0 Q1
Public cloud service sets
Qm+1
Q2
0 0 0 0
0 0
Manufacturing task wl
Private cloud service sets
ml+nl
0 Q1
Public cloud service sets
Qm+1
Q2
0 0
3.4 Crossover Operation
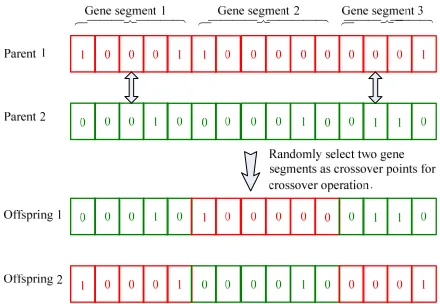
The crossover probability pc of the population is calculated by Eq. (12), and the expected value Ex, entropy En, and hyper entropy He of the crossover operator are calculated. Produce two parent individuals by the normal cloud model. The operation method called “double crossover points” is adopted; this is randomly selecting two gene segments as crossover points, exchanging gene encodes of the crossover points between the first parent individual and the second parent individual, the unchosen gene encodings remaining the same; thus, two offspring individuals are produced. The crossover operation is shown in Fig. 5.
Fig. 5. Crossover operation
3.5 Mutation Operation
Calculate the mutation probability pm of the population according to Eq. (13), the expected value Ex, entropy En, and hyper entropy He of the mutation operator. Produce a new individual by the normal cloud model. When pm is bigger than the given threshold, randomly select a gene segment in the chromosome, one of encoded gene in the selected gene segment is set to 1, the others in the same gene segment are set to 0, then a new chromosome is produced. The mutation operation is shown in Fig. 6.
CEGA randomly generates an initial population, repeats steps (Sections) 3.2 to 3.5 until the maximum generation equals the setting value 150 (i.e. maxgen=150) or other termination conditions of the algorithm occur, and outputs the optimal results.
Fig. 6. Mutation operation
4 APPLICATION EXAMPLE
A company in Foshan city has built two manufacturing workshops. A private cloud service platform is built inside the enterprise for sharing the equipment, raw materials and other manufacturing resources for the internal manufacturing departments. The manufacturing tasks of the enterprise are synergistically implemented by the internal manufacturing resources (i.e. the enterprise private cloud services) and the external manufacturing resources (i.e. the public cloud services). Take the production of five sets of Automatic Guided Vehicles (AGVs) as an example to illustrate the specific application of the proposed cloud manufacturing service composition optimization algorithm.
The manufacturing task of the AGV can be divided into six sub-tasks: car body task w1, driving device task w2, auxiliary equipment task w3, power supply system task w4, auxiliary control system task w5 and main control system task w6. All of the sub-tasks are allocated according to the proposed CEGA.
The available public cloud service sets for the allocation of the manufacturing tasks w1, w2, w3, w4, and w5 are Q1, Q2, Q3, Q4, and Q5, respectively. The numbers of public cloud services contained in the five sets are 3, 3, 4, 2 and 2, respectively. The manufacturing task w6 involves the core technology of the enterprise with a high level of confidentiality, and must be implemented by the enterprise private cloud service set Q6, which contains two private cloud services. In summary, the six manufacturing tasks w1, w2, w3, w4, w5, and w6 are allocated to 14 public cloud services and two private cloud services.
Capacity factor vector:
C = [0.6, 0.2, 0.6, 0.2, 0.4, 0.6, 0.8, 0.6, 0.4, 0.2, 0.2, 0.6, 0.8, 0.2, 0.6, 0.8] Desire factor vector:
D = [0.7, 0.6, 0.6, 0.8, 0.7, 0.6, 0.5, 0.8, 0.8, 0.9, 0.7, 0.8, 0.7, 0.8, 0.8, 0.7] Equipment factor vector:
E = [0.6, 0.6, 0.4, 0.4, 0.6, 0.6, 0.6, 0.4, 0.6, 0.6, 0.4, 0.6, 0.4, 0.6, 0.8, 0.6]
Position factor vector:
P = [1, 0.6, 1, 0.6, 1, 1, 1, 0.6, 1, 1, 1, 0.6, 0.6, 1, 1, 1]. Set α = 0.3, β = 0.2, γ = 0.2, and δ = 0.3, and then the service-matching degree vector can be obtained: V = [0.74, 0.44, 0.68, 0.48, 0.68, 0.72, 0.76, 0.60,
0.70, 0.66, 0.58, 0.64, 0.64, 0.64, 0.80, 0.80]. The execution time [hour] of each task is represented by a vector as follows:
texe= [73, 70, 68, 75, 70, 60, 70, 85, 90, 88, 52, 54, 48, 60, 63, 58].
The maximum continuous working time [hour] and the maintenance time [hour] are expressed as follows:
tcon=[16, 20, 16, 20, 24, 30, 20, 18, 16, 24, 20, 30, 40, 24, 22, 24];
trep= [2, 3, 2, 2, 3, 1.5, 3, 2, 1, 2, 2, 1, 3, 1.5, 2, 1]. The unit time cost [€ per hour] is expressed as follows:
y = [37, 61, 47, 28, 43, 57, 47, 67, 31, 59, 45, 41, 46, 43, 49, 51].
The composition harmony degree matrix of the manufacturing task can be obtained according to the definition of the composition harmony degree.
H
w w w w w w w w w w w w
h h h h h h
h h h h h
=
1 2 3 4 5 6
1 2 3 4 5 6
11 12 13 14 15 16
21 22 23 24 255 26
31 32 33 34 35 36
41 42 43 44 45 46
51 52 53 54 55 5
h
h h h h h h
h h h h h h
h h h h h h66
61 62 63 64 65 66
h h h h h h
,
The matrix is a symmetric one, whose diagonal elements h11, h22, …, and h66 are 1. h12 represents the composition harmony degree of three candidate cloud manufacturing services for manufacturing task w1 and three for manufacturing task w2. Other elements of the matrix are similar to h12. Their values can be calculated as follows:
h12
0 769 0 667 0 589
0 588 0 667 0 770
0 667 0 626 0 910
= . . . . . . . . . , h13
1 000 0 589 0 668 0 770
0 625 0 834 0 557 0 770
0 909 0 528 0 62
=
. . . .
. . . .
. . . 77 0 716.
, h14
0 835 0 628
0 669 0 771
0 627 0 668
= . . . . . .
, h15
0 594 0 770
0 671 0 834
0 670 0 770
= . . . . . . , h16
0 770 0 834
0 909 0 770
0 909 0 909
= . . . . . . , h23
0 667 0 625 0 589 0 527
0 769 0 668 0 590 0 627
0 770 0 592 0 67
=
. . . .
. . . .
. . . 11 0 671.
, h24
0 772 0 591
0 669 0 669
0 589 0 770
= . . . . . .
, h25
0 774 0 716
0 593 0 626
0 834 0 667
= . . . . . . , h26
0 834 0 910
0 910 0 770
0 910 0 910
= . . . . . .
, h34
0 717 0 590
0 673 0 672
0 776 0 633
0 535 0 774
= . . . . . . . . , h35
0 593 0 770
0 676 0 670
0 568 0 836
0 777 0 593
= . . . . . . . .
, h36
0 910 0 770
0 771 0 911
0 836 0 837
0 910 0 911
= . . . . . . . . , h45
0 625 0 589
0 715 0 556
= . .
. . , h46
0 770 0 834
0 910 0 833
= . . . . , h56
0 910 0 834
0 769 0 910
= . . . . .
The cloud-entropy vector of the manufacturing task can be obtained according to the definition of cloud-entropy and Eq. (4):
EnC=[1.784, 1.539, 1.658, 1.602, 1.341, 1.622, 1.539, 1.658, 1.946, 1.482, 1.274, 0.764, 0.561, 1.202, 1.307, 1.144].
The delivery time constraint is 480, and the cost constraint is 100000. Specifically, max(t1, t2, ..., t6) ≤ 480 and
∑
i=1ci =∑
i=t yi⋅ ≤i16
1 16
100000.
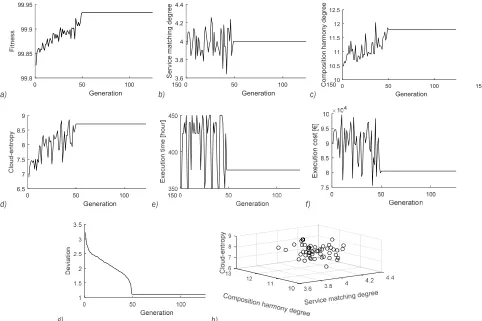
optimal function is (4.30, 12.768, 9.135). After 48 iterations of the CEGA, the optimal fitness value of the population is 99.934, the service-matching degree is 4, the composition harmony degree is 11.799, the cloud-entropy is 8.708, the delivery time is 375, the cost is 80490, the chromosome encoding of the optimal solution is 1001001000100110, and the distance between the optimal objective function value and the ideal point is 1.101. The chromosome encoding of the optimal solution is shown in Fig. 7, where manufacturing task w1 is allocated to the first cloud service of the public cloud service set Q1; task w2 to the first cloud service of the public cloud service set Q2; task w3 to the first cloud service of the public cloud service set Q3; task w4 to the first cloud service of the public cloud service set Q4; task w5 to the second cloud service of the public cloud service set Q5; and task w6 to the first cloud service of the private cloud service set Q6. The average running time of the algorithm is 11.63 s, and the evolution curves of CEGA are shown in Fig. 8. Fig. 8a) shows the optimal
individual fitness value evolution curve, Fig. 8b the service-matching degree evolution curve, Fig. 8c the composition harmony degree evolution curve, Fig. 8d the cloud-entropy evolution curve, Fig. 8e the execution time evolution curve, Fig. 8f the execution cost evolution curve, Fig. 8g the deviation evolution curve and Fig. 8h the three-dimensional scatter diagram of CEGA solution process. The population tends to be stable when it evolves to the forty-eighth generation.
Fig. 7. The optimal solution of the AGV manufacturing task
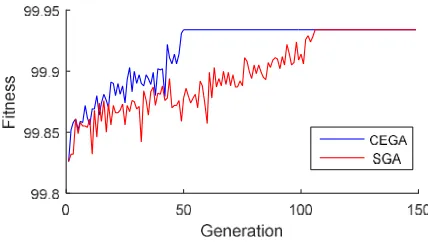
Fig. 9 shows the evolution curves of the proposed CEGA and Standard Genetic Algorithm (SGA) under the same conditions. As can be seen from the figure, CEGA converges to the optimal solution of
a) 0 50Generation100 150
99.8 99.85 99.9 99.95
b) 0 50 Generation100 150
3.6 3.8 4 4.2 4.4
c) 0 50 Generation100 150
C
om
po
si
tion
h
ar
m
on
y
deg
re
e
10 10.5 11 11.5 12 12.5
d) 0 50 Generation100 150
6.5 7 7.5 8 8.5 9
e) f)
g) h)
Fig. 8. CEGA evolution curves; a) the optimal individual fitness value evolution curve; b) the service-matching degree evolution curve; c) the composition harmony degree evolution curve; d) the cloud-entropy evolution curve; e) the execution time evolution curve; f) the execution cost
the problem after 48 generations, and SGA converges after 106 generations. On the same computer with Intel Core i3-3110M, 2.4 GHz CPU, and 4G memory, CEGA takes 11.63 s, and SGA 19.34 s. Thus, in the solution of cloud manufacturing service composition, CEGA converges faster than SGA does.
Fig. 9. Comparison of CEGA and SGA evolution curves
5 CONCLUSION
In order to optimize the allocation of cloud manufacturing resources and improve the execution efficiency of cloud manufacturing service composition, research on the cloud manufacturing service composition optimization problem has been done with the following contributions:
1. Service-matching degree, composition harmony degree and cloud-entropy are defined, and the corresponding calculation methods are given, which broadens the scope of the influence factor set of cloud manufacturing service composition optimization.
2. The mathematical model of cloud manufacturing service composition optimization is built, which takes the service-matching degree, composition harmony degree and cloud-entropy as the multi-objective functions with the execution time, execution cost, and so on as the constraints. 3. On the introduction of the theory of a normal
cloud model to improve the traditional genetic algorithm, a so-called CEGA is proposed to solve the mathematical model of cloud manufacturing service composition with multi-objectives and further verified by taking the task of AGV manufacturing as an example of its feasibility and effectiveness.
Cloud manufacturing service composition optimization is a complex problem, which has many influence factors such as the service-matching degree, the composition harmony degree and the cloud-entropy as studied in this paper. Further research can include other influence factors and algorithms.
6 ACKNOWLEDGEMENTS
The project was supported by the National Natural Science Foundation of China (51175187, and 51375168), the Science & Technology Foundation of Guangdong Province (2015A020220004, 2016B090918035 and 2016A020228005), and the Science & Technology Foundation of Zhanjiang City (2015A01001). The authors would like to thank the editors and anonymous reviewers for their constructive and helpful comments which helped to improve the presentation of the paper.
7 REFERENCES
[1] Jo, M., Maksymyuk, T., Strykhalyuk, B., Cho, C.H. (2015). Device-to-device-based heterogeneous radio access network architecture for mobile cloud computing. IEEE Wireless Communications, vol. 22, no. 3, p. 50-58, DOI:10.1109/ MWC.2015.7143326.
[2] Chun, S.-M., Kim, H.-S., Park, J.-T. (2015). CoAP-based mobility management for the internet of things. Sensors, vol. 15, no. 7, p. 16060-16082, DOI:10.3390/s150716060.
[3] Li, Y.X., Yao, X.F., Xu, X.M., Jin, H. (2014). Formal verification of cloud manufacturing service composition and BPEL codes generation based on extended process calculus. Information Technology Journal, vol. 13, no. 11, p. 1779-1785, DOI:10.3923/itj.2014.1779.1785.
[4] Li, B.-H., Zhang, L., Wang, S.-L., Tao, F., Cao, J.-W., Jiang, X.-D., Song, X., Chai, X.-D. (2010). Cloud manufacturing: a new service-oriented networked manufacturing model. Computer Integrated Manufacturing Systems, vol. 16, no. 1, p. 1-7. [5] Tao, F., LaiLi, Y.J., Xu, L.D., Zhang, L. (2013). FC-PACO-RM: A
parallel method for service composition optimal-selection in cloud manufacturing system. IEEE Transactions on Industrial Informatics, vol. 9, no. 4, p. 2023-2033, DOI:10.1109/ TII.2012.2232936.
[6] Omid, F.V., Mahmoud, H. (2014). A platform for optimization in distributed manufacturing enterprises based on cloud manufacturing paradigm. International Journal of Computer Integrated Manufacturing, vol. 27, no. 11, p. 1031-1054, DOI:10.1080/0951192X.2013.874582.
[7] Dantas, J., Matos, R., Araujo, J., Maciel, P. (2015). Eucalyptus-based private clouds: availability modeling and comparison to the cost of a public cloud. Computing, vol. 97, no. 11, p. 1121-1140, DOI:10.1007/s00607-015-0447-8.
[8] Hu, J.L., Den, J.B., Wu, J.B. (2013). A green private cloud architecture with global collaboration. Telecommunication Systems, vol. 52, no. 2, p. 1269-1279, DOI:10.1007/s11235-011-9639-5.
[10] Jeong, H.Y., Lee, Y.S. (2012). CSP based web service composition model with buffer at the business logic process level. Journal of Internet Technology, vol. 13, no. 3, p. 501-508, DOI:10.6138/JIT.2012.501.508.
[11] Castejón, C., Carbone, G., García-Prada, J.C., Ceccarelli, M. (2010). A multi-objective optimization of a robotic arm for service tasks. Strojniški vestnik - Journal of Mechanical Engineering, vol. 56, no. 5, p. 316-329.
[12] Jovanovic, J.R., Milanovic, D.D., Djukic, R.D. (2014). Manufacturing cycle time analysis and scheduling to optimize its duration. Strojniški vestnik - Journal of Mechanical Engineering, vol. 60, no. 7-8, p. 512-524, DOI:10.5545/sv-jme.2013.1523.
[13] Gaaloul, W., Baïna, K., Godart, C. (2008). Log-based mining techniques applied to web service composition reengineering. Service Oriented Computing and Application, vol. 2, no. 2, p. 93-110, DOI:10.1007/s11761-008-0023-6.
[14] Stegaru, G., Stanescu, A.M. (2015). Towards quality driven web service composition. UPB Scientific Bullintin, Series C: Electrical Engineering, vol. 77, no. 2, p. 43-54.
[15] Omid, M., Safi-Esfahani, F., Nadimi-Shahraki, M.-H. (2014). A framework for context-aware web service composition using planning techniques. Multiagent and Grid Systems, vol. 10, no. 4, p. 185-197, DOI:10.3233/MGS-140222.
[16] Iordache, R., Moldoveanu, F. (2015). An end to end web service composition based on QoS preferences. UPB Scientific Bullintin Series C: Electrical Engineering, vol. 77, no. 3, p. 3-16.
[17] Berlec, T., Kusar, J., Zerovnik, J., Starbek, M. (2014). Optimization of a product batch quantity. Strojniški vestnik - Journal of Mechanical Engineering, vol. 60, no. 1, p. 35-42, DOI:10.5545/sv-jme.2013.1009.
[18] Avitabile, P., Nonis, C., Obando, S.E. (2014). System model modes developed from expansion of uncoupled component dynamic data. Strojniški vestnik - Journal of Mechanical Engineering, vol. 60, no. 5, p. 287-297, DOI:10.5545/sv-jme.2014.1829.
[19] Florjanič, B., Govekar, E., Kuzman, K. (2013). Neural network-based model for supporting the expert driven project estimation process in mold manufacturing. Strojniški vestnik - Journal of Mechanical Engineering, vol. 59, no. 1, p. 3-13, DOI:10.5545/sv-jme.2012.747.
[20] Suzić, N., Stevanov, B., Ćosić, I., Anišić, Z., Sremčev, N. (2012). Customizing products through application of group technology: a case study of furniture manufacturing. Strojniški vestnik - Journal of Mechanical Engineering, vol. 58, no. 12, p. 724-731, DOI:10.5545/sv-jme.2012.708.
[21] Chifu, V.R., Salomie, I., Pop, C.B., Niculici, A.N., Suia, D.S. (2014). Exploring the selection of the optimal web service composition through ant colony optimization. Computing and Informatics, vol. 33, no. 5, p. 1047-1064.
[22] Xiao, Y.Y., Li, B.H., Zhuang, C.H., Lin, T.Y. (2015). Distributed supply scheduling oriented to multi-variety customization.
Computer Integrated Manufacturing Systems, vol. 21, no. 10, p. 800-812, DOI:10.13196/j.cims.2015.03.025.
[23] Dong, Y.F., Guo, G. (2014). Evaluation and selection approach for cloud manufacturing service based on template and global trust degree. Computer Integrated Manufacturing Systems, vol. 20, no. 1, p. 207-214, DOI:10.13196/j.cims.2014.01. dongyuanfa.0207.8.20140126.
[24] Jing, S.K., Jiang, H., Xu, W.T, Zhou, J.T. (2014). Cloud manufacturing service composition considering execution reliability. Journal of Computer-Aided Design & Computer Graphics, vol. 26, no. 3, p. 392-400.
[25] Zhao, N., Niu, Z.W., Guo, W. (2012). Quantum harmony search method for design knowledge resource serialization combination in cloud manufacturing environment. Computer Integrated Manufacturing Systems, vol. 18, no. 7, p. 1435-1443.
[26] Bao, J.P, Song, N., Tao, B. (2013). A knowledge-based service composition algorithm. Journal of Xi’an Jiaotong University, vol. 47, no. 8, p. 1-6+67.
[27] Yao, X.F., Lian, Z.T., Li, Y.X., Jin, H., Xu, C., Tan, W., Zhang, J., Lin, Y. (2012). Service-oriented architecture and integrated development environment for cloud manufacturing. Computer Integrated Manufacturing Systems, vol. 18, no. 10, p. 2312-2321.
[28] Huang, B.Q., Li, C.H., Tao, F. (2013). A chaos control optimal algorithm for QoS-based service composition selection in cloud manufacturing system. Enterprise Information Systems, vol. 8, no. 4, p. 445-463, DOI:10.1080/17517575.2013.7923 96.
[29] Bao, B.F., Yang, Y., Li, L.T., Li, F., Liu, A.J., Liu, N. (2014). Multi-objective optimization for task allocation of product customization collaborative development. Computer Integrated Manufacturing Systems, vol. 20, no. 4, p. 739-746, DOI:10.13196/j.cims.2014.04.baobeifang.0739.8.2014042. [30] Chen, Y.J., Yao, X.F., Xu, D.L. (2010). Job shop scheduling
with profit and entropy as performance measures. Journal of Beijing University of Technology, vol. 36, no. 10, p. 1305-1311.
[31] Zhang, F., Cao, J.W., Hwang, K., Li, K., Khan, S.U. (2015). Adaptive workflow scheduling on cloud computing platforms with iterativeOrdinal optimization. IEEE Transactions on Cloud Computing, vol. 3, no. 2, p. 156-168, DOI:10.1109/ TCC.2014.2350490.
[32] Ueda, Y., Horio, K., Kubota, R. (2014). A modified real-coded genetic algorithm considering with fitness-based variability. International Journal of Innovative Computing, Information and Control, vol. 10, no. 4, p. 156-168.
[33] Lin, C.C. (2012). Hierarchical path planning for manipulators based on genetic algorithm with non-random initial population. International Journal of Innovative Computing, Information and Control, vol. 8, no. 3, p. 1773-1786.