Journal of Plant Molecular Breeding (2015), 3(2): 36-43
---
*
Corresponding Author (): ebrahimi_mpn@yahoo.com Received: 14 August 2015/ Revised: 25 October 2015 Accepted: 21 November 2015Determination of genetic uniformity in transgenic cotton plants using
DNA markers (RAPD and ISSR) and SDS-PAGE
Mohammad-Ali Ebrahimi
1*, Masoud Tohidfar
2,3, Mahsa Karimi
1and Fatehmeh Zawarei
31Department of Agricultural Biotechnology, Payame Noor University, Tehran, Iran
2Department of Biotechnology, Faculty of New Technologies and Energy Engineering, Shahid Beheshti University, Tehran, Iran
3Agricultural Biotechnology Research Institute of Iran, Karaj, Iran
ABSTRACT:
One concern about using transgenic plants is the Un-uniformity that derived from somaclonal variation molecular markers play an important role in the efficient and effective determination of genetic variation. The present work was carried out to assess the genetic uniformity of transgenic cottons (Bt and chitinase lines), using RAPD, ISSR molecular markers and SDS-PAGE analysis. Similarity matrix for RAPD marker based on Nei and Li’s coefficient revealed that p-values for pairwise comparisons between Bt and chitinase cottons and their conventional counterpart plant were 93% and 95% respectively. Also, similarity matrix for ISSR marker revealed that p-values for pairwise comparisons between Bt and chitinase lines and their conventional counterpart were 94% and 96% respectively. Pairwise similarity coefficient among two transgenic plants and their conventional counterparts ranged from 0.94 to 0.99 SDS-protein patterns exhibiting four major bands. Also, molecular weight ranged from 10 KD to 35 KD. Similarity matrix for protein patterns revealed that pairwise value between Bt and chitinase lines and their conventional counterpart was 100%. All protein bands of three cultivars were the same and no polymorphic bands were detected. Pairwise similarity coefficient among two transgenic plants and their conventional counterpart ranged from 0.94 to 0.99. These lines could be used for more in-depth evaluation and new ways of commercializing biosafety studies can be proposed.KEYWORDS:Genetic uniformity, ISSR, RAPD, SDS-PAGE, Transgenic cotton plants
INTRODUCTION
In recent years, genetic engineering of plants has resulted in the development of plants with desirable agronomic traits. Molecular analysis can be used to assess alternative transformation strategies to determine the risk of somaclonal variation in transgenic plants. Genetic variation resulting from in vitro culture is termed somaclonal variation and often arises as a manifestation of permanent somaclonal variability or transient epigenetic alterations (11). Application of selection
pressure during tissue culture has led to the development of somaclones resistant to biotic and abiotic stresses (4). Somaclonal variation in tissue culture of plant cells have been reported in numerous studies, such as cabbage (18), tomato (30), rice (1), kiwifruit (23) and pineapple (29) to name a few.
37 Journal of Plant Molecular Breeding (2015), 3(2): 36-43
these genetic modifications is the possible occurrence of unintended effects; for example, the interruption of important open reading frames or regulatory sequences can result in modified metabolism, novel fusion proteins or other pleiotropic effects that may compromise product safety (9).
By the end of the year 2015, more than 181 million ha were under the cultivation of transgenic plants. One of the main concerns about transgenic plants is their safety (8). Detecting genetic uniformity of transgenic plants is one of the purposes criteria of their safety assessment Several methods have been developed for the detection of somaclonal variants. Some of the techniques are: phenotypic detection by analysing qualitative and quantitative traits of clones; numerical and structural chromosomal change; changes in protein/isozyme electrophoretic patterns; changes in nuclear genome; the use of molecular markers; the use of ribosomal DNA and the use of single copy genes or analysing changes in organellar genomes (26). Results obtained from many studies have demonstrated that callus induction and regeneration might be responsible for chromosomal aberration and genetic changes (27). DNA markers such as RAPD and ISSR have been widely used for linkage map and diversity studies (3, 21). Genetic stability assessed by RAPD and ISSR markers showed that almond plantlets micropropagated by axillary branching were uniform to the mother plant (19).
ISSRs have also been used to generate species specific, gene specific and trait specific markers. While delineating the phylogenetic relationship among different species of the genus Oryza, 87 putative genome/ species specific markers were identified (13). The 582 bp inter-SSR
Festuca specific sequence and 1350 bp F. arundinacea
specific sequence have potential as markers to confirm presence of closely linked Festuca genes (24, 25). Among biochemical techniques, Sodium Dodecyl Sulphate Polyacrylamide Gel Electrophoresis (SDS-PAGE) is most widely implemented used for describing genetic structure of crop germplasm due to its validity and simplicity (28). For verifying the genetic similarity in transgenic plants, proteomic changes should be identified and detected. In contrast to the genome, the proteome is not static but rather responsive to many internal and external factors (32). Seed storage proteins have also been recommended as reliable genetic markers for characterizing wheat varieties based on bread-making quality (10). The genetic variation of seed protein was assayed by SDS-PAGE for 19 genotypes of soybean (Glycine max). On the basis of
SDS-PAGE, 20 reproducible bands were used for analysis and genetic diversity was estimated based on the number of different protein peptides. Ten major bands were recorded out of 20 bands detected, while 60% of total were polymorphic. The SDS-PAGE which was used in this study showed good genetic diversity between genotypes. In the present study, we have used RAPD, ISSR, and SDS-PAGE analyses to compare the genetic uniformity of transgenic cotton expressing cry1Ab and chitinase genes with their conventional counterparts.
MATERIALS AND METHODS
The transgenic cotton seeds (Three seeds for each sample pooled) were grown in the greenhouse condition of 25˚C temperature with suitable light and moisture. The plants were displaced every day for having invariant conditions. Leave samples were taken in triplicate from the fourth apical buds. Leaves from three varieties of cotton including two T2 transgenic cotton Bt line #61, chitinaseline #57 (31,32) and anon-transgenic cultivars conventional counterpart were used as plant materials.
RAPD and ISSR analyses
DNA was extracted from fresh leaves using the CTAB method (9). The amplifications were carried out in a 20 μl PCR buffer containing 25 ng of genomic DNA as the template, 1X PCR buffer (Fermentas), 200 µM dNTPs (Fermentas), 1 unit of TaqDNA polymerase (Fermentas) and 10 pM of each primer with 2.5 mM of MgCl2 (Fermentas). PCR was performed at initial denaturation at 94ºC for 4 min followed by 35 cycles of 1 min denaturation at 94ºC, 1 min annealing at 42ºC for RAPD, 1 min annealing at 53, 55, 59ºC for ISSR and 1 min extension at 72ºC with a final extension of 72ºC for 5 min using a thermal cycler (Bio Rad Thermalcycler). In the present study, 16 primers were used for RAPD and 17 primers were used for ISSR. PCR products were analyzed in 1% agarose gel in 1xTAE buffer and gels were photographed under UV light.
Electrophoretic DNA bands of low visual intensity that could not be readily distinguished as present or absent were considered ambiguous markers and were not scored. Also, DNA fragment profile was scored as “0” indicating absence and “1” indicating presence of the band.
Journal of Plant Molecular Breeding (2015), 3(2): 36-43 38
(SIMQUAL) format of NTSYS-pc version 2.02e (numerical taxonomy and multivariate analysis system) software package .Nei & Li (NL) coefficient (22) was used to score the DNA polymorphisms. All the strain profiles were compared by calculation of the NL coefficient (Nei and Li, 1979): NL=2a /(b+c), where a is the number of similar bands from two strains, and b and c
are the total number of bands from each strain. The NL coefficient to allows a value of the similarity between two strains. This analysis provided interesting data about the genomic distance between different strains. The NL coefficient was used because it is recommended for routine computation of genetic similarities using data (16,17).
Phylogenetic trees
The amplified bands of two independent replicates were scored for their presence (1) or absence (0). The genetic relationship among the accessions was evaluated with phylogenetic trees constructed by UPGMA, performed to show the multiple distributions by the NTSYS-pc version 2.10 computer program package. The similarity was estimated using Dice's coefficient, also known as the similarity coefficient of Nei and Li (1979).
Protein Extraction
Triplicate tissue samples were grounded in liquid nitrogen and suspended in 10% w/v TCA in acetone with 0.07% w/v DTT at -20˚C for 1h, followed by centrifugation for 15 min at 35000 g. The pellets were washed with ice-cold acetone containing 0.07% DTT, incubated at -20˚C for 1h and centrifuged again at 4˚C. This step was repeated three times and then pellets were lyophilized.
The sample powder was then solubilized in lysis buffer (9.5 M urea, 2% w/v CHAPS, 0.8% w/v Pharmalyte pH 3-10, 1% w/v DTT). Finally, the protein concentration was determined by the Bradford assay (Bio-Rad, 1976) supplemented by BSA as the standard and equal volume of 2x protein sample buffer (150 mM Tris-HCl, pH 6.8, 1.2% SDS, 15%b-mercaptoethanol, 1.8 mg bromophenol blue and 30% glycerol) . Protein samples were boiled at 95˚C for 5 min, briefly centrifuged and analyzed on 12% SDS-PAGE.
After staining and distaining the gels (32), depending upon the presence or absence of polypeptide bands, the similarity index based on Nie and Li’s was calculated. The number of monomorphic and polymorphic protein bands was counted for each sample. The presence (1) or
absence (0) of polypeptide bands was entered in a binary data matrix for use in cluster analysis.
Result and discussion
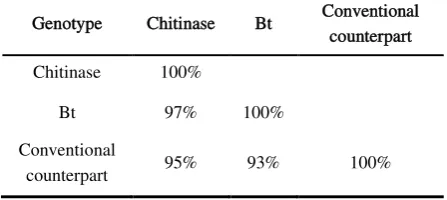
Molecular markers have been used successfully to determine the degree of relatedness among individuals or group of accessions to clarify the genetic structure or variation among accessions, population, varieties and species. In the present study, analysis of DNA using RAPD markers approved to be an effective and rapid technique for assessing the genetic similarity of cotton plants. Similarity matrix was generated from data on NTSYS 2.02e using Nei and Li’s coefficient of 16 RAPD primers tested; only 7 resulted in separated and identifiable bands on agarose gels. There was an average of 6.0 bands per primer. A total of 39 scorable markers were resolved. Out of which 31 were found monomorphic and 8 bands were polymorphic of sixteen primers. Also, out of which seven primers exhibited identical RAPD profiles between two transgenic plants and their conventional counterpart. Also, seven primers showed differences between two transgenic plants (Bt and chitinase) and their conventional counterpart. Similarity matrix for DNA amplified bands based on Nei and Li’s coefficient revealed that p-values for pairwise comparisons between, Bt, chitinase lines and their conventional counterpart were 93% and 95%, respectively (Table 1).
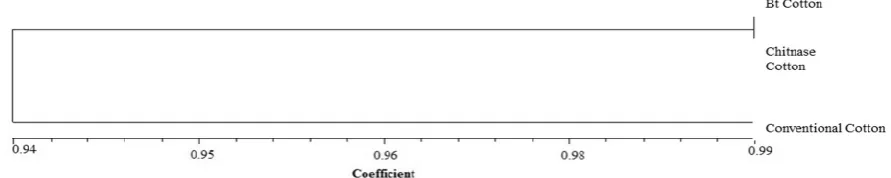
Pairwise similarity coefficient among two transgenic plants and their conventional counterpart ranged from 0.94 to 0.99. In this study, more than 93% similarity was obtained from all the samples analyzed. The cluster of the constructed dendrogram based on UPGMA contained two major groups. The first group contained two Bt transgenic varieties and chitinase lines, which showed very close RAPD profile which is shown in Figure 1 and exhibited the highest (0.97) genetic similarity (Figure 2).
Table 1.Similarity matrix of two transgenic cottons and their conventional counterpart based on RAPD marker.
Genotype Chitinase Bt Conventional counterpart
Chitinase 100%
Bt 97% 100%
Conventional
39 Journal of Plant Molecular Breeding (2015), 3(2): 36-43
Figure 1.RAPD analysis demonstrating polymorphisms among Conventional counterpart cotton (CC), Chitinase (Chi), and Bt, using random 10-mer primers.
According to the some polymorphism, the second group contained the conventional counterpart cultivar which showed 95% similarity to its transgenic. In addition, results of ISSR primers showed differences among two transgenic plants (Bt and chitinase lines) and their conventional counterpart. ISSR similarity matrix for DNA amplified bands revealed that pairwise value between Bt, chitinase lines and their conventional counterpart was 94% and 96% respectively (Table 2). Pairwise similarity coefficient among two transgenic plants and their conventional counterpart ranged from 0.94 to 0.99. In the present study, more than 94% similarity was obtained from all the samples analyzed. The cluster of the constructed dendrogram based on UPGMA contained two major groups. The first group contained two Bt transgenic varieties and chitinase lines, which showed very close ISSR profile (Figure 3) and exhibited the highest (0.98) genetic similarity. The second group according to the some polymorphism contained the conventional counterpart cultivar which showed 96% similarity to its transgenes (Figure 4).
SDS-PAGE analysis
General, cluster analysis based on SDS-PAGE proved to be a powerful tool for detecting a low level of inter-specific genetic diversity which was observed in this study for protein analysis using SDS-PAGE gels. Similarity matrix exhibited four major bands, molecular weight from 10 KD to 35 KD. Pairwise similarity coefficient among two transgenic plants and their conventional counterpart was 1.00. Genetic similarity among two transgenic plants and their conventional counterpart was 100% (Table 4). The electrophoretic protein banding patterns for two transgenic lines
compared to the conventional counterpart are shown (Figure 6). All bands of three cultivars are monomorph and no polymorphic bands were detected.
In the present study, the potential of three different techniques using DNA markers (RAPD and ISSR) and protein marker was assessed for the genetic characterization of two transgenic cottons and their conventional counterpart. UPGMA method used to analyze the respective data provided strong evidence to reveal genetic relationships. These techniques provided valuable information regarding the similarity of the accessions’ genetic backgrounds (Table 3, Figure 5). In particular, the majority of the related lines have same band in the ISSR, RAPD and SDS-PAGE-derived dendrograms, which showed There is no different between transgenic plant and their conventional counterpart.
Therefore, either of the molecular marker techniques (ISSR and RAPD) appeared effective for the assessment of genetic relationships within cotton. Also, the analysis of total protein using SDS-PAGE, proved to be an effective and rapid technique for assessing the molecular similarity of transgenic plants and their conventional counterpart (Figure 6). The result indicated that RAPD and SDS-PAGE techniques are effective to develop genetic uniformity of transgenic cotton. Our results are in line with Metry et al., (2002), who used RAPD markers and SDS-PAGE analysis to identify genetic similarity among transgenic potato culture.
Table 2. Similarity matrix of two transgenic cotton and conventional counterpart based on ISSR marker.
Genotype Chitinase Bt Conventional counterpart
Chitinase 100%
Bt 98% 100%
Conventional
counterpart 96% 94% 100%
Table 3. Similarity matrix of two transgenic cotton and conventional counterpart based on RAPD and ISSR markers
Genotype Chitinase Bt Conventional counterpart
Chitinase 100%
Bt 97% 100%
Conventional
Journal of Plant Molecular Breeding (2015), 3(2): 36-43 40
Figure 2.Dendrogram on the basis of the RAPD similarity matrix data by UPGMA cluster analysis among Bt, chitinase cotton and conventional counterpart.
Figure 3.ISSR analysis demonstrating polymorphisms among Chitinase (Chi), Bt and conventional counterpart (CC).
Since RAPD technique does not require previous DNA sequence information and uses very small quantity of DNA, it is considered as one of the most widely used techniques for genetic diversity studies. The reproducibility of amplification profiles of RAPD is influenced by any variation in the method used for DNA isolation, concentration of template DNA and primer, Taq
DNA polymerase concentration, temperature of annealing, the number of thermal cycles and MgCl2 concentration (11).
Due to simplicity of use, and high throughput, RAPD and ISSR markers have been used for cultivar identification. Based on the RAPD and ISSR analyses, the similarity coefficients among all accessions were calculated. From the UPGMA clustering analysis based on RAPD and ISSR data, Bt cotton, and chitinase cotton cultivars
Table 4. Similarity matrix of two transgenic cotton and conventional counterpart based on protein marker.
Genotype Chitinase Bt Conventional counterpart
Chitinase 100%
Bt 100% 100%
Conventional
counterpart 100% 100% 100%
formed a cluster. In addition, Among the PCR based marker techniques, ISSR is one of the simplest and widely used techniques, which involves amplification of DNA segment present at an amplifiable distance in between two identical microsatellite repeat regions oriented in opposite direction. As ISSR markers are one of the cheapest and easiest marker systems with high efficiency in generating polymorphism among closely related varieties Therefore, in these lines based of genetic distance the same level similarity can be observed been seen (Table3).
Since RAPD technique do not require previous DNA sequence information and uses a very small amount of DNA, it is considered as one of the most widely used techniques for cultivar identification and genetic diversity studies. However, there is a problem with RAPD regarding its reproducibility.
41 Journal of Plant Molecular Breeding (2015), 3(2): 36-43
Figure 5.Dendrogram on the basis of the RAPD and ISSR similarity matrix data by unweighted pair group method with average (UPGMA) cluster analysis among Bt, Chitinase cotton and conventional counterpart.
Figure 6.SDS-PAGE of total protein extracted from chitinase (Chi), Bt cotton and Conventional counterpart (C).
Due to their economy, simplicity of use, and high throughput, RAPD and ISSR markers have been used for cultivar identification. In recent years, the use of ISSR markers for resolving the genetic diversity in fig trees has been remarkable (2, 12, 14, 15).
We demonstrated that ISSR and RAPD analysis can detect sufficient polymorphism to differentiate among cotton cultivars and that it is suitable for studying their genetic relationships. The present study is considered as a useful report on the assessment of genetic uniformity of transgenic Bt and chitinase cotton with conventional counterpart using ISSR, RAPD, and protein markers. To the best of our knowledge, this is the first report on genetic uniformity of T2 transgenic chitinase cotton. The data for the Bt and chitinase cotton varieties showed that the transgenic lines are similar to non-transgenic counterpart cotton. These lines could be used for more in-depth. Furthermore, new ways of commercializing evaluation and biosafety studies can be proposed. In addition, the results showed that there is no different between transgenic plants and their conventional counterpart in genome level. Thus, transgenic plants are same conventional counterpart exception target trait.
ACKNOWLEDGMENTS
Financial support from Payame Noor University, Tehran, Iran and technical support from Agricultural Biotechnology Research Institute of Iran (ABRII) are gratefully acknowledged.
REFERENCES
[1] Abeyaratne, W.M., De Silva, U.N., Kumari, H.M.P.S. and De. Z. Abeysiriwardena, D.S. 2004. Callus induction, Plantlet regeneration and occurrence of somaclonal variation in somatic tissues of some Indica rice varieties.
Ann of the Sri Lanka Department of Agriculture, 6:1-11. [2] Amel, S.H., Mokhtar, T., Salwa Z., Jihene, H., Messaoud,
M., Abdel Ajid, R., and Mohamed, M. 2004. Inter-simple sequence repeat fingerprints to assess genetic diversity in Tunisian fig (Ficus carica L.) germplasm. Genetic Resources and Crop Evolution, 51:269-275.
[3] Bornet, B. and Branchard, M. 2001. Nonanchored inter simple sequence repeat (ISSR) markers: Reproducible and specific tools for genome fingerprinting. Plant Mol. Biol. Rep., 19:209-215.
[4] Cardoza, V. and Stewart, N. 2004. Invited Review: Brassica Technology: progress in cellular and molecular biology. In Vitro CellDev. Biol. Plant., 40:542-551. [5] Carrari, F., Torres, H.N. and Flawiá, M.M. 2011. Safety
assessment of nonbrowning potatoes: Opening the discussion about the relevance of substantial equivalence on next generation biotech crops. Plant Biotechnology Journal, 9:136-150.
[6] Chassy, B. 2010. Food safety risks and consumer health.
New Biotechnology, 27:534-544.
[7] Damerval, C., Vienne, D.D., Zivy, M. and Thiellement, H. 1986. Technical improvements in two-dimensional electrophoresis increase the level of genetic variation detected in wheat-seedling proteins.Electrophoresis, 7:52-54.
Journal of Plant Molecular Breeding (2015), 3(2): 36-43 42
[9] Doyle, J.J. and Doyle, J.L. 1990. Isolation of plant DNA from fresh tissue. Focus. 12:13-15.
[10]Farooq Ahmed, M., Iqbal, M., Shahid Masood, M., Ashiq Rabbani, M., Munir, M. 2010. Assessment of genetic diversity among Pakistani wheat (Triticum aestivum L.) advanced breeding lines using RAPD and SDS-PAGE.
Electron J .Biotech., 13:1-10.
[11]Gaafar, R.M., and Saker, M.M., 2006. Monitoring of cultivars identity and genetic stability in strawberry varieties grown in Egypt. W. J. Agric. Sci., 2:29-36. [12]Ikegami, H., Nogata, H., Hirashima K., Awamura M. and
Nakahara T. 2009. Analysis of genetic diversity among European and Asian fig varieties (Ficus carica L.) using ISSR, RAPD, and SSR markers. Genet. Resour. Crop Evol., 56:201-209.
[13]Joshi, S.P., Gupta, V.S., Aggarwal, R.K., Ranjekar, P.K. and Brar, D.S. 2000. Genetic diversity and phylogenetic relationship as revealed by inter-simple sequence repeat (ISSR) polymorphism in the genus Oryza. Theor. Appl. Genet., 100:1311-1320.
[14]Khadari, B., Breton, C., Moutier, N., Roger, JP., Besnard, G., Bervillé, A. Dosba F. 2003. The use of molecular markers for germplasm management in a French olive collection. Theoretical and Applied Genetics, 106:521-529.
[15]Khadari, B., Grout, C., Santoni, S. and Kjellberg, F. 2005. Contrasted genetic diversity and differentiation among Mediterranean populations of Ficus carica L. A study using mtDNA RFLP. Genetic Resources and Crop Evolution, 52:97-109.
[16]Lamboy, W.F. 1994a. Computing genetic similarity coefficients from RAPD data. The effects of PCR artifacts.
PCR Methods and Applications, 4:31-37.
[17]Lamboy, W.F. 1994b. Computing genetic similarity coefficients from RAPD data correcting for the effects of PCR artifacts caused by variation in experimental conditions. PCR Methods and Applications, 4:38-43. [18]Leroy, X.J., Leon, K. and Branchard, M. 2000. Plant
genomic instability detected by microsatellite-primers.
EJB., 3(2).
[19]Martin, M., Sarmento, D., and Oliveira, M.M. 2004. Genetic stability of micropropagated almond plantlets, as assessed by RAPD and ISSR markers. Plant Cell Rep., 23:492–496.
[20]Metry, E., Enan, M., Gad El-Karim, G.H., Nasr, El-Din T. and Madkour, M. 2002. Production of genetically modified potato plants for fungal resistance. Arab J. Biotech. 5:11-18.
[21]Moreno, S.J.P., Martin and Ortiz, J.M. 1998. Inter-simple sequence repeats PCR for characterization of closely related grapevine germplasm. Euphytica, 101:117-125. [22]Nei, M., and Li, W.H. 1979. Mathematical model for
studying genetic variation in terms of restriction endonucleases. Proc. Natl. Acad. Sci., 76:5269-5273. [23]Palombi, M.A. and Damiano, C. 2002. Comparison
between RAPD and SSR molecular markers in detecting genetic variation in kiwifruit (Achnidia deliciosa A. Chev.). Plant Cell Rep., 20:1061-1066.
[24]Pasakinskiene, I., Griffiths, C.M., Bettany, A.J.E., Paplauskiene, V. and Humphreys, M.W. 2000. Anchored simple-sequence repeats as primers to generate species-specific DNA markers in Lolium and Festuca grasses.
Theor. Appl. Genet., 100:384-390.
[25]Pradeep Reddy, M., Sarla, N. and Siddiq, E.A. 2002. Inter simple sequence repeat (ISSR) polymorphism and its application in plant breeding, Euphytica, 128:9–17. [26]Rani, V., and Raina, S.N. 2000. Genetic fidelity of
organized meristem derived micropropagated plants: A critical reappraisal. In VitroCell Dev. Biol. Plant, 36:319-330.
[27]Rietveld, R.C., Hasegawa, P.M. and Bressan, R.A. 1987. Genetic variability in tuber disc-derived potato plants in Biotechnology C.F. “In: Agriculture and Forestry” Potato (ed. By Y. P.S. Bajaj) Springer-Verlag Berlin Heidelbery, 3:392-407.
[28]Salimi, S. 2013. Relationships of Some Soybean Genotypes Based on Morphological Characters and Biochemical Marker. International Journal of Agronomy and Plant Production, 4:2237-2243.
[29]Santos, M.D.M., Buso, G.C.S. and Torres, A.C. 2008. Evaluation of genetic variability in micropropagated propagules of ornamental pineapple [Ananas comosus var.
bracteatus (Lindley) Coppens and Leal] using RAPD markers. Genetics and Molecular Research, 7:1097-1105. [30]Soniya, E.V., Banerjee, N.S. and Das M.R. 2001. Genetic
analysis of somaclonal variation among callus-derived plants of tomato. Current Science, 80:1213-1215. [31]Tohidfar, M., Ghareyazie, B., Mosavi, M., Yazdani, S.H.
and Golabchian, R. 2008. Agrobacterium-mediated transformation of cotton (Gossypium hirsutum) using a synthetic cry1Ab gene for enhanced resistance against
Heliothis armigera. Iranian J. Biotech., 6:164-173. [32]Tohidfar, M., Hossaini, R., Sokhandan, B.N. and
Tabatabaei, M. 2012. Enhanced resistance to Verticillium dahlia in transgenic cotton expressing an endochitinase gene from Phaseolusvulgaris. Czech J. Genet. Plant Breed., 48:33-41.
Journal of Plant Molecular Breeding (2015), 3(2): 36-43 43