Print ISSN: 2383-451X Online ISSN: 2383-4501 Web Page: https://jpoll.ut.ac.ir, Email: [email protected]
Fixed Bed Column Modeling of Cd(II) Adsorption on Bone Char
Using Backward Bayesian Multiple Linear Regression
Amiri, M. J.1*, Mahmoudi, M. R.2 and Khozaei, M.3
1. Department of Water Engineering, College of Agriculture, Fasa University, P.O.Box 74616-86131, Fasa, Iran
2. Department of Statistics, Faculty of Science, Fasa University, P.O. Box 74616-86131, Fasa, Iran
3. Department of Water Engineering, College of Agriculture, Shiraz University, P.O. Box 71365, Shiraz, Iran
Received: 19.12.2019 Accepted: 20.02.2020
ABSTRACT: In this work, the backward Bayesian multiple linear regression (BBMLR) as a new approach is presented to predict the adsorption efficiency (AE) of Cd(II) ions by ostrich bone char (OBC) in the fixed bed adsorption with four operational variables consisting of pH (2-9), inlet Cd(II) concentration (Co= 25-100 mg/L), bed depth (h= 3-9
cm) and feed flow rate (Q= 0.5-30 mL/min). The performance of the BBMLR was evaluated using the coefficient of determination (R2), normalized root means square error (NRMSE) and mean residual error (MRE). The AE of Cd(II) ions by OBC increased from 42.3% to 99.9% when pH was increased from 2 to 9 with h of 6 cm and Q of 1.5 mL min -1. It was found that the AE dramatically increased from 70.5% to 99.9% with decreasing
Q from 30 to 0.5 mL min-1 at pH of 7 and h of 6 cm. At pH= 7 and Q= 1.5 mL min-1, the
AE increased from 71.9% to 100% when h increased from 3 to 9 cm. The BBMLR model presented excellent performance (NRMSE=6.69%) for predicting Cd(II) removal in a continuous adsorption system, although it gave a slight underestimation (approximately 3.52%). The BBMLR is more sensitive to the pH, followed by h and Q, while the Co has
no significant effect on it. This research displays that OBC has great potential as an eco-friendly low-cost adsorbent in removing Cd(II) ions from the contaminated waters.
Keywords: Cd(II); adsorption efficiency; ostrich bone char; BBMLR. model.
INTRODUCTION
Cadmium is existent in the wastewater of many industrial plants such as paint pigments, nickel-cadmium batteries, ceramic, plastics, metal plating and mining (Khurram et al., 2019). The USEPA recommended that the maximum limit of Cd(II) in drinking water and industrial effluents is 0.005, and 0.1–0.2 mg/L, respectively. The higher concentration of
* Corresponding Author, Email: [email protected]
cadmium may cause different diseases and disorders such as bone defects, kidneys irritation, high blood pressure, liver failure and lung dysfunction (Lü et al., 2010). Therefore, it is necessary to remove of excess cadmium from contaminated water.
about 130 ostrich breeder farms (Amiri et al., 2016), these animal by-products can be pyrolyzed under limited oxygen conditions to produce bone char for pollutants removal. Many researchers have used bone char successfully for the elimination of metal ions (Rojas-Mayorga et al., 2016; Wang et al., 2020), fluoride (Alkurdi et al., 2019) and dyes (Maeda et al., 2019; Cruz et al., 2020) in water purification and wastewater treatment. Bon char principally comprised of hydroxyapatite which can be applied to remove a variety of toxic heavy metal ions via adsorption, ion exchange and dissolution/precipitation mechanisms (Wang et al., 2020).
Although the performance and effectiveness of adsorbent can be determined by a laboratory batch mode, continuous studies in a packed-bed column are required in order to determine the design of an industrial scale adsorption process (Maeda et al., 2019). On the other hand, continuous adsorption in a packed-bed column is time-consuming, high cost and very laborious. Several researchers have attempted to predict the removal efficiency of pollutants from contaminated water through mathematical models (Mousavi et al., 2012; Bahrami et al., 2017). In recent years, artificial intelligence approaches particularly artificial neural networks (Chowdhury and Saha, 2013; Masomi et al., 2015; Oguz 2017; Amiri et al., 2017b; Hu et al., 2020) have been employed accurately to estimate the removal percentage of target pollutants from aqueous media. Unfortunately, determination of proper network structure, needing more trial and error in training phase and also prone to overfitting are the main challenges of these methods in the column modeling (Amiri et al., 2017b). Today, applications of regression techniques particularly Bayesian regression have been increasingly used in hydrology and water management such as estimation of evapotranspiration (Zhu et al., 2013;
Khoshravesh et al., 2017); irrigation canal demands (Ticlavilca et al., 2013), and land surface temperature (Ghosh and Joshi, 2014). Adsorption efficiency (AE) of Cd(II) ions by ostrich bone char (OBC) in a fixed bed column system is a function of pH, initial pollutant concentration (Co), bed depth (h) and flow rate (Q). To the best of our knowledge, there is no efforts about applying the backward Bayesian multiple linear regression (BBMLR) for predicting heavy metals removal in a packed-bed adsorption system.
Therefore, the aims of this work were to: 1) use OBC as an eco-friendly low-cost adsorbent to remove Cd(II) ions in a continuous adsorption system; 2) present the data modeling of cadmium removal from column studies under different operating parameters using OBC by BBMLR; 3) perform the sensitivity analysis of the BBMLR to pH, Co, h and Q for controlling Cd(II) pollution.
MATERIALS AND METHODS
A stock Cd(NO3)2·(1000 mg/L) standard solution was prepared by Aldrich Co. Synthetic solutions were provided by dilution with deionized water.
OBC was prepared by carbonization of ostrich bone wastes at 800°C for 5 h under limited supply of oxygen. The specific surface area of OBC was measured by the
Brunauer–Emmet–Teller (BET)
method,whereas the mean pore size was determined by Barret-Joyner-Hanlenda (BJH) method (Awual 2015; Awual 2017). The total pore volume of OBC is determined by nitrogen adsorption at a relative pressure of 0.98. The scanning electron microscope (SEM-Seron, AIS2100) is applied to determine the structure and morphology of OBC The mineral composition of the OBC was analyzed by X-ray diffraction (XRD, Philips X’PERT MPD diffractometer) in the 2θ range of 10–100°.
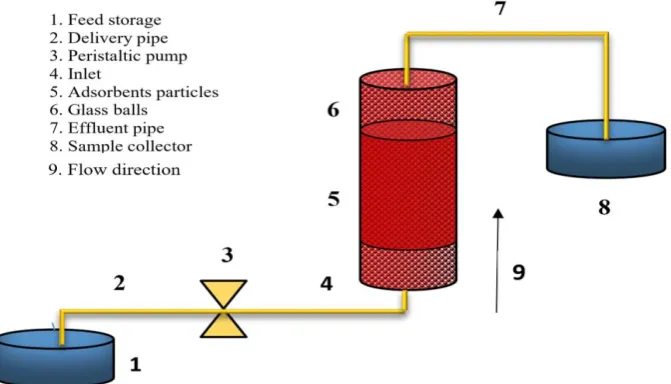
cm length) with two glass beads layers at both ends of the OBC (See Figure 1). The cadmium solution was introduced into the column at various volumetric flow rate (0.5-30 mL/min), initial concentrations (25-100 mg/L), pHs (2-9) and bed heights (3-9 cm) using a peristaltic pump in an upward direction in order to achieve complete saturation of the OBC. The cadmium concentration in the effluent was analyzed at regular time intervals using atomic absorption spectroscopy (Shimadzu
ARL 34000). The adsorption efficiency of the cadmium by OBC was calculated as follow (Oguz 2017; Amiri et al., 2017b):
1000 ) (
0
e o
t t
t o e
t Q C
dt C C Q
AE
e
(1)
where, Co and Ce are the influent and effluent
cadmium concentration, respectively. teis the
exhaustion time (min) and was accord, when the Ce is 99.5% of the Co.
Fig. 1. Schematic diagram for fixed bed column system: (1) feed storage, (2) delivery pipe, 3) peristaltic pump, 4) inlet, 5) adsorbent particles, 6) glass balls, 7) effluent pipe, 8) sample collector, and 9) flow direction.
To study the effects of several predictors X X 1, 2,, Xk on a quantitative variable , the Multiple linear regression (MLR, in abbreviation) is nicely applied. Generally, the MLR model is defined by (Press 1989)
0 1 1 2 2
ε
i i i k ki i
Y β β X β X β X (2)
where i 1, n, , are indices of the observed samples, β jj, 0, k, ,are the
parameters of MLR model, and
, 1, , ,
εi i n are the stochastic noises. , 0, , ,
j
β j k are estimated using the observed data and consequently the estimated MLR model can be presented by (Press 1989)
0 1 1 2 2
ˆ
i i i k ki
Y b b X b X b X (3)
such that b jj, 0, k, ,, are the estimated of β jj, 0, k, ,, and is the estimated value for , based on the estimated MLR model.
By using matrices and vectors, we can represent the MLR formula as
(4)
such that Y
1,,
T n
y y is response vector, is called design matrix where its first column is the vector
1,,1
T and itsis thcolumn 2
1
is β β
0,, βk
T the parameter vector, and ε ε
1,, εn
T is the stochastic noise vector (Zellner 1971). Moreover, the prediction vector Yˆ y
ˆ1,, yˆn
T can be computed by Yˆ Xb , such that
0, ,
b b bk T. It should be noted that when the model doesn’t need the constant ( ), the first column of the matrix will be removed. The ordinary least squares (OLS, in abbreviation) estimators of are computed by (Box and Tiao, 1973):
(5)
In the Bayesian technique, we have more information (that is usually called prior) about the parameter vector Based on Bayes theorem, the prior information and data's information are combined to gain the new information (that is usually called posterior) about The prior is commonly determine based on the previous information about data (Gelman et al., 2003). In this work, the dataset of train groups was divided in two parts; First part was used as prior information (dataset), and second part was used as experimental dataset. The posterior Bayesian coefficients can be expressed in terms of prior and experimental information by
1 , b Y Y T TPos Exp Exp Pr Pr
T T
Exp Exp Pr Pr
X X X X
X X
(6)
where indexes refer to
posterior, experimental and prior, respectively (Carlin and Louis, 2008). BBMLR modeling was accomplished on statistical R software version 3.6.1. To implement the backward Bayesian multiple linear regression (BBMLR), the 81 experimental data of column were divided into two groups: the first 70 % of the data (57 observations) were randomly used for
building and the rest were employed for training.
The suitability of the BMLR model was analyzed using different standard statistical criteria such as NRMSE, MRE and R2. These criteria are defined as follow:
100 * ) ( 5 . 0 2 1 2
ave ni i i
nO O P NRMSE (7) ave n
i i i
nO O P
MRE
1( ) (8)
n i n i i i i i n i i i i i P P O O O O P P R 1 1 2 2 2 1 2 ) ( ] ) ( [ (9)where Oi, Pi, Oi , Pi and
n
are theobserved measurement, predicted
measurement, average of the observed values, average of the predicted values, and number of observations, respectively. The R2 has maximum amount of 1, with a better agreement close to 1. The MRE is a magnitude of estimation bias, with
negative amount denoting to
underestimation while positive amount denoting to overestimation. The BMLR performance was determined by the NRMSE as follow:
20% : 3 10% : 10% 20% 30 0% : : % NRMSE NRMSE good NRMSE fair NRMSE excellent poor (10)
RESULTS AND DISCUSSION
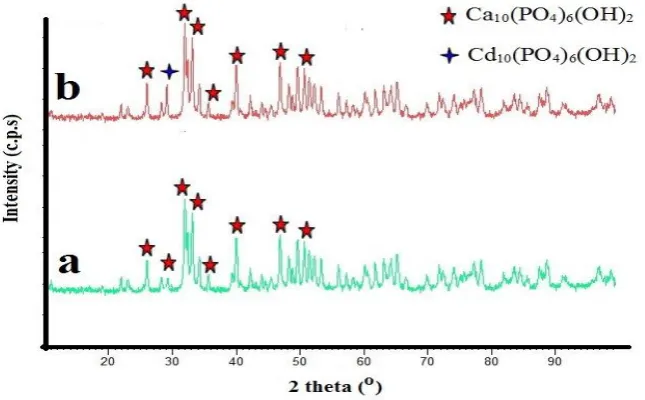
SEM of OBC indicates a rough and uneven surface morphology, demonstrating successful combustion of organic compounds such as organic tissue, fat, and collagen from the structure of ostrich bone waste (See Figure 2). Also, OBC consist of irregularly shaped particles with plenty of cavities. As expected (See Figure 3a), XRD pattern showed that the OBC composed of high contents of calcium and phosphorous in the form of calcium hydroxyapatite (Ca10(PO4)6(OH)2 or CaHAP). There are eight distinctive peaks for Ca10(PO4)6(OH)2 (2θ = 25.77°, 29.12°,
31.69°, 34.85°, 39.73°, 46.58° and 51.95°) in the X-ray results of the OBC similar to those reported for swine bone char and bovine bone char (Amiri et al., 2016; Amiri et al., 2018). After Cd(II) adsorption, XRD patterns indicated that Ca(II) in Ca10(PO4)6(OH)2 was exchanged out by Cd(II) and the Cd10(PO4)6(OH)2 coating was formed (See Figure 3b). The sharp peak at the left shoulder of the big peaks of CaHAP (the peaks at 28° (2θ)), appeared after OBC was incubated in Cd(II) solution for 300 min (See Figure 3b).
Fig. 2. SEM image of OBC: (a) 250x, (b) 500x, (c) 1000x and (d) 5000x
Fig. 3. XRD patterns of OBC before (a) and after (b) adsorption of Cd(II).
The MLR model study the simultaneous effects of the variables X X 1, 2,, Xk on the variable . If one or more variables have non-significant effects (p-value (p, in abbreviation) is more than considered level 0.05), the backward BMLR (BBMLR, in abbreviation) is usually applied. In BBMLR technique, the most ineffective variables are eliminated stepwise such that the most important variables remain in the model. In this research the AE of Cd(II) by OBC in a fixed bed column system was the response variable. Also the variables pH, Co, h, and Q, were the predictors. Therefore, based on the MLR model, the AE can be formulated by
0 1 2
3 4
AE pH Co
h Q
i i i
i i i
β β β
β β (11)
At first step, all predictors were considered and the BMLR model has been run. Table 1 reports the results of the first step for BMLR model. It can be concluded
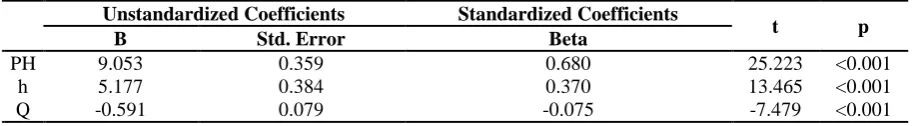
that the BMLR model doesn’t need the constant (p > 0.05). In other words, the model doesn’t need . The results of without constant BMLR model are reported in Table 2. It can be seen that when we consider the effects of other predictors, the variable Co is ineffective on AE (p > 0.05). Table 3 summarizes the results of BBMLR model, after eliminating the predictor Co. It can be concluded that the effects of the predictors pH, h, and Q, on AE are significant. pH, and h have positive effects (t>0), and Q has negative effect (t<0) revealing that the AE of Cd(II) increased while the pH and h increased from 2 to 9 and 3 to 9 cm, respectively, and the Q decreased from 30 to 0.5 mL/min. In fact, with increasing pH and h and decreasing Q prolong breakthrough times are obtained (Amiri et al., 2017a). Therefore, the equation of final BBMLR model was
AE9.053pH 5.177h 0.591Q. ˆ ˆ (12)
Table 1. Coefficients of BBMLR (First Step)
Unstandardized Coefficients Standardized Coefficients
t p
B Std. Error Beta
Intercept (Constant) -1.399 5.492 -0.255 0.800
pH 9.009 0.447 0.898 20.145 <0.001
Co 0.036 0.053 0.030 0.672 0.505
h 5.139 0.656 0.364 7.831 0.000
Q -0.584 0.084 -0.330 -6.956 0.000
Table 2. Coefficients of BBMLR (Second Step)
Unstandardized Coefficients Standardized Coefficients
t p
B Std. Error Beta
pH 8.956 0.392 0.672 22.822 <0.001
Co 0.029 0.047 0.018 0.631 0.531
h 5.021 0.459 0.359 10.930 .000
Q -0.580 0.082 -0.073 -7.111 <0.001
Table 3. Coefficients of BBMLR (First Step)
Unstandardized Coefficients Standardized Coefficients
t p
B Std. Error Beta
PH 9.053 0.359 0.680 25.223 <0.001
h 5.177 0.384 0.370 13.465 <0.001
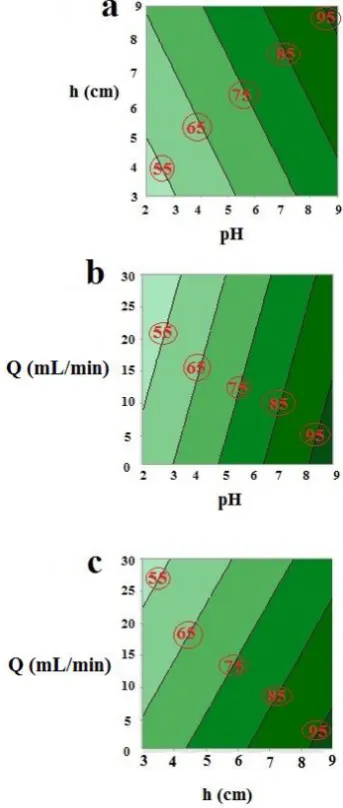
Figure 4, shows the counter plots of AE versus the pairs (pH, h), (pH, Q), and (h, Q), respectively. These Figures also qualified that the AE was optimized (dark green color) when pH, and h were been increased, and Q were been decreased. Based on the coefficients of equation 12, the AE is more sensitive to the pH, followed by h and Q. Because pH can affect the surface charge of OBC, speciation of the cadmium and the ion-state of functional groups on the OBC surface (Amiri et al., 2016). The lowest AE was observed at pH of 2 (See Figures 4a and 4b), due to the competition between excess hydrogen ions and the Cd(II) ions for binding to adsorption sites on the OBC and also protonation of the functional groups. Moreover, the repulsion force between the OBC surface and the Cd(II) ions may be occurred in the lower pH range (Amiri et al., 2018). On the other hand, deprotonation of OBC surface is increased with increasing the pH, which enhances the negatively charged sites of adsorbent, and increases the electrostatic attraction between the Cd(II) ions and the negative charge on the OBC surface (Amiri et al., 2018). At pH > 7, the precipitation of Cd(II) ions as Cd(OH)2 occurred, and therefore increases the AE of Cd(II) ions (Amiri et al. 2018). It is clear that increasing of h from 3 to 9 cm increased AE of Cd(II) ions significantly due to the broad mass transfer zone (Chowdhury and Saha, 2013; Amiri et al., 2017a), which raises the available active sites of the OBC (See Figures 4a and 4c). Finally, the AE of Cd(II) ions increased when the influent Q was decreased from 30 to 0.5 mL/min (See Figures 4b and 4c), due to the sufficient contact time for interaction between Cd(II) ions and OBC (Chowdhury and Saha, 2013; Amiri et al., 2017a). The dominant mechanism for the adsorption of Cd(II) ions by OBC is ion exchange reaction between Cd(II) in solution and Ca(II) ions
of CaHAP as follow (Amiri et al., 2016; Amiri et al., 2018; Wang et al., 2020):
2
10 4 6 2
2
10 4 6 2
x ( x )
Ca ( PO ) ( OH ) xCd
Cd Ca ( PO ) ( OH ) xCa (13)
Fig. 4. Contour plots of AE for interaction between: (a) pH and h, (b) pH and Q, and (c) h and Q
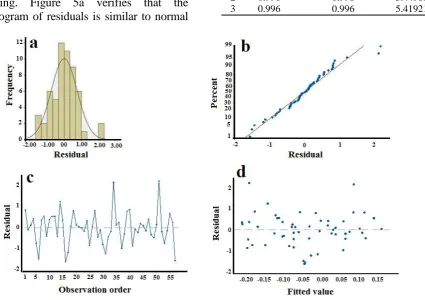
In this part, the ability of BBMLR model is studied based on the residual analysis, root mean square error (RMSE), R-squared (R2) and adjusted R-squared ( ). The goodness of a model is verified when the values of R2 and are close to one, the values of RMSE is close to zero, and the residuals of the model are independent normal with stable variance. Table 4 indicates that the values of R2 and are 0.996, and therefore the BBMLR is nicely able to model the AE, based on these indices. The normality of residuals is also investigated by using normal probability plot and Histogram chart, and by applying several normality tests such as Shapiro-Wilk, Kolmogorov-Smirnov and Anderson-Darling. Figure 5a verifies that the Histogram of residuals is similar to normal
distribution. The normal probability plot (Figure 5b) also verified that the residuals are normally distributed. The normality tests also verified the normality of the residuals (p >0.05). Figure 5c shows that the plot of residuals versus observations’ number is randomly distributed, that verifies the residuals are independent. Figure 5d indicates that the plot of the residuals versus the predicted values is randomly distributed, that verifies the variances of the residuals are stable. Consequently, the BBMLR is nicely able to model the AE.
Table 4. Indices to study the ability of BBMLR model
Step R Squared Adjusted R Squared RMSE
1 0.901 0.893 5.49841
2 0.996 0.996 5.44969
3 0.996 0.996 5.41921
Fig. 5. (a) Histogram chart of residuals (b) normal probability plot of residuals (c) plot of residuals versus observations order (d) plot of residuals versus fitted values for the BBMLR model.
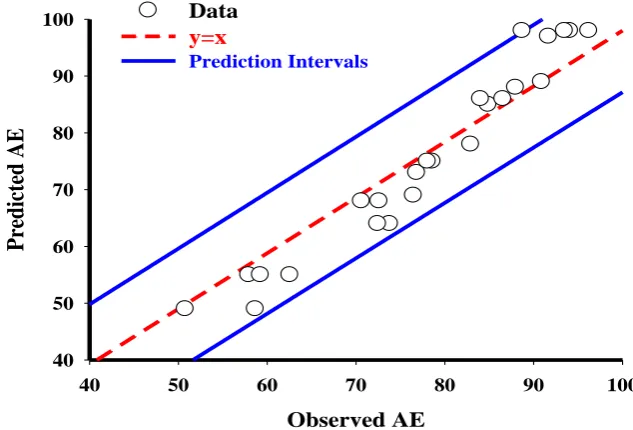
Twenty-four independent column experimental data were considered for testing the BBMLR model. By applying the input data (pH, Co and Q) in equation (12),
the performance of the BBMLR model in testing period. The comparison of the AE
estimated by BBMLR model and
experimental values indicated good agreement with R2 0.9489, which the best linear fit was showed by a dash red line (See Fig. 6). Also, the prediction intervals at 95% level, based on the distribution of points around the fitted line, exhibit a good reliability for fitting and estimating AE of
Cd(II) ions by OBC (See Fig. 6). The NRMSE value is equal to 6.69% (less than 10%), which indicates excellent performance of the method. The MRE value (-0.0267) suggested that the BBMLR model underestimates the AE values by average of 3.52%. This research indicated that the BBMLR model could be an accurate and faster alternative to available artificial intelligence methods for column modeling.
Observed AE
40 50 60 70 80 90 100
Pr
edic
ted AE
40 50 60 70 80 90
100 Data
y=x
Prediction Intervals
Fig. 6. Scatter plot between observed AE and predicted AE.
CONCLUSION
In this paper, on the basis of fixed bed column experiments conducted with four operational parameters (pH, Co, h and Q), BBMLR model is employed for the estimation of AE for the removal of Cd(II) ions by OBC. The results of BBMLR model at testing phase indicated that this model (R2 = 0.9489, NRMSE = 6.69% and MRE = -0.0267) is useful and accurate to estimate AE. The AE of Cd(II) increased while the pH and h increased from 2 to 9 and 3 to 9 cm, respectively, and the Q decreased from 30 to 0.5 mL/min. The predicted AE by BBMLR model is more sensitive to the pH, followed by h and Q. The results showed that the Co has not significant effect on AE of Cd(II) and consequently is dropped from the final
model. The good efficiency of cadmium elimination introduces OBC as eco-friendly low-cost material for the elimination of Cd(II) ions from contaminated water, which can be used instead of commercial adsorbents.
GRANT SUPPORT DETAILS
The present research did not receive any financial support.
CONFLICT OF INTEREST
redundancy has been completely observed by the authors.
LIFE SCIENCE REPORTING
No life science threat was practiced in this research.
REFERENCES
Alkurdi, S.S.A., Al-Juboori, R.A., Bundschuh, J. and Hamawand, I. (2019). Bone char as a green sorbent for removing health threatening fluoride from drinking water. Environ Int., 127, 704-719.
Amiri, M.J., Abedi-Koupai, J. and Eslamian, S. (2017a). Adsorption of Hg(II) and Pb(II) ions by nanoscale zero-valent iron supported on ostrich bone ash in a fixed-bed column system. Water Sci. Technol.,76(3), 671-682.
Amiri, M.J., Abedi-Koupai, J., Eslamian, S.S. and Arshadi, M. (2016). Adsorption of Pb(II) and Hg(II) ions from aqueous single metal solutions by using surfactant-modified ostrich bone waste. Desalin. Water Treat., 57(35), 16522-16539.
Amiri, M.J., Abedi-Koupai, J., Jafar Jalali, S.M. and Mousavi, S.F. (2017b). Modeling of fixed-bed column system of Hg (II) ions on ostrich bone ash/nZVI composite by artificial neural network. J. Environ. Eng.-ASCE., 143(9), 04017061.
Amiri, M.J., Arshadi, M., Giannakopoulos, E. and Kalavrouziotis, I.K. (2018). Removal of mercury (II) and lead (II) from aqueous media by using a green adsorbent: kinetics, thermodynamic, and mechanism studies. J. Hazard. Toxic Radioact. Waste., 22(2), 04017026.
Awual, M.R. (2015). A novel facial composite adsorbent for enhanced copper(II) detection and removal from wastewater. Chem Eng J., 266, 368-375.
Awual, M.R. (2017). New type mesoporous conjugate material for selective optical copper(II) ions monitoring & removal from polluted waters. Chem Eng J., 307, 85-94.
Bahrami, M., Amiri, M.J., Mahmoudi, M.R. and Koochaki, S. (2017). Modeling caffeine adsorption by multi-walled carbon nanotubes using multiple polynomial regression with interaction effects. J. Water Health., 15(4), 526-535.
Box, G.E.P. and Tiao, G.C. (1973). Bayesian Inference in Statistical Analysis, Addison Wesley Publishing.
Carlin, B.P. and Louis, T.A. (2008). Bayesian Methods for Data Analysis, Chapman and Hall/CRC. London.
Chowdhury, S. and Saha, P. (2013). Artificial neural network (ANN) modeling of adsorption of methylene blue by NaOH-modified rice husk in a fixed-bed column system. Environ. Sci. Pollut. Res., 20(2), 1050-1058.
Cruz, M.A.P., Guimaraes, L.C.M., Costa Junior, E.F., Rocha., S.D.F. and Mesquita, P.D.L. (2020). Adsorption of crystal violet from aqueous solution in continuous flow system using bone char. Chem Eng Comm., 270(3), 372-381.
Gelman, A., Carlin, J.B., Stern, H.S. and Rubin, D.B. (2003). Bayesian Data Analysis, Chapman and Hall/CRC. London.
Ghosh, A., Joshi, P.K. (2014). Hyperspectral imagery for disaggregation of land surface temperature with selected regression algorithms over different land use land cover scenes. ISPRS J Photogramm Remot Sens., 96, 76–93.
Hu, A., Ren, G., Che, J., Guo, Y., Ye, J. and Zhou, S. (2020). Phosphate recovery with granular acid-activated neutralized red mud: Fixed-bed column performance and breakthrough curve modelling. J Environ Sci., 90, 78-86.
Khoshravesh, M., Gholami Sefidkouhi, M.A. and Valipour, M. (2017), Estimation of reference evapotranspiration using multivariate fractional polynomial, Bayesian regression, and robust regression models in three arid environments. Appl. Water Sci., 7, 1911–1922.
Khurram, A.M., Farooq, U., Athar, M.M. and Salman, M. (2019). Biosorption of Cd(II) ions from its aqueous solutions using powdered branches of Trifolium resupinatum: equilibrium and kinetics. Green Chem Lett Rev., 12(3), 217-224.
Lü, L., Lu, D., Chen, L., Luo, F. (2010). Removal of Cd(II) by modified lawny grass cellulose adsorbent. Desalination., 259, 120–130.
Maeda, C.H., Araki, C.A., Moretti, A.L., Barros, M.A.S.D. and Arroyo, P.A. (2019). Adsorption and desorption cycles of reactive blue BF-5G dye in a bone char fixed-bed column. Environ. Sci. Pollut. Res., 26, 28500–28509.
Masomi, M., Ghoreyshi, A.A., Najafpour, G.D. and Mohamed, A.R.B. (2015). Dynamic adsorption of phenolic compounds on activated carbon produced from pulp and paper mill sludge: experimental study and modeling by artificial neural network (ANN). Desalin. Water Treat., 55(6), 1453–1466.
Pollution is licensed under a "Creative Commons Attribution 4.0 International (CC-BY 4.0)" Oguz, E. (2017). Fixed-bed column studies on the
removal of Fe3 and neural network modelling. Arab J Chem., 10 (3), 313–320.
Press, S.J. (1989). Bayesian Statistic: Principles, Models and Application, John Wiley and Sons, New York.
Rojas-Mayorga, C.K., Mendoza-Castillo, D.I., Bonilla-Petriciolet, A. and Silvestre-Albero, J. (2016). Tailoring the adsorptionbehavior of bone charfor heavy metal removalfrom aqueous solution. Adsorpt Sci Technol 34(6), 368-387.
The Council of the European Communities, Directive on pollution caused by certain dangerous substances discharged into the aquatic environment of the community [76/464/EEC], Off. J. Eur. Commun. L 129/23 (May) (1976).
Ticlavilca, A.M., McKee, M. and Walker, W.R.
(2013). Real-time forecasting of short-term irrigation canal demands using a robust multivariate Bayesian learning model. Irrig Sci., 31, 151–167
Wang, M., Liu, Y., Yao, Y., Han, L. and Liu, X. (2020). Comparative evaluation of bone chars derived from bovine parts: Physicochemical properties and copper sorption behavior. Sci Total Environ., 700, 134470.
Zellner, A. (1971). An introduction to Bayesian inference in econometrics, John Wiley & Sons, New York.