Ames Laboratory Publications
Ames Laboratory
7-5-2006
Magnetic anisotropy and magnetic phase diagram
of Gd5Ge4
Zhong W. Ouyang
Iowa State UniversityVitalij K. Pecharsky
Iowa State University, vitkp@ameslab.gov
Karl A. Gschneidner Jr.
Iowa State University, cagey@ameslab.gov
Deborah L. Schlagel
Iowa State University, schlagel@iastate.edu
Thomas A. Lograsso
Iowa State University, lograsso@ameslab.gov
Follow this and additional works at:
http://lib.dr.iastate.edu/ameslab_pubs
Part of the
Condensed Matter Physics Commons
, and the
Metallurgy Commons
The complete bibliographic information for this item can be found at
http://lib.dr.iastate.edu/
ameslab_pubs/70
. For information on how to cite this item, please visit
http://lib.dr.iastate.edu/
howtocite.html
.
similar transformations when the magnetic field vector is perpendicular to the c axis. This anisotropic
behavior is due to variation of magnetization energy between the c axis and the a or b axes of the
orthorhombic crystal caused by a different alignment of the Gd moments with respect to the magnetic field
vector. The anisotropy of the antiferromagnetic state diminishes with the increasing magnetic field and
temperature. The critical magnetic field for the antiferromagnetic-ferromagnetic transition is the smallest and
the ferromagnetic state is most stable when the magnetic field vector is parallel to the b axis, indicating an easy
magnetization direction along this axis. The anisotropy of the magnetic field-induced transformation in
Gd
5Ge
4is discussed in connection with the coupled magnetic and structural transitions. Anisotropic
magnetic phase diagrams along the three major crystallographic axes are constructed.
Keywords
Materials Science and Engineering
Disciplines
Condensed Matter Physics | Metallurgy
Comments
This article is from
Physical Review B
74 (2006): 024401, doi:
10.1103/PhysRevB.74.024401
.
Magnetic anisotropy and magnetic phase diagram of Gd
5Ge
4Z. W. Ouyang
Materials and Engineering Physics Program, Ames Laboratory, Iowa State University, Ames, Iowa 50011-3020, USA
V. K. Pecharsky*and K. A. Gschneidner, Jr.
Materials and Engineering Physics Program, Ames Laboratory, Iowa State University, Ames, Iowa 50011-3020, USA and Department of Materials Science and Engineering, Iowa State University, Ames, Iowa 50011-2300, USA
D. L. Schlagel and T. A. Lograsso
Materials and Engineering Physics Program, Ames Laboratory, Iowa State University, Ames, Iowa, 50011-3020, USA 共Received 11 January 2006; revised manuscript received 30 May 2006; published 5 July 2006兲
The magnetization of single crystal Gd5Ge4, which in a zero magnetic field orders antiferromagnetically at
128 K, indicates a reversible spin-flop transition when the magnetic field is along thecaxis and the absence of similar transformations when the magnetic field vector is perpendicular to thecaxis. This anisotropic behavior is due to variation of magnetization energy between thecaxis and theaorbaxes of the orthorhombic crystal caused by a different alignment of the Gd moments with respect to the magnetic field vector. The anisotropy of the antiferromagnetic state diminishes with the increasing magnetic field and temperature. The critical magnetic field for the antiferromagnetic-ferromagnetic transition is the smallest and the ferromagnetic state is most stable when the magnetic field vector is parallel to thebaxis, indicating an easy magnetization direction along this axis. The anisotropy of the magnetic field-induced transformation in Gd5Ge4is discussed in con-nection with the coupled magnetic and structural transitions. Anisotropic magnetic phase diagrams along the three major crystallographic axes are constructed.
DOI:10.1103/PhysRevB.74.024401 PACS number共s兲: 75.30.Gw, 75.30.Kz, 75.50.Ee, 75.50.Cc
I. INTRODUCTION
Magnetic anisotropy is an important and intrinsic property of many rare-earth-based magnetic materials.1–4The varying levels of anisotropy in these compounds are related to single ion anisotropies of specific lanthanide ions and/or to the an-isotropy of the crystal lattice resulting from a particular crys-tal structure, often distinctly layered. The nonzero magnetic anisotropy of Gd-based compounds receives considerable at-tention because the Gd3+ ion has a negligible anisotropy of its 4f-electron wave functions and anisotropic magnetic properties are defined solely by the crystal lattice.5,6
The pseudobinary Gd5SixGe4−x compounds, as a recent example of naturally layered materials, exhibit unusually strong responses to small changes of magnetic field, such as large magnetocaloric, magnetostrictive, and magnetoresis-tance effects when xⱕ⬃2.7–11 Early experiments revealed that they are due to the magnetic field-induced first-order magnetic phase transition which in these compounds is accompanied by a simultaneous crystallographic transformation.9,12 These coupled magneto-structural transi-tions, depending on the value ofx, magnetic field, tempera-ture, and pressure,13–15were found to be related to the break-ing or the reformbreak-ing of共Si, Ge兲-共Si, Ge兲 covalentlike bonds between structurally well-defined, subnanometer-thick slabs that are infinite in two dimensions along theaandcaxes and are stacked differently along theb axis forming three differ-ent crystal structures found in the Gd5SixGe4−x family.12,16 Despite the distinctly anisotropic crystal lattices, little is known about the related anisotropy of the physical behaviors in the Gd5SixGe4−xsystem.
One of the parent compounds, Gd5Ge4, is especially in-triguing because of its peculiar magnetic properties that are
clearly related to instability of the crystal structure of the material. The magnetic ground state of Gd5Ge4is believed to be antiferromagnetic 共AFM兲.17–20 The AFM state can be transformed into the ferromagnetic共FM兲state depending on the temperature and the applied magnetic field as long as the latter exceeds⬃10 kOe. At the same time, the crystal struc-ture is transformed from the Sm5Ge4-type to the Gd5Si4-type structure, with the transition showing a martensiticlike character.21,22 Below ⬃10 K, the magnetic-field-induced AFM-FM transition in polycrystalline Gd5Ge4is irreversible, while above ⬃20 K the transition becomes completely re-versible. Between⬃10 and⬃20 K, there exists a mixture of states exhibiting both irreversible and reversible AFM-FM transitions.18,23,24It appears that the unusual magnetic corre-lations in Gd5Ge4originate from the anisotropy of exchange interactions that arises from the presence of the distinctly two-dimensional slabs exhibiting varying interslab interac-tions and bonding.
A few basic magnetic properties of a Gd5Ge4single crys-tal were recently investigated.25It was postulated that below the Néel temperature, the magnetic moments of Gd are fer-romagnetically coupled within each slab but the slabs are antiferromagnetically coupled along the caxis in low mag-netic fields共Hⱕ⬃8 kOe兲. This assumption was supported by a recent microscopic study of the magnetic structure of a single crystal of Gd5Ge4 performed by x-ray resonant mag-netic scattering measurements.26Interestingly, a fully revers-ible spin-flop transition was observed at 4.3 K when a mag-netic field of⬃8.4 kOe was applied along thecdirection.25 To date, data about anisotropy of the magnetic properties of Gd5Ge4are limited to Ref.25which reports isothermal mag-netization at 4.3 K and isofield magmag-netization in several fixed magnetic fields.
PHYSICAL REVIEW B74, 024401共2006兲
In this work, we study details of the magnetic anisotropy by both the isothermal M共H兲 and isofield M共T兲 measure-ments along the three principal axes of the crystal. Since the ground state of Gd5Ge4 is an antiferromagnet, we examine both the anisotropy of the AFM state and the anisotropy of the magneto-structural transition. Finally, the magnetic phase diagrams with the magnetic field vector applied along the three principal crystallographic axes are constructed.
II. EXPERIMENTAL DETAILS
A single crystal of Gd5Ge4 was grown using the tri-arc pulling technique starting with a polycrystalline ingot with the same nominal chemical composition.27 Polycrystalline Gd5Ge4was prepared by arc melting stoichiometric amounts of high purity Gd and Ge metals under an argon atmosphere. The gadolinium metal 共99.9 at. % pure兲 was obtained from the Ames Laboratory Materials Preparation Center28 and contained the following major impurities 共in parts per 106 atomic兲: O, 440; C, 200; H, 160; N, 90; Fe, 40; and F, 30. The Ge metal was better than 99.99 at. % pure and it was purchased from Meldform Metals, Inc. The ingot was flipped and melted several times to ensure homogeneity. The arc melted button was used as the charge material in a tri-arc furnace. A tungsten rod was used as the seed material, which resulted in a randomly oriented Gd5Ge4 crystal. The as-grown single crystal was oriented by back-reflection Laue x-ray diffraction and a cubelike sample with its faces parallel to the共100兲,共010兲, and共001兲crystallographic planes was cut from a large single crystalline grain by the spark erosion technique. Final dimensions of the sample were 1.22⫻1.23 ⫻1.30 mm3.
The magnetization measurements were performed in a commercial共Quantum Design兲superconducting quantum in-terference device 共SQUID兲 magnetometer, model
MPMS-XL, over a temperature range of 2 – 300 K and a magnetic field range of 0 – 70 kOe. Each measurement sequence was recorded after the sample was zero field cooled共ZFC兲from the paramagnetic共PM兲state at 300 K. In the ZFC isothermal
M共H兲 scans, the first measurement includes the first field increase and the subsequent field reduction. The second field increase was performed immediately after the first measure-ment. During the measurements, the deviation of the align-ment of the magnetic field vector with the crystallographic directions of the single crystal was less than⬃5°.
III. EXPERIMENTAL RESULTS
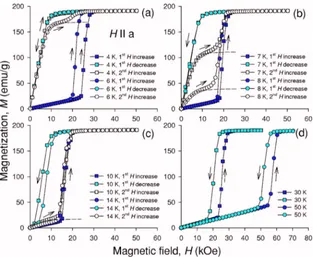
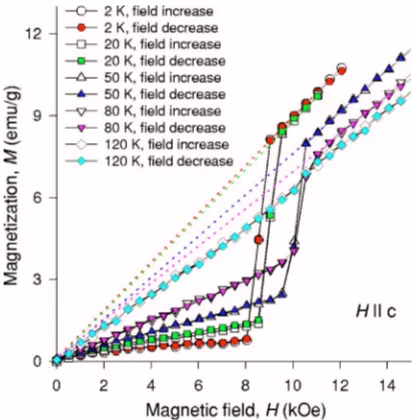
Figures1and2show the isothermal magnetization curves of the ZFC Gd5Ge4 single crystal measured with the mag-netic field vector parallel to the crystallographic a, and c
axes, respectively 共magnetization data along theb axis are similar to those shown in Fig. 1, the major differences are slightly lower critical magnetic fields and narrower hyster-esis at 30 K and 50 K兲. The M共H兲 curves exhibit the AFM-FM transition similar to that reported for polycrystals.17,18,20,23 In polycrystalline samples, however, the field-increasing branches of the ZFCM共H兲 curves mea-sured below ⬃9 K present two metamagnetic features, as illustrated in Fig.3, for two different specimens. The first is usually observed as a nearly discontinuous transition共e.g., at
⬃17 kOe for 6.1 K isotherm兲and the second is a continuous one, which occurs near the saturation of the magnetization
[image:4.612.51.364.54.311.2]共e.g., between⬃18 kOe and 25 kOe for the 6.1 K isotherm兲. We note that a similar continuous transition in addition to a sharp metamagneticlike feature was observed in polycrystal-line Gd5Ge4by Hardyet al.,29but the origin of the anomaly was left without a discussion. Such a two-step metamagnetic transition is quite unusual and is obviously an intrinsic prop-erty of polycrystalline Gd5Ge4regardless of the source of the
material 共the two samples from Fig. 3 have been prepared from high purity Gd,28while the sample in Ref.29was made using commercial, “99.9% pure” Gd metal兲. At Tⱖ9.7 K, the second feature on theM共H兲 curves disappears. We be-lieve that either of the two following mechanisms may be responsible for the differences in the behaviors ofMwithH
in a single crystal and in a polycrystal. First, the tail-like metamagnetic features in polycrystalline samples may be re-lated to kinetic arrest of the first-order magneto-structural transition.30As temperature increases to⬃10 K, thermal en-ergy overcomes kinetic limitation and the high-field tail gradually disappears. Second, as seen in Figs. 1 and2, the critical magnetic fields,Hcr, are different for different crys-tallographic directions. Furthermore,Hcrare temperature de-pendent and the rates of their change with temperature are also different. Thus, the high-fieldM共H兲 tails observed im-mediately after the sharp steps in the polycrystal data共Fig.3兲
may be reflective of the magnetocrystalline anisotropy of Gd5Ge4coupled with a complex preferred orientation of the grains in the as-solidified arc-melted buttons.
A. Anisotropy of the AFM state
The anisotropy of the AFM state of Gd5Ge4 is marked first by a spin-flop transition observed along thecaxis. The magnetization increases nearly linearly for thea andb axes with increasing magnetic field regardless of temperature, but the magnetic behavior along thec axis is quite different. A nearly discontinuous steplike transition is observed at vari-ous temperature-dependent critical fieldsHsf. On both sides ofHsf, the magnetization along thecaxis varies linearly but with a different slope. BelowHsf, the slope is much smaller, indicating a more complete compensation of the magnetic moments. This picture agrees with a model where the anti-ferromagnetic coupling of the Gd moments occurs along the
c axis, as suggested in Refs. 25 and 26. The temperature
behaviors ofHsfand dc magnetic susceptibility in the AFM state are illustrated in Figs. 4 and 5. The critical field Hsf
[image:5.612.51.363.56.310.2]increases nonlinearly from⬃8.3 kOe at 2 K and then satu-rates at 10.3 kOe between 80 K and 128 K. With increasing temperature,dM/dHincreases before and decreases after the spin-flop transition, leading to a gradual reduction of the step at Hsf. The M共H兲 discontinuity becomes a minor slope
FIG. 2. 共Color online兲 The magnetic field dependencies of the magnetization of the ZFC single crystal of Gd5Ge4measured when the magnetic field vector is paral-lel to thecaxis. The dashed lines show the extrapolated magnetic behavior without the magnetic field-induced AFM-FM transition during the second field-increasing measurement. The arrows marked
Hsfpoint to the anomalies associ-ated with a spin-flop transition.
FIG. 3. 共Color online兲The magnetic field dependencies of the magnetization of two different ZFC polycrystalline Gd5Ge4samples
measured at nearly the same temperatures. The data for sample 1 are taken from Ref.23; the magnetization data of sample 2 were measured in an extraction magnetometer共Lake Shore兲using a piece of a different arc-melted alloy button with the same nominal composition.
MAGNETIC ANISOTROPY AND MAGNETIC PHASE¼ PHYSICAL REVIEW B74, 024401共2006兲
[image:5.612.332.540.417.650.2]change atT= 120 K and it disappears aboveTN⬵128 K. Ex-trapolating theM vs H behavior aboveHsftoH= 0共dotted lines in Fig. 4兲 shows that M approaches zero as H ap-proaches zero, and therefore, the magnetic structure remains AFM with a nearly zero spontaneous magnetization but with a larger magnetic susceptibility when compared to the nor-mal AFM Gd5Ge4 共i.e., the zero magnetic field state of the compound兲. The M共H兲 curves for both the field-increasing and the field-decreasing branches coincide with each other, showing that the field-induced spin-flop transition is fully reversible and nonhysteretic. We note that in the second
H-increasing measurement, the spin-flop transition along the
caxis is only observed above 7 K共see Fig.2兲.
The anisotropy of the AFM state is also manifested in the isofield magnetization data. Figure6shows the ZFC heating and field cooling 共FC兲 M共T兲 curves measured both in low
关H= 0.5 kOe, 3 kOe, and 10 kOe, Figs.6共a兲–6共c兲兴and high fields 关H= 20 kOe and 50 kOe, Figs. 6共d兲–6共f兲兴. An AFM-PM transition is observed along all three axes at TN. With decreasing temperature, theM共T兲curves exhibit a pro-found anisotropy in low magnetic fields. No states other than the normal AFM Gd5Ge4 are observed in the 0.5 kOe and 3 kOeM共T兲curves. The same is true for the 10 kOe applied field along thea axis, where a kink is observed at ⬃14 K, below which the ZFC and FCM共T兲 curves diverge slightly
关Fig.6共a兲兴. Thec-axis M共T兲curve 关Fig.6共c兲兴exhibits a re-versible spin-flop transition at⬃50 K and a kink at⬃14 K, which is similar to that observed along theaaxis in Fig.6共a兲. When a 10 kOe magnetic field is applied along the b axis
关Fig.6共b兲兴, Gd5Ge4is no longer in a purely AFM state. The magnetic field dependence of the spin-flop transition is fur-ther illustrated in more detail in Fig.7, in which the 0.5, 3, and 10 kOe data from Fig.6 are also included.
With the occurrence of the spin-flop transition, Gd5Ge4 exhibits at least two distinct AFM states共see Figs.4and7兲.
WhenH⬍8.3 kOe, the “normal” AFM state is stable at all temperatures belowTN. WhenH⬎10.3 kOe is applied along the c axis, the spin-flop AFM structure exists in the same temperature range and when 8.3 kOe⬍H⬍10.3 kOe, the stability of either state becomes temperature dependent. As deduced from the results presented in Figs.4and7, the mag-netic moments of Gd below 128 K are coupled antiferromag-netically along the c axis when the applied field is below 8.3 kOe. With the spin-flop transition, the AFM coupling of the Gd magnetic moments changes its direction from parallel to perpendicular to thecaxis.
To explore the details of the anisotropy of the AFM state, the 0.5 kOe ZFC and FCM共T兲curves are shown together in Fig.8共a兲. We note that the FCM共T兲curves diverge from the ZFC curves below⬃60 K for thea andcaxes, and below
⬃40 K for the baxis. On the other hand, theH= 3 kOe and higher fieldM共T兲curves follow one another closely as long as Gd5Ge4remains AFM for both ZFC and FC states down to⬃14 K, below which they become slightly divergent共also see Fig.6兲. Furthermore, when the magnetic field is parallel to the a or the b axis, the magnetization in the AFM state decreases with increasing temperature. Chattopadhyay et al.31 report a similar behavior for a polycrystalline sample, attributing this to spin fluctuations and FM correlations ap-parently present in the sample. The 0.5 kOeM共T兲curves for thea andb axes diverge belowTN关see Fig.8共a兲兴, which is different from the 8 kOe data of Ref.25and from our data above 3 kOe 关Fig.8共b兲兴 indicating that the M共T兲 curves in the AFM state above 3 kOe always nearly overlap for thea
[image:6.612.335.539.53.299.2]andbaxes. That is, the anisotropy of the AFM state between the a and theb axes at low temperatures and low fields is weak, and a 3 kOe field is high enough to completely
FIG. 4.共Color online兲The field dependencies of the magnetiza-tion of the ZFC Gd5Ge4single crystal measured at different
[image:6.612.70.277.55.265.2]tem-peratures when the magnetic field vector is parallel to thec axis. The dotted lines represent linear extrapolations of theM共H兲 behav-ior above the spin-flop transition to a zero magnetic field.
suppress this anisotropy. When the field vector is applied along thecaxis, the magnetization increases with increasing temperature, resembling the earlier reported results.25 Ex-trapolating the 0.5 kOeH储cM共T兲curve to zero temperature, suggests that the magnetization remains larger than zero due to the incompletely compensated moments. A similar conclu-sion can be drawn from the 0.1 kOe data reported in Ref.26. The difference of the magnetization between thec axis and the other two axes, as shown in the inset of Fig.8共a兲, varies almost linearly below TN, indicating that the anisotropy in the AFM state increases nearly linearly with decreasing tem-perature.
The magnetic anisotropy in the AFM state observed in the isothermal M共H兲 and isofield M共T兲 measurements can be understood by considering the configuration of Gd moments with respect to the external magnetic field. When the mag-netic field is parallel to thea orb axis, the spin axis of the Gd moments 共i.e., the c axis兲 is perpendicular to the field vector. Thus, the magnetization decreases with increasing temperature as follows from Néel’s model32 and from pos-sible FM spin fluctuations in the sample. However, when the field vector is applied along thecaxis, the spin axis of the Gd moments is also parallel to the field vector. This AFM state is denoted as the normal AFM state because of its simi-larity to the classical magnetic behavior of an antiferromag-net 关see Fig. 8共a兲兴. Since the magnetic susceptibility along
the a axis,a 共or the b axis,b兲, is always larger than that along thec axis,c, the energy of magnetization below TN given byE= −共1 / 2兲H2 is always lower for thea axis orb axis than for thec axis. The thermodynamically stable sys-tem must have the lowest magnetic energy, and therefore, the whole spin arrangement along thecaxis tends to rotate so as to make its spin axis perpendicular to the external field. Néel32predicted that such a flopping of the spin axis should occur when the field reaches some critical value. The critical field is determined by the magnitude of the magnetocrystal-line anisotropy. For the present sample, the required critical field lies between ⬃8.3 kOe and ⬃10.3 kOe for 2 K⬍T
⬍TN. Accordingly, the directions of the Gd moments in the spin-flop AFM state共within theab plane兲are perpendicular to the magnetic field vector 共i.e., thec axis兲. The magnetic behavior of the spin-flop AFM state is therefore expected to be similar to that along thea andb axes关see Figs. 5共b兲and
[image:7.612.52.362.53.428.2]8共b兲兴, where the magnetic field vector is also perpendicular to the directions of the Gd moments. Therefore, the AFM state anisotropy is considerable only at low temperatures and in low magnetic fields. Raising the temperature and the mag-netic field decreases the differences in the magmag-netic energy between theaaxis共and thebaxis兲and thecaxis, and there-fore, reduces the magnetocrystalline anisotropy of the com-pound in the AFM state.
FIG. 6. 共Color online兲 The ZFC heating共solid points兲and FC
M共T兲 curves共open points兲 of the single crystal of Gd5Ge4measured
atH= 0.5 kOe, 3 kOe, and 10 kOe
关共a兲, 共b兲, and共c兲兴and H= 20 kOe and 50 kOe关共d兲,共e兲, and共f兲兴with the magnetic field vector parallel to thea,b, andcaxes.
MAGNETIC ANISOTROPY AND MAGNETIC PHASE¼ PHYSICAL REVIEW B74, 024401共2006兲
B. Anisotropy of the AFM-FM transition in Gd5Ge4
The anisotropy of the magnetic field-induced AFM-FM transition is prominent. As shown in Figs.1and2, the field induced AFM-FM transition is not as sharp as one might expect for a single crystal, i.e., it starts at a certain critical fieldHc1 and ends at a higher critical field Hc2. The critical fields decrease with increasing temperature, reaching direc-tionally dependent minima at ⬃14 K, and above this tem-perature, bothHc1 andHc2 begin to increase with tempera-ture共see Fig. 9兲. The values of the critical fields vary with the crystallographic directions. Between 2 K and 50 K, the values ofHc1andHc2 for theb axis are notably lower than those for thecaxis, and the latter are lower than those along the a axis. The minimum of Hc1 and Hc2 along the b axis indicates that the compound is more easily converted into the FM state with field applied in this direction compared with the other two axes. The difference between the critical fields along different axes is large at low temperature, graduallydi-minishing as temperature rises, indicating the reduction of the magnetocrystalline anisotropy.
[image:8.612.70.274.56.267.2]During the second increase of the magnetic field, the mag-netization follows the first demagmag-netization curve at 2 K共not shown in Figs. 1 and 2 for conciseness兲, signaling that the entire sample remains in the FM state, i.e., the field-induced AFM-FM transition is irreversible and once the FM phase is formed, it is stable at this temperature after removing the magnetic field. However, the magnetization curves at 4 K do not precisely follow the first demagnetization path. Above 4 K, a steplike ferromagnetic behavior is seen in low fields. The saturation magnetization of the low-field FM state, esti-mated as shown by the dashed lines in Figs. 1 and 2, de-creases with temperature and nearly disappears at ⬃14 K,
FIG. 7.共Color online兲The ZFC heatingM共T兲curves of Gd5Ge4 single crystal measured when the magnetic field vector is parallel to thecaxis.
FIG. 8.共Color online兲 共a兲The ZFC heating and FCM共T兲curves of the single crystal of Gd5Ge4measured atH= 0.5 kOe. The inset is the ZFC magnetization difference betweenMc andMa共Mb兲.共b兲
[image:8.612.332.540.56.342.2]TheM共T兲curves in the AFM state extracted from theM共T兲curves shown in Fig.6.
[image:8.612.51.363.573.728.2]pointing to the temperature associated with the minimum of
Hc1 and Hc2. Hence, between ⬃4 K and ⬃14 K, the first application of field induces the FM phase in the entire AFM sample. When the field is removed, a fraction of the sample volume is converted back into the AFM state, whereas the rest of the sample still remains in the FM state. That is, both the irreversible and reversible AFM-FM transformations co-exist in this temperature range. Considering that dM/ dH
curves in the steplike magnetization region show no spin-flop anomaly below 7 K and that the AFM state involved in the AFM-FM transition along thecaxis is the spin-flop AFM state, it is likely that the recovered AFM state is only the spin-flop AFM state below 7 K and a mixture of the normal and the spin-flop AFM states above 7 K. Above⬃14 K, the
M共H兲 curves in the second application of field nearly coin-cide with those in the first field-increasing measurement be-cause there is no residual FM phase after the first measure-ment cycle. Thus, the AFM-FM transition becomes fully reversible above ⬃14 K exhibiting directionally dependent hysteresis. We recall that a polycrystalline sample also shows a similar mix of reversibility and irreversibility of the AFM-FM transition, but the temperature range where the two types of transitions coexist is between ⬃10 K and
⬃20 K.18,23
The residual contents of the FM phase along the three axes, evaluated from the low field magnetization steps in the secondH-increasing M共H兲 curves by computing a ratio of the saturation magnetization at individual temperatures, are illustrated in Fig. 10. The temperature dependencies of the residual FM phase content exhibit inverseSshapes, which is different when compared with a polycrystalline sample, where the residual FM content, derived by initially magne-tizing the sample at 4.5 K by a 56 kOe field and then warm-ing in a zero field up to the measurement temperature, varies linearly between⬃10 K and⬃21 K.23 Notably, the residual FM amount also shows a directional dependence: between 4 K and 14 K, and especially from 7 to 10 K, it is the largest along thebaxis and the smallest along thecaxis. As a result,
the reversibility of the AFM-FM phase transition is best when the field is applied along the c axis and it is most incomplete when the magnetic field is applied parallel to the
b axis. Different factors may play a role in the varying completion of the FM→AFM transition upon removal of the magnetic field between 4 and 14 K. First, the maximum re-tention of the FM phase with the magnetic field applied along theb axis is consistent with this being the easy mag-netization direction 共see next paragraph兲. Second, the best reversibility with the magnetic field applied along thecaxis is commensurate with the recovery of the normal AFM state occurring around 8.5 kOe in this temperature range关see Fig.
5共a兲兴. Finally, even though the domain structure of the ferro-magnetic Gd5Ge4 is unknown, it is safe to assume that it is highly anisotropic and similar to that observed in a single crystal Gd5Si2Ge2. The latter has the same crystal structure in the ferromagnetic state and exhibits stripe domains when viewed along theaaxis, a rosette domain pattern typical of a soft uniaxial ferromagnet when viewed along thebaxis, and practically no magnetic contrast when viewed along the c
axis.33
We now discuss the anisotropy of the FM-AFM transition based on the results described above. In Fig. 11 the
H-decreasing M共H兲 branches are compared at several tem-peratures. The magnetization always exhibits a rapid fall off at a certain critical field Hc3. Below ⬃4 K, the AFM-FM transition is irreversible and the FM→AFM transition does not occur at all. The critical fields are anisotropic, i.e.,Hc3共
b axis兲⬍Hc3 共a axis兲⬵Hc3 共c axis兲. Since Gd5Ge4 is a col-linear ferromagnet aboveHc3, the same fields are expected to be the values where magnetization reaches saturation during the second field application at these temperatures. Therefore, the system exhibits a strong ferromagnetic anisotropy be-tween theb axis anda or caxis, showing that theb axis is the easy magnetization direction in the FM state of Gd5Ge4. The M共H兲 curves nearly overlap with each other for the a
axis and thecaxis, showing no anisotropy between these two “hard magnetization” directions. Between⬃4 K and 14 K, where a certain fraction of the sample preserves the FM state, the system shows behavior similar to that below 4 K. At and above 14 K, Gd5Ge4maintains the notable anisotropy of the FM→AFM transition that now starts atHc3and ends at Hc4. The a-axis M共H兲 demagnetization curve no longer overlaps with thec-axisM共H兲curve. The values ofHc3and
Hc4 remain the smallest along theb axis at temperatures as high as 30 K关Fig.11共d兲兴.
The anisotropy of the AFM-FM transition is also mani-fested in theM共T兲curves shown in Fig.6. The 50 kOeM共T兲
curves exhibit sharp FM-AFM transitions at TC=⬃50 K. The ZFC data and the FC data almost overlap showing little to no hysteresis, which is different from polycrystalline data, where a hysteresis of about ⬃8 K was observed.18 With magnetic field decreasing to 20 kOe, directionally dependent temperature hysteresis gradually sets in. The hysteresis is larger along thea axis than the other two axes, yet it always remains lower than that of a polycrystal. The ZFC M共T兲
curves for thea andcaxes exhibit an AFM→FM transition followed by an FM→AFM transition, while the FC M共T兲
[image:9.612.69.276.58.217.2]curves only exhibit an AFM→FM transition and the sample
FIG. 10. 共Color online兲 The temperature dependence of the amount of the residual FM phase in the single crystal of Gd5Ge4 after the first magnetization. The FM content is evaluated from the low field steps in the M共H兲 curves by computing a ratio of the saturation magnetization at individual temperatures. The polycrystal data共Ref.23兲are shown for comparison.
MAGNETIC ANISOTROPY AND MAGNETIC PHASE¼ PHYSICAL REVIEW B74, 024401共2006兲
remains in the FM state down to the lowest temperature, i.e.,
⬃4 K. This is consistent with the isothermal magnetization results, where Figs.1共a兲and2共a兲show that the 20 kOe field is belowHc1 of the low temperature M共H兲 curves, thus the FM state cannot be induced by isothermally magnetizing the sample up to 20 kOe at 4 K along the a and c axes. As temperature increases beginning from 4 K,Hc1for these two directions lowers, soon becoming smaller than the 20 kOe field surrounding the sample, thus resulting in the temperature-induced AFM-FM transformation. The high temperature FM-AFM transition occurs when the critical magnetic fields begin to increase again above 14 K eventu-ally exceeding 20 kOe. However, the 20 kOe ZFC M共T兲
curve along thebaxis shows only one high temperature FM-AFM transition. This can be related to the fact that the 20 kOe field is higher thanHc1between⬃4 and 30 K. When
H= 10 kOe, theb-axisM共T兲curves still show AFM-FM and FM-AFM transitions, while the a- and c-axesM共T兲 curves no longer show any FM state.
It is believed that the observed anisotropy is related to the anisotropy of the two crystal structures adopted by the Gd5Ge4system in the AFM and FM states, both of which are layered with the layers extending in the ac plane that are stacked differently along theb axis. The arrangement of Gd atoms along thea and c axes is quite similar. Hence, it is feasible that in the spin-flop AFM state, the Gd moments remain ferromagnetically coupled within the layers but the interlayer coupling becomes AFM along thea axis. Hence, during the AFM-FM transition, the system changes its mag-netic state from AFM coupling along theaaxis to become a collinear ferromagnet along the c axis when the magnetic field is applied along this direction, whereas when the mag-netic field is parallel to the a axis, the magnetic state is changed from the AFM state along thecaxis to the collinear FM state along thea axis. In both cases, the Gd moments rotate within theac plane without the involvement of theb
axis. This feature results in the similarity of the anisotropy of
[image:10.612.52.365.54.293.2]the FM state below 4 K, as seen in Fig.11共a兲. The largerHc1 andHc2 along thea axis compared to the caxis 共Fig.9兲is likely related to the anisotropy of the lattice constants and their variation during the AFM-FM transition, in which the value ofadecreases from 7.68 Å in the AFM state to 7.54 Å in the FM state, while the value ofcincreases from 7.76 Å in the AFM state to 7.81 Å in the FM state at 6.1 K.21 The lattice expansion-related energy barrier between AFM and
FIG. 11. 共Color online兲 The
H-decreasingM共H兲 curves of the single crystal of Gd5Ge4measured
at T= 4 K, 8 K, 14 K, and 30 K
共see also Figs.1and2兲.
FIG. 12. 共Color online兲 The temperature dependencies of the reciprocal magnetic susceptibilityH/Mof the Gd5Ge4single
[image:10.612.333.539.407.683.2]FM states is larger for theaaxis than for thecaxis, leading to the largerHc1andHc2along theaaxis关and to the smaller
Hc3andHc4along the same axis, see Figs.11共b兲–11共d兲兴. The arrangement of the Gd atoms along thebaxis is quite different from the other two directions. When the magnetic field vector is applied along this axis, the system changes its magnetic state from AFM state along thec axis to the col-linear FM state along thebaxis, which is also quite different from the case when the field vector is parallel to the other two axes. The Ge–Ge bonds between the layers stacked along theb axis are broken before the AFM-FM transition and they become connected after the transition. The distinct uniqueness of the magnetic and crystal structures along theb
axis defines this axis as the easy magnetization direction of the compound. In this direction, the free energy difference between the AFM state and FM state is likely smallest com-pared with the other two axes, which causes the smallest values ofHc1andHc2along thebaxis. Once the FM phase is formed in this direction, it is harder to be converted back into the AFM state共see Figs.10 and11兲. We, therefore, believe that the distinctly anisotropic mechanism of the martensitic-like structural transformation, which proceeds via the shear displacements of the slabs along the a axis and produces changes in both the chemical bonding and magnetic ex-change interactions along thebaxis 共each slab shears along theaaxis by as much as⬃0.45 Å with respect to its nearest neighbor slab21兲, plays a significant role in bringing about the anisotropic features of the magnetization discussed above. We note that the magnetocrystalline anisotropy was also
ob-served in some other Gd-based materials, such as single crys-tals of Gd2PdSi3,5 Gd
2CuO4,6 and GdCu2,34,35 although the nature of the anisotropy in these compounds is likely differ-ent from that of Gd5Ge4.
It is worth noting that consistent with the stability of the crystal structure of Gd5Ge4, no anisotropy is found during the AFM-PM transition. Figure12shows the reciprocal mag-netic susceptibility共H/M兲at 0.5 kOe. All the curves follow Curie-Weiss law above⬃160 K, showing no anisotropy共the paramagnetic Weiss temperatures, p, are 94 K and the ef-fective magnetic moments, pef f, are 7.94 B/ Gd, in nearly ideal agreement with that of a free Gd3+ion兲.
C. Magnetic phase diagrams
Based on the results presented above, we plot in Fig.13
the magnetic phase diagrams along the three axes. The left panels关Figs.13共a兲–13共c兲兴are for the initial magnetization of the zero field cooled sample and, correspondingly, the right panels关Figs.13共d兲–13共f兲兴are for the second isothermal mag-netization of the sample. As in the polycrystalline sample,TN
[image:11.612.48.365.389.735.2]slowly decreases with increasing magnetic field. The values of Hc1 andHc2 first decrease and then increase with the in-creasing temperature. Both exhibit a minimum around 14 K for the three axes. An extrapolation of the curves along each axis, shown by the dashed lines in Figs.13共a兲–13共c兲, results in a tricritical point withHtcr=⬃140 kOe, above which the AFM state is completely suppressed, andTtcr=⬃90 K. It is worth noting that a recent high field study of a low purity
FIG. 13.共Color online兲TheH
-T magnetic phase diagrams of single crystal of Gd5Ge4along the three principal crystallographic axes, in which the symbols共•兲and
共ⴰ兲 are the critical fieldsHc1 and
Hc2, respectively, obtained from
M共H兲curves, the symbols共䊏兲are the data derived from the M共T兲
curves, and the symbols共䉱兲 are the data of Hsf. The plots on the left are for the initial magnetiza-tion of the ZFC single crystal. Ex-trapolations for magnetic fields exceeding 5 T shown by the dashed lines assume that both the AFM-FM and AFM-PM bound-aries follow the corresponding boundaries established for poly-crystalline Gd5Ge4 共Refs. 17 and
23兲. The plots on the right are for the second isothermal magnetiza-tion of the same crystal with only the low-temperature parts shown for clarity because above ⬃14 K the initial magnetization and the second magnetization diagrams are indistinguishable for the same direction.
MAGNETIC ANISOTROPY AND MAGNETIC PHASE¼ PHYSICAL REVIEW B74, 024401共2006兲
polycrystalline Gd5Ge4sample by Casanovaet al.36reported the same coordinates of the tricritical point: Htcr =⬃140 kOe andTtcr=⬃90 K.
In the H-T diagrams representing the second magnetiza-tion, the AFM-PM transition boundary is the same as that of the initial magnetization and is hence omitted for clarity in Figs.13共d兲–13共f兲. The low-temperature parts in each of these three diagrams where the AFM state is partially recovered after the first application of the magnetic field can be re-garded as a superposition of a series of discrete diagrams, which is illustrated in Fig. 14. In each of these diagrams, there is no coexistence of the AFM and FM states but the AFM phase region simply extends to a different lowest tem-perature,Ti共i= 1 , 2 , . . . ,m兲, where the AFM phase transforms into the FM phase isothermally. The result of the superposi-tion is that between⬃4 K and⬃14 K, there exists a mixture of FM and AFM states, as is observed experimentally. Con-sidering that the amounts of the recovered FM phase vary as shown in Fig.10, a fraction of the sample volume character-ized by the diagrams whereTiis ⬃6 K to⬃8 K is greater compared with diagrams havingTibetween 4 K and 6 K and between 8 K and 14 K. This deviation from a monotonic distribution of Ti’s is likely associated with a peculiar microstructure37,38and/or stress fields distributed anisotropi-cally across the single crystal. We note that in the polycrys-talline samples, the linear variation of the residual FM phase with temperature between⬃10 K and⬃21 K共Refs.18and
23兲suggests that the sample fraction matching each discrete diagram is the same, as is expected for a polycrystal with a large number of randomly oriented and sized crystallites. In addition, according to Chattopadhyayet al.,30the kinetics of the AFM-FM transition is arrested at low temperatures, thus the residual FM state shown in Fig. 10 may actually the trapped FM state. Obviously, the effect of kinetic arrest, if any, of the AFM-FM transition is weaker in the single crystal
共starts at⬃14 K兲than in the polycrystal 共starts at ⬃21 K兲. Note that temperatures at which the kinetic arrest develops are different although the range of temperatures over which the system becomes completely arrested is nearly identical
共⬃10 K for the single crystal and ⬃11 K for the polycrys-tal兲. In the single crystal, the FM phase is arrested very rap-idly when temperature is reduced to ⬃8 K, while the trap-ping process in the polycrystal is much more gradual, which correlates with the simpler Sm5Ge4-type共AFM兲/Gd5Si4-type
共FM兲domain structure in the single crystal compared to the polycrystal.
The anisotropy of the phase diagram is noticeable 共see also Fig.9兲. The values ofHc1 andHc2along the three axes are different at the same temperature. The AFM state with field along the c axis is divided into two regions—normal AFM and spin-flop AFM states. From theH-T diagram of the initial magnetization关Fig.13共c兲兴, whenT⬍TN, the spin-flop transition from the normal AFM state to the spin-spin-flop AFM state can be observed in theM共H兲 curves along thec
axis. The spin-flop transition can be also observed in the
M共T兲 curves when 8.3 kOe⬍H⬍10.3 kOe. From the H-T
diagram of the second magnetization 关Fig.13共f兲兴, the spin-flop transition can be only observed in the temperature range 7 K⬍T⬍TNin the M共H兲curves. When 4 K⬍T⬍7 K, the residual AFM state is only retained in the spin-flop AFM state. Therefore, the increase of the reversibility of the AFM-FM transition with temperature increases the content of normal AFM phase.
IV. CONCLUSIONS
A reversible spin-flop transition along thecaxis occurs in a single crystal of Gd5Ge4 at various magnetic fields
共8.3 kOe– 10.3 kOe兲and temperatures 共2 K – 128 K兲, which is not observed when the field is applied along thea andb
[image:12.612.52.363.57.277.2]axis. This anisotropy can be understood by considering the configuration of the Gd moments in the AFM state with re-spect to the magnetic field vector. In the normal AFM state, the configuration of the Gd moments along the c axis is different from the AFM state along theaandbaxes. Increas-ing temperature reduces the magnetization difference be-tween these axes, and thus, reduces the anisotropy of the AFM state. In the spin-flop AFM state, the configuration of
the Gd moments along the c axis becomes similar to that along theaandb axes in the normal AFM state, resulting in the similarity of the magnetic properties in the AFM state. Thus, increasing the magnetic field effectively decreases the anisotropy of the AFM state. The fully irreversible AFM-FM transition is observed at low temperatures 共below ⬃4 K兲; above ⬃14 K, the same transformation becomes fully re-versible. Between⬃4 and⬃14 K there is a mixture of both transitions. The resultant residual FM content is larger for the
baxis than for theaandcaxes at the same temperature, and accordingly, the critical field for the AFM-FM transition along thebaxis is smaller than that along the other two axes. In the FM state, thebaxis is the easy magnetization direction
of the compound. The anisotropy of the AFM-FM transition is consistent with the anisotropic features of the distinctly layered crystal structures of the two polymorphic modifica-tions of the compound despite negligible single ion aniso-tropy of the Gd3+ ion. The magnetic phase diagrams exhibit clear anisotropy.
ACKNOWLEDGMENTS
The Ames Laboratory is operated for the U.S. Department of Energy by Iowa State University. This work was sup-ported by the Office of Basic Energy Sciences, Materials Sciences Division of the U.S. Department of Energy under Contract No. W-7405-ENG-82.
*Corresponding author. Email address: vitkp@ameslab.gov
1Jong-Soo Rhyee, B. K. Cho, and H. C. Ri, J. Appl. Phys. 93,
8346共2003兲.
2M. Okazaki, N. Tanaka, and K. Motizuki, J. Appl. Phys.87, 4876
共2000兲.
3G. Uimin and W. Brenig, Phys. Rev. B 61, 60共2000兲. 4M. D. Kuzmin, Phys. Rev. B 51, 8904共1995兲.
5S. R. Saha, H. Sugawara, T. D. Matsuda, H. Sato, R. Mallik, and
E. V. Sampathkumaran, Phys. Rev. B 60, 12162共1999兲.
6A. Butera, M. Tovar, S. B. Oseroff, and Z. Fisk, Phys. Rev. B 52,
13444共1995兲.
7V. K. Pecharsky and K. A. Gschneidner, Jr., Phys. Rev. Lett. 78,
4494共1997兲.
8V. K. Pecharsky and K. A. Gschneidner, Jr., Appl. Phys. Lett. 70,
3299共1997兲.
9L. Morellon, P. A. Algarabel, M. R. Ibarra, J. Blasco, B.
García-Landa, Z. Arnold, and F. Albertini, Phys. Rev. B 58, R14721
共1998兲.
10L. Morellon, J. Stankiewicz, B. García-Landa, P. A. Algarabel,
and M. R. Ibarra, Appl. Phys. Lett. 73, 3462共1998兲.
11E. M. Levin, V. K. Pecharsky, and K. A. Gschneidner, Jr., Phys.
Rev. B 60, 7993共1999兲.
12W. Choe, V. K. Pecharsky, A. O. Pecharsky, K. A. Gschneidner,
Jr., V. G. Young, Jr., and G. J. Miller, Phys. Rev. Lett. 84, 4617
共2000兲.
13V. K. Pecharsky and K. A. Gschneidner, Jr., Adv. Mater.共
Wein-heim, Ger.兲 13, 683共2001兲.
14L. Morellon, J. Blasco, P. A. Algarabel, and M. R. Ibarra, Phys.
Rev. B 62, 1022共2000兲.
15C. Magen, Z. Arnold, L. Morellon, Y. Skorokhod, P. A. Algarabel,
M. R. Ibarra, and J. Kamarad, Phys. Rev. Lett. 91, 207202
共2003兲.
16V. K. Pecharsky and K. A. Gschneidner, Jr., J. Alloys Compd.
260, 98共1997兲.
17E. M. Levin, V. K. Pecharsky, K. A. Gschneidner, Jr., and G. J.
Miller, Phys. Rev. B 64, 235103共2001兲.
18E. M. Levin, K. A. Gschneidner, Jr., and V. K. Pecharsky, Phys.
Rev. B 65, 214427共2002兲.
19C. Magen, L. Morellon, P. A. Algarabel, C. Marquina, and M. R.
Ibarra, J. Phys.: Condens. Matter 15, 2389共2003兲.
20F. Casanova, A. Labarta, X. Batlle, J. Marcos, L. Mañosa, A.
Planes, and S. de Brion, Phys. Rev. B 69, 104416共2004兲.
21V. K. Pecharsky, A. P. Holm, K. A. Gschneidner, Jr., and R. Rink,
Phys. Rev. Lett. 91, 197204共2003兲.
22Ya. Mudryk, A. P. Holm, K. A. Gschneidner, Jr., and V. K.
Pe-charsky, Phys. Rev. B 72, 064442共2005兲.
23H. Tang, V. K. Pecharsky, K. A. Gschneidner, Jr., and A. O.
Pecharsky, Phys. Rev. B 69, 064410共2004兲.
24F. Casanova, A. Labarta, and X. Batlle, Phys. Rev. B 72, 172402
共2005兲.
25E. M. Levin, K. A. Gschneidner, Jr., T. A. Lograsso, D. L.
Schla-gel, and V. K. Pecharsky, Phys. Rev. B 69, 144428共2004兲.
26L. Tan, A. Kreyssig, J. W. Kim, A. I. Goldman, R. J. McQueeney,
D. Wermeille, B. Sieve, T. A. Lograsso, D. L. Schlagel, S. L. Budko, V. K. Pecharsky, and K. A. Gschneidner, Jr., Phys. Rev. B 71, 214408共2005兲.
27D. L. Schlagel, T. A. Lograsso, A. O. Pecharsky, and J. A.
Sam-paio, inLight Metals 2005, edited by H. Kvande共The Minerals, Metals and Materials Society, Warrendale, PA, 2005兲, p. 1177.
28Materials Preparation Center, Ames Laboratory U.S. DOE, Ames,
IA, USA, www.mpc.ameslab.gov
29V. Hardy, S. Majumdar, S. Crowe, M. R. Lees, D. McK. Paul, L.
Hervé, A. Maignan, S. Hébert, C. Martin, C. Yaicle, M. Hervieu, and B. Raveau, Phys. Rev. B 69, 020407共R兲 共2004兲.
30M. K. Chattopadhyay, M. A. Manekar, A. O. Pecharsky, V. K.
Pecharsky, K. A. Gschneidner, Jr., J. Moore, G. K. Perkins, Y. V. Bugoslavsky, S. B. Roy, P. Chaddah, and L. F. Cohen, Phys. Rev. B 70, 214421共2004兲.
31M. K. Chattopadhyay, M. A. Manekar, A. O. Pecharsky, V. K.
Pecharsky, K. A. Gschneidner, Jr., J. Moore, G. K. Perkins, Y. V. Bugoslavsky, S. B. Roy, P. Chaddah, and L. F. Cohen共 unpub-lished兲.
32L. Néel, Ann. Phys. 5, 232共1936兲.
33J. S. Leib, C. C. H. Lo, J. E. Snyder, D. C. Jiles, V. K. Pecharsky,
D. S. Schlagel, and T. A. Lograsso, IEEE Trans. Magn. 38, 2447
共2002兲.
34M. Rotter, M. Doerr, M. Loewenhaupt, A. Lindbaum, H. Muller,
J. Enser, and E. Gratz, J. Magn. Magn. Mater. 236, 267共2001兲.
35M. Rotter, M. Loewenhaupt, M. Doerr, A. Lindbaum, and H.
Michor, Phys. Rev. B 64, 014402共2001兲.
36F. Casanova, S. de Brion, A. Labarta, and X. Batlle, J. Phys. D
38, 3343共2005兲.
37J. Szade, G. Skorek, and A. Winiarski, J. Cryst. Growth 205, 289
共1999兲.
38O. Ugurlu, L. S. Chumbley, D. L. Schlagel, and T. A. Lograsso,
Acta Mater. 54, 1211共2006兲.
MAGNETIC ANISOTROPY AND MAGNETIC PHASE¼ PHYSICAL REVIEW B74, 024401共2006兲