www.biogeosciences.net/13/3283/2016/ doi:10.5194/bg-13-3283-2016
© Author(s) 2016. CC Attribution 3.0 License.
Evolution of dissolved and particulate chromophoric materials
during the VAHINE mesocosm experiment in the New
Caledonian coral lagoon (south-west Pacific)
Marc Tedetti1, Lauriane Marie1,a, Rüdiger Röttgers2, Martine Rodier3, France Van Wambeke1, Sandra Helias1, Mathieu Caffin1, Véronique Cornet-Barthaux1, and Cécile Dupouy1,4
1Aix Marseille Université, CNRS/INSU, Université de Toulon, IRD, Mediterranean Institute of Oceanography (MIO) UM
110, 13288, Marseille, France
2Helmholtz-Zentrum Geesthacht, Centre for Materials and Coastal Research, Institute for Coastal Research, Remote Sensing,
Geesthacht, Germany
3IRD, Université de la Polynésie française, Institut Louis Malardé, Ifremer, UMR 241, Ecosystèmes Insulaires Océaniens
(EIO), IRD Tahiti, PB 529, 98713 Papeete, Tahiti, French Polynesia
4Institut de Recherche pour le Développement, AMU/CNRS/INSU, Université de Toulon, Mediterranean Institute of
Oceanography (MIO) UM110, 98848 Noumea, New Caledonia
apresent address: Université de Bretagne Occidentale, LEMAR, UMR-CNRS 6539, Groupe Chimie Marine, Place N.
Copernic, 29280 Plouzané, France
Correspondence to:Marc Tedetti ([email protected])
Received: 13 October 2015 – Published in Biogeosciences Discuss.: 29 October 2015 Revised: 6 May 2016 – Accepted: 18 May 2016 – Published: 3 June 2016
Abstract.In the framework of the VAHINE project, we in-vestigated the spectral characteristics and the variability of dissolved and particulate chromophoric materials throughout a 23-day mesocosm experiment conducted in the south-west Pacific at the mouth of the New Caledonian coral lagoon (22◦29.073 S–166◦26.905 E) from 13 January to 4 Febru-ary 2013. Samples were collected in a mesocosm fertil-ized with phosphate at depths of 1, 6 and 12 m and in the surrounding waters. Light absorption coefficients of chro-mophoric dissolved organic matter (CDOM) [ag(λ)] and
par-ticulate matter [ap(λ)] were determined using a point-source
integrating-cavity absorption meter (PSICAM), while fluo-rescent DOM (FDOM) components were determined from excitation-emission matrices (EEMs) combined with paral-lel factor analysis (PARAFAC). The evolutions ofag(λ)and
ap(λ)in the mesocosm were similar to those of total
chloro-phylla concentration,Synechococcus spp. and picoeukary-ote abundances, bacterial production, particulate organic ni-trogen and total organic carbon concentrations, with roughly a decrease from the beginning of the experiment to days 9– 10, and an increase from days 9–10 to the end of the
experi-ment. In the surrounding waters, the same trend was observed but the increase was much less pronounced, emphasizing the effect of the phosphate fertilization on the mesocosm’s plankton community. Correlations suggested that both Syne-chococcus cyanobacteria and heterotrophic bacteria were strongly involved in the production of CDOM and absorp-tion of particulate matter. The increase in phytoplankton biomass during the second part of the experiment led to a higher contribution of particulate material in the absorption budget at 442 nm. The three FDOM components identified (tryptophan-, tyrosine- and ultraviolet C (UVC) humic-like fluorophores) did not follow the evolution of CDOM and particulate matter, suggesting they were driven by different production/degradation processes. Finally, the results of this work support the idea there is indirect coupling between the dynamics of N2fixation and that of chromophoric material
1 Introduction
Besides water itself, light absorption in the marine envi-ronment is due to three main biogeochemical constituents: (1) chromophoric dissolved organic matter (CDOM), also known asgelbstoff, gilvin and yellow substances, and chro-mophoric particulate matter, subdivided into (2) phytoplank-ton (photoautotrophic microorganisms), composed of both prokaryotic (cyanobacteria) and eukaryotic species (diatoms, dinoflagellates, coccolithophores, . . . ), and (3) non algal par-ticles (NAP), comprising organic and minerogenic detritus, and heterotrophic organisms. Absorption spectra of CDOM, phytoplankton and NAP have been extensively studied over the last two decades in various oceanic provinces including coastal waters and open ocean (Blough and Del Vecchio, 2002; Babin et al., 2003; Bricaud et al., 2010; Matsuoka et al., 2014). Indeed, in addition to their key role in the oceanic carbon cycle, these three constituents strongly influence the underwater light field and the apparent optical properties of seawater. The knowledge of their absorption spectra is thus essential for bio-optical modelling and remote sensing ap-plications but can also be used to investigate biological pro-cesses in the ocean.
Absorption coefficients of CDOM [ag(λ)] and NAP
[anap(λ)] typically decrease monotonically (exponentially)
from ultraviolet (UV, 280–400 nm) to visible (400–700 nm) wavelengths (Nelson et al., 1998; Swan et al., 2009; Til-stone et al., 2012). Even though CDOM absorption spectra are usually featureless, some “shoulders” have been observed sporadically in the UV and visible spectral domains and at-tributed to the presence of dissolved absorbing pigments re-leased by phytoplankton cells: mycosporine-like amino acids (MAAs) at 310–320 or at 330–360 nm, and phaeopigments or non-chlorin metal-free porphyrins at 410–420 nm (White-head and Vernet, 2000; Röttgers and Koch, 2012; Organelli et al., 2014; Pavlov et al., 2014). In contrast, absorption co-efficients of phytoplankton [aφ(λ)] determined from natural samples commonly display two main peaks in the visible range, around 435–450 and 675 nm, attributable to its content in total chlorophylla(TChla=mono Chla+divinyl Chla) (Lutz et al., 1996; Dupouy et al., 1997; Bricaud et al., 2004), but may also reveal other peaks or shoulders resulting from the presence of other pigments: MAAs at 325 nm (Bricaud et al., 2010), TChlb, TChlcand photoprotective carotenoids at 460–470 nm, photosynthetic carotenoids and photoprotec-tive keto-carotenoids at 490 nm (Carreto, 1985; Stuart et al., 1998; Wozniak et al., 1999; Lohrenz et al., 2003) as well as phycoerythrin at 550 nm (Morel, 1997). Hence, while chro-mophoric detrital matter (CDM=CDOM+NAP) is the ma-jor contributor to total absorption in the UV domain (∼60– 95 %), in the blue region (440–490 nm), the contributions of CDM and phytoplankton tend to be equivalent (∼40–50 %), while CDOM alone is accounting for∼80–95 % of CDM in the UV and blue ranges (Siegel et al., 2002, 2005; Tedetti et al., 2010; Nelson and Siegel, 2013).
In “Case 1 waters” (Morel and Prieur, 1977), which are generally – but not necessarily – open ocean clear waters, optical properties are controlled by phytoplankton and all its derived material, and TChla concentration may be uti-lized as an index of optical properties thanks to its covaria-tion withaφ(λ),ag(λ),anap(λ)and particulate
backscatter-ing coefficient [bbp(λ)] (Antoine et al., 2014). Due to the
covariation withaφ(λ)in Case 1 waters, CDOM is consid-ered as being a by-product of phytoplanktonic production. Nonetheless, recent studies have highlighted some degree of de-phasing between the dynamics in phytoplankton and that of CDOM at the global, regional or seasonal scale (Siegel et al., 2002; Morel et al., 2010; Xing et al., 2014). Whilst pho-tobleaching is now considered as a major degradation pro-cess of CDOM in surface waters (Del Vecchio and Blough, 2002; Helms et al., 2008; Bracchini et al., 2010; Swan et al., 2012), the main source of CDOM in open ocean is still a matter of debate, particularly for its “humic-like” compo-nent, which absorbs light over a broad range of UV and vis-ible wavelengths and fluoresces in the visvis-ible domain (An-drew et al., 2013). Some works suggest that this humic-like CDOM is in part a remainder of terrestrial matter that has been diluted and transformed during transit to and within the ocean (Blough and Del Vecchio, 2002; Hernes and Benner, 2006; Murphy et al., 2008; Andrew et al., 2013). Conversely, other studies put forward its autochthonous marine source and its production from phytoplankton, including green al-gal, diatoms, dinoflagellates (Vernet and Whitehead, 1996; Romera-Castillo et al., 2010, 2011; Chari et al., 2013), the diazotrophic (N2-fixing) cyanobacteriaTrichodesmiumspp.
(Subramaniam et al., 1999; Steinberg et al., 2004) and the non-diazotrophic picocyanobacteriaSynechococcusspp. and Prochlorococcusspp. (Romera-Castillo et al., 2011), from zooplankton (Steinberg et al., 2004; Ortega-Retuerta et al., 2009), or from the bacterial degradation (mineralization) of phytoplankton-derived organic matter (Nelson et al., 1998, 2010; Swan et al., 2009).
The New Caledonian coral lagoon, located in the south-west Pacific, is a tropical, oligotrophic nutrient low-chlorophyll (LNLC) ecosystem in which diazotrophs such as cyanobacteriaTrichodesmiumspp. (Dupouy et al., 1988, 2008; Masotti et al., 2007; Rodier and Le Borgne, 2010) and diazotrophic picocyanobacteria (Biegala and Raimbault, 2008) but also non-diazotrophic picocyanobacteria such as Synechococcusspp. andProchlorococcusspp. (Biegala and Raimbault, 2008; Neveux et al., 2009) play a significant role. Although the biogeochemical conditions in the New Caledonian coral lagoon are well documented for several years (see review by Grenz et al., 2010), the dynamics of CDOM remains poorly known in this environment. In the framework of the VAHINE (VAriability of vertical and tropHIc transfer of fixed N2in the south wEst Pacific)
through-out a 23-day mesocosm experiment and (2) to tentatively identify the main biogeochemical contributors (diazotrophic and non-diazotrophic primary producers, heterotrophic bac-teria) driving changes in chromophoric material over the course of the experiment. Chromophoric parameters we ex-amined here were absorption coefficients of CDOM [ag(λ)]
and particulate matter [ap(λ)=aφ(λ)+anap(λ)], determined
over the spectral domain 370–720 nm, the spectral slope of CDOM (Sg), computed over the range 370–500 nm, as well
as fluorescent DOM (FDOM) components, determined from excitation-emission matrices (EEMs) combined with parallel factor analysis (PARAFAC).
2 Material and methods 2.1 The mesocosm experiment
2.1.1 Study site and mesocosm description
The VAHINE mesocosm experiment was conducted from 13 January to 4 February 2013 in the south-west Pacific at a mouth of the New Caledonian coral lagoon, 28 km off the coast of New Caledonia (22◦29.073 S–166◦26.905 E) (Fig. 1). At the deployment site the water depth was 25 m and the bottom was sandy. The site was protected by land from the dominant trade winds (SE sector) and characterized by high influence of oceanic oligotrophic waters coming from outside the lagoon through the Boulari passage (Ouillon et al., 2010). Three large mesocosms (hereafter called M1, M2 and M3), of 50 m3volume each, were deployed (Fig. 2). All details concerning the mesocosm design and deployment are given in Bonnet et al. (2016). In brief, the mesocosms con-sisted in large cylindrical bags made of one polyethylene film and one ethylene vinyl acetate (EVA, 19 %) film, each 500 µm thick, with nylon meshing in between to allow max-imum resistance and light penetration. They were 2.3 m in diameter, 15 m in depth and were equipped with removable sediment traps, allowing collection of sinking material. The top of the bags were maintained 1 m above the surface with floats to prevent inflow of external water. Their straightness was maintained by weights at the bottom of the mesocosms. Before starting sampling, the mesocosms were left opened from the bottom for 24 h to insure a total homogeneity of the water column.
2.1.2 Nutrient fertilization
To prevent phosphate limitation, the mesocosms were fertil-ized in the evening of day 4 with dissolved inorganic phos-phorus (DIP) to a final concentration of 0.8 µM (see details of the fertilization procedure in Bonnet et al., 2016). This phosphate fertilization aimed at stimulating the diazotroph activity.
2.1.3 Sampling and in situ measurements
During the 23 days of the experiment, seawater sampling was performed every morning from a 4 m2 floating platform at three depths (1, 6 and 12 m) in each mesocosm and in the surrounding waters close to the mesocosms (“OUT”) using a compressed air-driven, metal-free pump (AstiPure™) con-nected to a polyethylene tubing. Samples were filled into 50 L polypropylene carboys and immediately transported for subsampling and sample treatments onboard the R/VAlis, moored 1 nautical mile away from the mesocosm site. Along with discrete sampling, vertical profiles of tempera-ture, salinity, Chlafluorescence, turbidity and light intensity were obtained daily (at 7 a.m. local time) in each mesocosm and in the surrounding waters using a 911plus conductiv-ity temperature depth (CTD) profiler (Sea-Bird Electronics, Inc.). For our specific parameters, i.e. dissolved and particu-late chromophoric materials, we only sampled the mesocosm M1 at 1, 6 and 12 m depth and the surrounding waters at 1 m depth.
2.1.4 Filtration
Onboard R/VAlis, samples for CDOM absorption and fluo-rescence measurements were immediately filtered under low vacuum (< 50 mm Hg) through 0.2 µm polycarbonate filters (25 mm diameter, Nuclepore) using small, pre-combusted (450◦C, 6 h) glass filtration systems. Prior to sample filtra-tion, the Nuclepore filters were cleaned by first soaking them for several minutes in 1 M HCl, then in ultrapure water, and processing them by filtering through and discarding 300 mL of ultrapure water and lastly 50 mL of the sample. Then, 1 L of the sample was filtered and the 0.2 µm filtrate trans-ferred into pre-combusted Schott®glass bottles for analyses. Powder-free disposable gloves were worn during sampling, filtration and analyses to avoid sample contamination. All ab-sorption coefficient measurements [ag(λ)andag+p(λ)] were
performed directly onboard (see Sect. 2.2), while samples for fluorescence measurements were stored at 4◦C in the dark for several days until analyses.
2.1.5 The two phases of the experiment
Figure 1.Location of the site of the VAHINE mesocosm experiment at the mouth of the New Caledonian coral lagoon, 28 km off the coast of New Caledonia, in the south-west Pacific (Ocean Data View software version 4.6.5, Schlitzer, R., http://odv.awi.de, 2014, and Google Earth).
2.2 Absorption of CDOM and particulate matter
2.2.1 Measurement
Absorption coefficients of CDOM and CDOM+particulate matter [ag(λ) and ag+p(λ)] were determined by
measur-ing absorption of 0.2 µm filtered and unfiltered samples us-ing a point-source integratus-ing-cavity absorption meter (PSI-CAM) instrument as described by Röttgers et al. (2007) and Röttgers and Doerffer (2007). The cavity of the PSICAM was filled with purified water (Milli-Q water), air bubbles were removed from the cavity wall and the central light sphere by gentle shaking, and a reference intensity spec-trum was recorded between 370 and 726 nm. Afterwards, sample water was poured into the cavity in the same way, and a sample intensity spectrum was recorded. The cavity was rinsed and filled with purified water again, and a sec-ond reference intensity spectrum was recorded. The two ref-erence spectra were used to calculate two “transmissions” (sample/reference) and, further, two absorption coefficient spectra. The mean of these two spectra was taken as the real absorption coefficient spectrum. The calibration of the PSICAM consisted of determinations of the total cavity re-flectivity spectrum by using solutions of the dye nigrosine (Certistain®, Merck) with maximum absorption between 1 and 3 m−1. Absorption spectra were corrected for salinity and temperature differences between sample and reference water according to Röttgers and Doerffer (2007). The mean
precision of the PSICAM within the range 370–700 nm is ±0.0008 m−1, whereas its accuracy here is±2 %, even for absorption values < 0.1 m−1.
2.2.2 Particulate absorption and CDOM spectral slope determination
Absorption coefficients of particulate matter [ap(λ)] were
determined by subtracting ag(λ) from ag+p(λ) over the
range 370–720 nm. Spectral slope ofag(λ), Sg (in nm−1),
was computed by applying a nonlinear (exponential), least-squares fit to theag(λ) values between 370 and 500 nm in
accordance with the following formula: ag(λ)=ag(λ0)×e−Sg(λ−λ0).
Figure 2. Pictures of the VAHINE mesocosms deployed at the mouth of the New Caledonian coral lagoon.
2.3 Fluorescence of DOM 2.3.1 Measurements
FDOM measurements were performed on 0.2 µm filtered samples using a Hitachi F-7000 spectrofluorometer. The cor-rection of spectra for instrumental response was conducted from 200 to 600 nm according to the procedure recom-mended by the manufacturer (Hitachi F-7000 Instruction Manual) and fully described in Tedetti et al. (2012). The excitation (Ex) and emission (Em) correction curves were applied internally by the instrument to correct each fluores-cence measurement acquired in signal over reference ratio mode. The samples were allowed to reach room temperature in the dark and transferred into a 1 cm pathlength far-UV transparent silica quartz cuvette (170–2600 nm; LEADER LAB). The sample in the cuvette was kept at 20◦C inside the instrument using a circulating water bath connected to the cell holder. The cuvette was cleaned with 1 M HCl and ultrapure water, and triple rinsed with the sample before use.
EEMs were generated overλExbetween 200 and 500 nm in
5 nm intervals, and λEm between 280 and 550 nm in 2 nm
intervals, with 5 nm slit widths on both Ex and Em sides, a scan speed of 1200 nm min−1, a time response of 0.5 s and a PMT voltage of 700 V. Blanks (ultrapure water) and solutions of 0.1 to 10 µg L−1quinine sulphate dihydrate (Fluka, purum for fluorescence) in 0.05 M sulphuric acid were run with each set of the samples. Two replicates were run for each sample.
2.3.2 Fluorescence data processing
Different processing steps were carried out on the fluo-rescence data: (1) all the fluofluo-rescence data were normal-ized to the intensity of the ultrapure water Raman scat-ter peak atλEx/ λEm of 275/303 nm, measured daily as an
internal standard (Coble, 1996). This value varied by 4 % (n=20). (2) The mean, normalized EEM of ultrapure water was subtracted from normalized sample EEMs to eliminate the water Raman scatter signal. (3) These blank-corrected sample EEMs were converted into quinine sulphate unit (QSU), where 1 QSU corresponded to the fluorescence of 1 µg L−1quinine sulphate atλEx/λEmof 350/450 nm (5 nm
slit widths) (Coble, 1996; Murphy et al., 2008). The conver-sion in QSU was made by dividing each EEM fluorescence data by the mean slope of a linear regression of fluorescence vs. concentration for the different quinine sulphate solutions (i.e. 8.4 arbitrary fluorescence intensity units/QSU).r val-ues of these linear regressions were on average 0.99 and the detection and quantification limits of the fluorescence mea-surements were 0.19 and 0.63 QSU, respectively. The water Raman scatter peak was integrated fromλEm380 to 426 nm
atλExof 350 nm for ultrapure water samples. The mean value
was used to establish a conversion factor between QSU and Raman unit (RU, nm−1), based on the Raman-area normal-ized slope of the quinine sulphate linear regression. The con-version factor was 0.025 RU per QSU. Considering the low ag(λ)values, samples were not corrected for inner filter
ef-fects (Stedmon and Bro, 2008).
2.4 Parallel factor analysis (PARAFAC)
In this work, a PARAFAC model was created and vali-dated for 130 calibrated EEMs according to the method by Stedmon et al. (2003). The EEM wavelength ranges used were 210–500 and 280–550 nm for Ex and Em, re-spectively. EEMs were merged into a three-dimensional data array of the form: 130 samples×59 λEx×136 λEm.
variance, (2) the shape of residuals, (3) the split half analy-sis and (4) the random initialization using the Tucker Con-gruence Coefficients (Tedetti et al., 2012). The fluorescence intensities of each component found are given in QSU. The fluorescence intensities in QSU provided for each sample is the mean of the two replicates with a coefficient of variance (CV) < 10 %.
2.5 Biogeochemical and biological analyses
Filters for the determination of the TChl a concentra-tion were collected by filtering 550 mL of sample wa-ter onto a GF/F filwa-ter (Whatman). The filwa-ters were di-rectly shock-frozen and stored in liquid N2. TChl a was
extracted in methanol and measured by fluorometry (Le Bouteiller et al., 1992). The precision of the measurement was±0.005 µg L−1.
For the determination of phycoerythrin concentration, wa-ter samples (3–4 L) were filwa-tered onto 0.4 µm Nuclepore polycarbonate filters and immediately frozen in liquid N2
un-til analysis. Phycoerythrin was extracted in a 4 mL glycerol-phosphate mixture (50/50) according to Neveux et al. (2009) after vigorous shaking for resuspension of particles (Wyman, 1992), and then quantified by fluorometry using a Perkin Elmer LS55 spectrofluorometer (λEx: 450–580 nm at λEm
of 605 nm) (Lantoine and Neveux, 1997). The measurement precision was∼16 %.
Pico- and nano-phytoplankton abundances were analysed by flow cytometry. Samples (1.8 mL) were collected from the mesocosm everyday from 1, 6 and 12 m depth in cryotubes, fixed with 200 µL of paraformaldehyde (4 % final concen-tration), left 15 min at ambient temperature, flash frozen in liquid N2and stored at−80◦C until analysis on a
FACSCal-ibur (BD Biosciences) flow cytometer as described in Marie et al. (1999). Before analysis, samples were thawed at am-bient temperature in the dark. 600 µL of each sample were mixed and homogenized with 25 µL of TrueCount beads and 10 µL of 2 µm diameter beads (Fluoresbryte™, Polysciences) used as a reference for size discrimination between pico- and nano-phytoplankton. Phytoplankton communities were clus-tered asProchlorococcusspp. cell-like,Synechococcusspp. cell-like, nanoeukaryotes-cell-like and picoeukaryotes-cell-like according to their optical properties (light-scattered and fluorescence emission by the cells) (Marie et al., 1999).
For the determination of microphytoplankton community composition (diatoms), water samples (250 mL) were taken every day by pumping and preserved with formalin. In the laboratory, samples were sedimented and microphytoplank-ton species were identified and enumerated under-inverted microscope.
Bacterial production (BP) was estimated using the 3 H-leucine incorporation technique (Kirchman et al., 1985), adapted to the centrifugation method (Smith and Azam, 1992). Radioactivity was counted using a Liquid Scintilla-tion Analyzer Packard 2100 TR and the 3H counting
effi-ciency was corrected for quenching. BP was calculated from leucine incorporation rates using the conversion factor of 1.5 kg C mol−1leucine, and is shown here in ng C L−1h−1.
Samples for total organic carbon (TOC) concentrations were collected in duplicate in precombusted (4 h, 450◦C), 12 mL sealed glassware flask, acidified with orthophosphoric acid and stored in dark at 4◦C until analysis. Samples were analysed by using a TOC-5000 total carbon analyser (Sohrin and Sempéré, 2005). The average TOC concentrations in the Deep Atlantic Water and low carbon water reference stan-dards were 45±2 µM C,n=24 and 1±0.3 µM C, n=24, respectively. The analytical precision of the procedure was ≤2 %.
Dissolved organic nitrogen (DON) concentrations were calculated from total nitrogen (TN) concentrations sub-tracted by particulate organic nitrogen (PON) and dissolved inorganic nitrogen (DIN) concentrations. Samples were col-lected in 50 mL glass bottles and stored at−20◦C until
anal-ysis. The samples were divided in two parts after a rapid thaw for analysis of both organic and inorganic concentrations. TN concentration was determined according to the wet oxida-tion procedure described in Pujo-Pay and Raimbault (1994). Samples for PON concentrations were collected by filtering 1 L of water on GF/F filters and analysed according to the wet oxidation protocol (Pujo-Pay and Raimbault, 1994) with a precision of 0.06 µM. DIN concentration was determined ac-cording to Aminot and Kérouel (2007). Measurements were conducted using a segmented flow auto-analyser (AutoAna-lyzer AA3 HR, SEAL Analytical).
2.6 Statistics
Linear regression analyses and one-way analyses of variance (ANOVA) were performed with StatView 5.0 and the statis-tics package provided in Microsoft Excel 11.0. ANOVA was used to compare the means of independent data groups (nor-mally distributed). For the different analyses and tests, the significance threshold was set atp< 0.05.
3 Results
3.1 Evolution of the core parameters in the mesocosm The detailed description of temperature, salinity and nutrient concentrations in the three mesocosms is provided in Bon-net et al. (2016). Briefly, water temperature progressively increased inside and outside the mesocosms from 25.4 to 26.2◦C over the course of the 23-day experiment. Salinity
to 0.01 µM at the end of the experiment. In contrast, NH+4 concentrations were ∼0.01 µM up to day 18, and then creased up to 0.06 µM at day 23. DIP concentrations in-creased from 0.02–0.05 µM before the fertilization to 0.8 µM just after, and decreased gradually over time to return to their initial concentrations at day 23 (0.02–0.08 µM). In the surrounding waters, NO−3 remained < 0.20 µM and DIP was 0.05 µM all over the experiment (Berthelot et al., 2015; Bon-net et al., 2016).
For all the parameters described below, including CDOM and FDOM data, no significant difference was found with depth, except for TChl a and PON whose concentrations were higher at 12 m depth than at 1 and 6 m depths (ANOVA, n=20–22, p=0.003–0.04). Therefore, in the following paragraphs, the parameter descriptors are generally given in term of depth-averaged values.
3.2 Evolution of phytoplankton biomass, bacterial production and organic N and C pools in the mesocosm
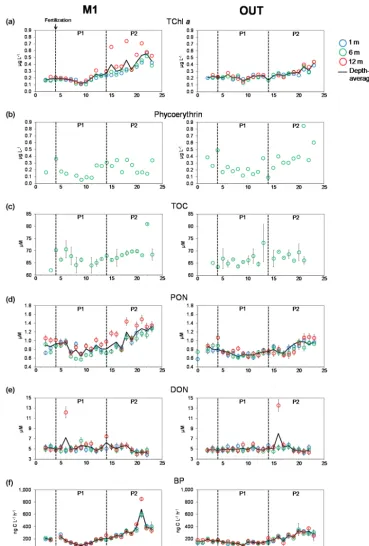
TChl a, PON concentrations and BP in the mesocosm M1 and in the surrounding waters (OUT) generally increased throughout the experiment, with a decrease from day 4 to day 9 and then an increase from day 9 to the end of the ex-periment (Fig. 3a, d, f). This increase was more pronounced in M1, where TChl a, PON concentrations and BP vary-ing from 0.12 to 0.55 µg L−1, 0.65 to 1.31 µM and 85 to 681 ng C L−1h−1, respectively. TChla,PON concentrations and BP were significantly higher inside M1 during P2 (day 15 to day 23) than inside M1 during P1 (day 5 to day 14), and than outside during P1 and P2 (ANOVA, n=25–30, p< 0.0001–0.004) (Table 1). Phycoerythrin concentration decreased from day 4 (0.36 µg L−1)to day 9 (0.05 µg L−1), increased towards day 16 (0.34 µg L−1)and then oscillated to return to the value of 0.34 µg L−1at day 23 (Fig. 3b). In con-trast, in OUT, phycoerythrin concentration increased from day 9 to the end of the experiment, showing a strong raise at day 21 (0.85 µg L−1). Thus, during P2, phycoerythrin con-centration was significantly higher outside M1 than inside (ANOVA,n=9,p=0.004) (Table 1). The TOC concentra-tion decreased from day 4 (70 µM) to day 11 (64 µM) and increased from day 11 to day 22 (81 µM) (Fig. 3c). This in-crease in the second part of the experiment was not observed in OUT. Although the TOC concentration was significantly higher during P2 than during P1 in M1 (ANOVA, n=9, p=0.03), there was no difference between M1 and OUT during P2 (ANOVA,n=7–9,p=0.2) (Table 1). The DON concentration was rather constant and only tended to de-crease during P2 (Fig. 3e). No significant difference in DON concentrations was found between M1 and OUT (ANOVA, n=22–29,p=0.07–0.7) (Table 1).
The abundance of diazotrophs DDAs inside M1 in-creased from day 3 (77×103nifHcopies L−1) to day 9 (190×103nifHcopies L−1), decreased from day 9 to
day 15 (5.4×10³nifHcopies L−1) and finally increased from day 15 to day 23 (78×103nifHcopies L−1). In
OUT a quite similar pattern was observed despite a high value of 450×103nifHcopies L−1 at day 18 (Fig. 4a). No significant difference in the abundance of DDAs was observed in M1 between P1 and P2, and between M1 and OUT (ANOVA, n=3–6, p=0.05–0.8) (Table 1). On the other hand, the abundance of diazotrophic Group UCYN-C strongly increased from day 9 (0.54×10³nifHcopies L−1) to day 23 (110×103nifHcopies L−1) in M1, while it increased much more slowly in OUT from day 10 (0.32×10³nifHcopies L−1) to day 22 (4.8×10³nifHcopies L−1) (Fig. 4b). Hence, the abun-dance of UCYN-C was much higher in M1 during P2 than in M1 during P1 (14 times higher) and than in OUT during P1 and P2 (22–53 times higher) (ANOVA, n=3–6, p< 0.0001) (Table 1). It should be noticed that the abundances of DDAs and UCYN-C are reported as nifH(gene) copies L−1 rather than cells L−1 because there is currently little information about the number of nifH copies per genome in these diazotroph targets (Turk-Kubo et al., 2015). Total diatoms in M1 decreased from day 2 (47×103cell L−1) to day 9 (6×10³cell L−1) and then oscillated to reach 41×103cell L−1 at the end of the experiment, with a maximum value of 120×103cell L−1at day 15 (Fig. 4c). This was essentially due to the large diatom Cylindrotheca closterium (data not shown). No difference in abundance of total diatoms was observed between P1 and P2 (ANOVA, n=5, p=0.2). The abundances of Synechococcus spp., Prochlorococcusspp., picoeukaryotes and nanoeukaryotes decreased from day 4 (∼43, 16, 2.2 and 0.9×10³cell mL−1, respectively) to day 9 (∼18, 5, 0.8 and
0.6×10³cell mL−1, respectively) (Fig. 4d–g). From day 9 to
the end of the experiment, the abundance ofSynechococcus spp. and picoeukaryotes noticeably increased to reach∼90 and 3.4×10³cell mL−1 at day 23 respectively, whereas the increase in Prochlorococcus spp. and nanoeukaryotes was much less (to ∼20 and 1.3×10³cell mL−1 at day 23, respectively). The abundance of Synechococcus spp., picoeukaryotes and nanoeukaryotes was significantly higher in P2 than in P1 (ANOVA, n=23–24, p< 0.0001–0.002), while that of Prochlorococcus spp. was not different (ANOVA,n=23–24,p=0.07) (Table 1).
3.3 Absorption spectra of CDOM and particulate matter
CDOM absorption spectra of samples collected in M1 and OUT were quite similar, displaying an exponential decrease inag(λ)without any significant shoulder (Fig. 5).ap(λ)
Figure 3.Evolution of(a)total chlorophylla(TChla)and(b)phycoerythrin concentrations (µg L−1),(c)total organic carbon (TOC),
Figure 4.Evolution of the abundance of(a)diatoms-diazotrophs associations (DDAs) and(b)unicellular diazotrophic cyanobacteria Group C (UCYN-C) (×103nifHcopies L−1)in the mesocosm M1 and in the surrounding waters (OUT), and(c)total diatoms (×103cell L−1),
Table 1.Mean values and associated standard deviations of chromophoric, biogeochemical and biological parameters of samples collected in the mesocosm M1 and in the surrounding waters (OUT) during the first part of the experiment, i.e. from day 5 to day 14 (P1), and during the second part of the experiment, i.e. from day 15 to day 23 (P2). The means which have different letters (a, b, c or d) are significantly different (ANOVA,p< 0.05). M1–P2 values in bold are significantly different from M1-P1, OUT-P1 and OUT-P2 values.
M1-P1 (n) M1-P2 (n) OUT-P1 (n) OUT-P2 (n)
TChla(µg L−1) 0.19±0.05a(28) 0.42±0.14b(27) 0.21±0.03a(25) 0.30±0.07c(25) Phycoerythrin (µg L−1) 0.17±0.09a(9) 0.24±0.09a(9) 0.19±0.08a(10) 0.42±0.19b(9) TOC (µM) 66.5±2.1a(9) 69.7±4.3b(9) 66.6±2.8a(9) 67.7±1.5a,b(7) PON (µM) 0.81±0.13a(30) 1.10±0.21b(27) 0.71±0.06c(30) 0.87±0.13a(27) DON (µM) 5.5±1.4a(29) 4.8±0.6a(22) 5.0±0.4a(29) 5.3±1.8a(23) BP (ng C L−1h−1) 157±49a(30) 348±142b(27) 135±24a(30) 256±60c(27) DDAs (×103nifHcopies L−1) 120±45a,b(5) 54±31a(6) 227±189b,c(5) 200±220a,c(3) UCYN-C (×103nifHcopies L−1) 4.5±7.6a(4) 64±24b(6) 1.2±0.8a(5) 2.9±1.7a(3) Total diatoms (×103cell L−1) 17±9a(5) 44±37a(5) nd nd
Synechococcus(×103cell mL−1) 41±20a(24) 88±14b(23) nd nd
Prochlorococcus(×103cell mL−1) 12±6a(24) 15±3a(23) nd nd
Picoeukaryotes (×103cell mL−1) 1.5±0.8a(24) 2.4±0.6b(23) nd nd Nanoeukaryotes (×103cell mL−1) 0.9±0.4a(24) 1.5±0.4b(23) nd nd
ag(370) (m−1) 0.046±0.004a(30) 0.058±0.009b(27) 0.049±0.005a,c(9) 0.052±0.006c(9)
ag(442) (m−1) 0.013±0.001a(30) 0.016±0.003b(27) 0.015±0.002a,c(9) 0.015±0.001c,b(9)
Sg(nm−1) 0.0172±0.001a,b(30) 0.0174±0.001b(27) 0.0169±0.001a(9) 0.0169±0.001a(9)
ap(442) (m−1) 0.014±0.004a(30) 0.022±0.004b(27) 0.015±0.002a(9) 0.018±0.002c(9)
ap(676) (m−1) 0.005±0.002a(30) 0.009±0.002b(27) 0.005±0.001a(9) 0.008±0.001b(9) Humic-like (QSU) 4.47±0.76a(30) 4.45±1.09a(18) nd nd
Tryptophan-like (QSU) 7.68±1.17a(30) 8.07±2.07a(18) nd nd Tyrosine-like (QSU) 6.57±1.21a(28) 5.49±0.83b(18) nd nd nd: not determined; TChla: total chlorophyllaconcentration; TOC: total organic carbon concentration; PON and DON: particulate and dissolved organic nitrogen
concentrations; BP: bacterial production; DDAs: diatoms-diazotrophs associations; UCYN-C: unicellular diazotrophic cyanobacteria Group C;ag(370) andag(442): absorption
coefficients of CDOM at 370 and 442 nm;Sg: spectral slope of CDOM;ap(442) andap(676): absorption coefficients of particulate matter at 442 and 676 nm; Humic-like,
tryptophan-like and tyrosine-like: fluorescence intensity of humic-like, tryptophan-like and tyrosine-like FDOM fluorophores. Detailed data about diazotrophs (DDAs and UCYN-C) are found in Turk-Kubo et al. (2015).
(Fig. 5). Hereafter, ag(λ) is presented at 370 and 442 nm,
whileap(λ)is given at 442 and 676 nm, the two latter
wave-lengths corresponding to the absorption maxima of Chla. 3.4 Evolution of absorption coefficients, spectral slope
in the mesocosm
In M1, absorption coefficients decreased from day 4 to day 9 and then increased from day 9 to the end of the experiment (day 23), leading to variations in the ranges 0.041–0.067 m−1
forag(370), 0.011–0.020 m−1forag(442), 0.009–0.025 m−1
forap(442) and 0.003–0.012 m−1forap(676) (Fig. 6a, b, d,
e). In OUT, these parameters also increased from day 9 or 10 to day 23 but with lower amplitude. Inside M1, all these absorption coefficients were significantly higher during P2 than during P1 (ANOVA,n=27–30,p< 0.0001). However, only ag(370) and ap(442) were significantly higher in M1
than outside during P2 (ANOVA,n=9–27,p=0.004–0.02) (Table 1).Sginside and outside M1, ranging from 0.0148 to
0.0188 nm−1, did not display any clear pattern throughout the experiment (Fig. 6c).
3.5 Spectral characteristics and identification of FDOM components
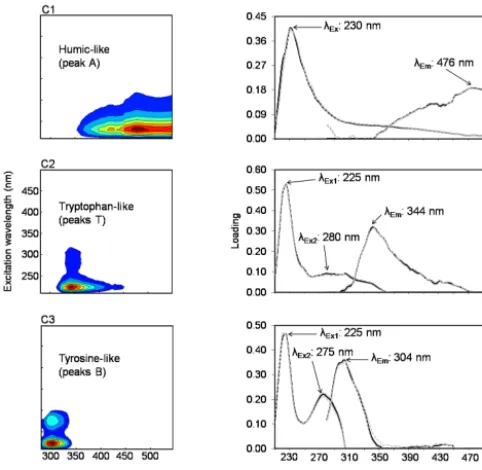
Three FDOM components (C1–C3) were identified by the PARAFAC model validated on 130 EEM samples from M1 and OUT. The spectral characteristics of C1–C3 are reported in Fig. 7. These components exhibited one or two Ex max-ima and one Em maximum. C1, with a maximum atλEx/λEm
of 230/476 nm, corresponded to the category of ultravio-let C (UVC) humic-like fluorophores, referred to as peak A (Coble, 1996, 2007; Ishii and Boyer, 2012). C2 and C3 had two maxima each, located atλEx1,λEx2/λEmof 225, 280/344
and 225, 275/304 nm, respectively (Fig. 7). They belonged to the group of protein-like fluorophores, C2 being analogous to tryptophan-like fluorophore (peaks T) and C3 being anal-ogous to tyrosine-like fluorophore (peaks B) (Coble, 1996, 2007).
3.6 Evolution of FDOM components in the mesocosm M1
Figure 5. Absorption spectra of chromophoric dissolved organic matter (CDOM) and particulate matter over the ranges 370–720 nm of samples collected in the mesocosm M1 at 1, 6 and 12 m depths and in the surrounding waters at 1 m depth. Black lines represent the average of all spectra and shaded areas represent the measured minimal and maximal values. Peaks and shoulders are reported for particulate matter.
(∼2.7 QSU), increased from day 8 to day 14 (∼4.8 QSU) and dropped down to ∼2.5 QSU at day 15. Then, it in-creased to reach ∼5.6 QSU at day 20 (Fig. 8a). The fluo-rescence intensity of tryptophan-like fluorophore decreased from day 3 (∼9.1 QSU) to day 8 (∼5.3 QSU) (Fig. 8b). At day 9, it increased up to ∼8.3 QSU and remained rela-tively stable up to day 14 (∼8.4 QSU). After a reduction at day 15 (∼5.9 QSU), the fluorescence intensity increased up to the end of the experiment (∼10.4 QSU at day 20). The fluorescence intensity of tyrosine-like fluorophore decreased from day 5 (∼8.2 QSU) to day 15 (∼3.9 QSU) and then slowly increased to day 20 (∼6.2 QSU) (Fig. 8c). While for humic- and tryptophan-like fluorophores no differences in their fluorescence intensity were observed between P1 and P2 (ANOVA, n=18–30,p=0.4–0.9), the fluorescence in-tensity of tyrosine-like fluorophore was significantly lower during P2 (ANOVA,n=18–28,p=0.002) (Table 1). Over-all, the FDOM pool was dominated by protein-like material: the combined fluorescence of tryptophan and tyrosine fluo-rophores ranged from 9.1 to 22.3 QSU, while the fluores-cence of humic fluorophore ranged from 1.9 to 6.2 QSU. 3.7 Relationships between the chromophoric and the
biogeochemical/biological parameters
Table 2 presents r values of linear regressions between the chromophoric and the biogeochemical/biological
pa-rameters for the samples collected in M1 from day 5 to day 20. Here we consider that only the correlations that are very highly significant (p< 0.0001) reflect relevant lin-ear relationships. ag(370, 442) and ap(442, 676) were not
that much correlated to each other (r=0.52–0.62,n=36, p< 0.0001–0.002). Sg was not correlated to ag(370, 442)
(r=0.15–0.22,n=36,p=0.06–0.9). Even though humic-and tryptophan-like fluorophores were very highly correlated (r=0.67,n=36,p< 0.0001), they did not show any cou-pling with tyrosine-like fluorophore (r=0.20–0.48,n=36, p=0.005–0.2). Moreover, none of these three fluorophores was very highly correlated to the absorption coefficients and spectral slope (r=0.09–0.42,n=36,p> 0.5–0.05) (Ta-ble 2). These correlations emphasize the decoupling between the CDOM and FDOM materials during the experiment.
All absorption coefficients were very highly positively cor-related to Synechococcus spp. abundance (r=0.76–0.83), BP (r=0.72–0.78), TChla concentration (r=0.60–0.88), PON concentration (r=0.58–0.75) and picoeukaryote abun-dance (r=0.52–0.71) (n=36,p< 0.0001). Linear relation-ships between ag(370) or ap(442) and Synechococcus spp.
abundance are presented in Fig. 9.Sg as well as the three
FDOM fluorophores did not present any highly significant correlation with the biogeochemical/biological constituents. Phycoerythrin, TOC, DDAs, UCYN-C and total diatoms did not display any very highly significant correlations with the chromophoric parameters, although somervalues were quite high (for instance 0.90 between UCYN-C andap(442)). This
is because these correlations were determined for a lower number of samples (8–15). Nonetheless these relationships highlighted interesting, albeit not very highly significant, trends such as positive (negative) relationships between ab-sorption coefficients (tyrosine-like fluorophore) and UCYN-C abundance as well as negative (positive) relationships be-tween absorption coefficients (tyrosine-like fluorophore) and DDA abundance (Table 2).
4 Discussion
4.1 General characteristics of chromophoric material 4.1.1 CDOM absorption
CDOM absorption spectra from samples inside and outside the mesocosm did not display any significant shoulder in the range 370–720 nm (Fig. 5). In the same way, using the PSI-CAM, Röttgers and Koch (2012) did not observe any specific feature in the CDOM absorption spectra from 380 to 700 nm of samples collected in the surface waters of the tropical At-lantic Ocean and of the north-east and south-west Pacific, including our study area inside the barrier reef of New Cale-donia.
ag(370) and ag(442) measured inside and outside the
Table 2.Pearson’s correlation coefficients (r)of linear regressions between the chromophoric and the biogeochemical/biological parameters of samples collected in the mesocosm M1 from day 5 to day 20, i.e. from the day after the dissolved inorganic phosphorus fertilization to almost the end of the experiment (P1+P2) (n=36).
ag(370) ag(442) Sg ap(442) ap(676) Humic Trypto. Tyrosine
ag(442) 0.90
Sg 0.22 −0.15
ap(442) 0.61 0.52 0.23
ap(676) 0.62 0.53 0.30 0.93
Humic 0.42 0.36 0.13 0.22 0.10
Trypto. 0.28 0.24 0.28 0.17 0.16 0.67
Tyrosine −0.09 −0.25 0.11 −0.28 −0.39 0.48 0.20
TChla 0.68 0.60 0.32 0.86 0.88 0.22 0.21 −0.33 Phyco.∗ 0.45 0.42 0.11 0.74 0.73 0.05 0.00 −0.35 TOC∗ 0.35 0.16 0.63 0.57 0.59 0.52 0.43 0.28 PON 0.71 0.58 0.29 0.75 0.70 0.43 0.29 0.04 DON −0.30 −0.23 −0.13 −0.14 −0.04 −0.26 −0.10 −0.14 BP 0.75 0.72 0.10 0.78 0.72 0.43 0.32 −0.12 DDAs∗ −0.44 −0.38 −0.52 −0.85 −0.78 0.20 0.05 0.60 UCYN-C∗ 0.73 0.67 0.55 0.90 0.85 0.15 0.23 −0.47 Diatoms∗ −0.07 −0.08 0.40 0.49 0.47 −0.85 −0.74 −0.88
Synecho. 0.76 0.76 0.08 0.83 0.76 0.35 0.29 −0.27
Prochlo. 0.42 0.47 0.08 0.57 0.50 0.13 0.03 0.00
Picoeuka. 0.52 0.62 −0.07 0.71 0.58 0.40 0.34 −0.25 Nanoeuka. 0.48 0.45 0.01 0.65 0.58 0.11 0.01 −0.35 Correlation coefficients (r) in bold are very highly significant (p< 0.0001).∗Correlations determined on a lower number of samples (n): 15 for Phyco. and TOC, 10 for DDAs, 9 for UCYN-C and 8 for diatoms.ag(370) andag(442): absorption coefficients
of CDOM at 370 and 442 nm (m−1);Sg: spectral slope of CDOM;ap(442) andap(676): absorption coefficients of particulate matter at 442 and 676 nm (m−1); Humic: fluorescence intensity of humic-like fluorophore (QSU); Trypto.: fluorescence intensity
of tryptophan-like fluorophore (QSU); Tyrosine: fluorescence intensity of tyrosine-like fluorophore (QSU); TChla: total chlorophyllaconcentration (µg L−1); Phyco.: phycoerythrin concentration (µg L−1); TOC: total organic carbon concentration (µM); PON and DON: particulate and dissolved organic nitrogen concentrations (µM); BP: bacterial production (ng C L−1h−1); DDAs: diatoms-diazotrophs associations (nifHcopies L−1); UCYN-C: unicellular diazotrophic cyanobacteria Group C (nifHcopies L−1); Diatoms: total diatoms (cell L−1);Synecho.:Synechococcusspp. (cell mL−1);Prochlo.:Prochlorococcusspp. (cell mL−1); Picoeuka.: Picoeukaryote (cell mL−1); Nanoeuka.: Nanoeukaryote (cell mL−1). Detailed data about diazotrophs
(DDAs and UCYN-C) are found in Turk-Kubo et al. (2015).
Fig. 6a, b) were within the range of those measured in sur-face waters of the Atlantic Ocean and at 80–200 m depth in the south-west Pacific (offshore of New Caledonia) (0.021– 0.118 and 0.004–0.039 m−1, respectively) (Röttgers and
Do-erffer, 2007; Röttgers and Koch, 2012; Dupouy et al., 2014). In addition, our ag(370) and ag(442) values were slightly
lower than those measured in the subtropical North Pa-cific and the Mediterranean Sea (0.050–0.090 and 0.018– 0.035 m−1, respectively) (Yamashita et al., 2013; Organelli et al., 2014) but higher than those observed in the center of the gyre of the south-east Pacific (> 0.010–0.035 and 0.005– 0.015 m−1, respectively) (Bricaud et al., 2010).
OurSgvalues determined over the range 370–500 nm
var-ied between 0.015 and 0.019 nm−1 inside and outside the mesocosm (Fig. 6c). They were to some extent lower thanSg
values determined between 350 and 500 nm of surface wa-ters of the Mediterranean Sea, Atlantic Ocean and south-east Pacific (0.015–0.025 nm−1) (Röttgers and Doerffer, 2007; Bricaud et al., 2010; Para et al., 2010; Organelli et al., 2014). In fact, ourSgvalues did not reach the maximal values
en-countered in oligotrophic areas (0.020–0.025 nm−1)despite the potentially important CDOM photobleaching processes which would have occurred in the surface waters of the meso-cosm. This is explained by the different spectral ranges used for theSgdetermination (370–500 nm vs. 350–500 nm).
In-deed,Sg, which strongly depends on the chosen wavelength
interval, is generally higher for intervals in the short wave-lengths (Nelson and Siegel, 2013; Sempéré et al., 2015), and do not present a constant spectral slope but rather steeper slopes towards the short UV wavelengths (Tedetti et al., 2007; Sempéré et al., 2015). Hence, this difference of 20 nm in the wavelength interval may influence theSgvalues, the
latter decreasing when considering the range 370–500 nm. It is worth noting that no correlation was found between ag(370) orag(442) andSg (Table 2). This was probably
at-tributable to the low ranges and the low values of bothag(λ)
Figure 7.Spectral characteristics of the three FDOM components (C1–C3) validated by the PARAFAC model for 130 EEMs of sam-ples collected in the mesocosm M1 at 1, 6 and 12 m depths and in the surrounding waters at 1 m depth over the course of the 23-day experiment. Both contour (left column) and line (right column) plots are depicted. The line plots show the excitation (left side) and emission (right side) fluorescence spectra. The dotted grey lines cor-respond to split half validation results. The excitation and emission maxima (λExandλEm)of each component are given.
4.1.2 FDOM
The three FDOM components identified in this work were UVC humic-, tryptophan- and tyrosine-like fluorophores (Fig. 7). Thus, FDOM was dominated by protein-like ma-terial, i.e. compounds containing nitrogen, while humic-like material was less represented. Of these protein-humic-like compounds, tryptophan- and tyrosine-like fluorophores have been reported in many aquatic ecosystems (see reviews by Coble, 2007; Fellman et al., 2010). They represent com-pounds of low molecular weight at the state of free amino acids or amino acids bound in peptides or proteins. They are known to be released by autochthonous (marine) phytoplank-ton activity and serve as fresh and labile bioavailable prod-ucts for heterotrophic bacteria (Yamashita and Tanoue, 2004; Nieto-Cid et al., 2006; Davis and Benner, 2007; Romera-Castillo et al., 2010; Tedetti et al., 2012). Moreover, they can be directly associated to humic substances (Stedmon and Cory, 2014). Generally, they do not show any conser-vative behaviour in the salinity gradient (Kowalczuk et al., 2009). UVC humic-like fluorophore (“peak A”) corresponds to component 1 (λEx/λEm: < 230–260/400–500 nm) in the
review paper by Ishii and Boyer (2012) and is one of the most widespread humic-like components in the aquatic
en-Figure 8.Evolution of the fluorescence intensities (QSU) of the three FDOM components:(a)humic-like,(b)tryptophan-like and
(c)tyrosine-like fluorophores in the mesocosm M1 at 1, 6 and 12 m depths over the course of the 23-day experiment (actually up to day 20 and not to day 23). Dots are mean values with standard devia-tions from duplicate measurements. Black line represents the depth-averaged values. P1: first part of the experiment, from day 5 to day 14; P2: second part of the experiment, from day 15 to day 23. Flu-orescence intensities in the surrounding waters (OUT) at 1 m depth were determined on only few samples at the beginning and the end of the experiment and are thus not presented here.
vironment (Kowalczuk et al., 2009, 2013). This fluorophore, which absorbs light at very short wavelengths (230 nm) and fluoresce in long visible wavelengths (476 nm) resulting in a high Stokes shift (246 nm), would be of relatively low molec-ular weight (< 1 kDa) compared to other fluorescent humic-like materials (Ishii and Boyer, 2012). Present in higher quantities in the photic zone and shallow surface waters, this humic-like component is recognized as a photodegra-dation product of marine organic matter (Yamashita et al., 2008; Ishii and Boyer, 2012) and appears to be resistant to biodegradation (Balcarczyk et al., 2009; Fellman et al., 2010; Lønborg et al., 2015).
4.1.3 Particulate absorption
[image:14.612.49.290.69.304.2]Figure 9. Linear relationships between absorption coefficient of CDOM at 370 nm [ag(370) in m−1] or absorption coefficient of par-ticulate matter at 442 nm [ap(442) in m−1] andSynechoccocusspp. abundance (×103cell mL−1)for samples collected in the meso-cosm M1 from day 5 to day 20, i.e. from the day after the dissolved inorganic phosphorus fertilization to almost the end of the experi-ment (P1+P2) (n=36).
main peaks, several shoulders were found between 376 and 550 nm. Actually, the shoulders at 376 and 416 nm might be related to Chl a (Stuart et al., 1998; Lohrenz et al., 2003). The shoulders at 464 and 490 nm reflected the occurrence of photosynthetic carotenoids and/or non photosynthetic (pho-toprotective) carotenoids (Dupouy et al., 1997, 2003; Stu-art et al., 1998; Wozniak et al., 1999; Lohrenz et al., 2003; Bricaud et al., 2004). In addition, the shoulder at 490 nm may be related to the presence of phycourobilin (PUB). PUB, which absorbs light around 490 nm, is known to be contained in phycoerythrin of cyanobacteria, such as Synechococcus spp., living in the open ocean. PUB is indeed considered as a chromatic adaptation to blue radiation which penetrates deeper than other wavelengths in the water column (Neveux et al., 1999). Also, the small shoulder at 550 nm could be the sign of phycoerythrobilin (PEB), also contained in phycoery-thrin. PEB, absorbing light around 550–565 nm, is present in higher amount in Synechococcus spp. of coastal envi-ronments (Neveux et al., 1999). Pronounced shoulders or peaks at 550 nm are observed only for exceptional Syne-chococcus spp. concentrations (> 3×10⁵cell mL−1) with
TChla> 1 µg L−1(Morel, 1997) or more commonly for large filamentous cyanobacteria in tropical waters (Dupouy et al., 2008). An attribution of the shoulders at 490 and 550 nm to PUB and PEB, respectively appears reasonable regarding the fact that PUB and PEB signals were detected in the phy-coerythrin fluorescence measurements (M. Rodier, personal communication, 2015). Such a proportion of
Prochlorococ-cusspp. andSynechococcusspp. counts reported in this work are typical of the New Caledonia lagoon (Neveux et al., 2009) compared to the equatorial upwelling area where this is inverted (Dupouy et al., 2003).
Absorption coefficients of particulate matter at 442 and 676 nm [ap(442) andap(676)] measured inside and outside
the mesocosm at the mouth of the New Caledonian coral lagoon (0.006–0.031 and 0.0013–0.013 m−1, respectively; Fig. 6d, e) were slightly lower than those measured with the same instrument in the surface waters within the New Cale-donian lagoon (0.008–0.040 and 0.0030–0.018 m−1, respec-tively) (Röttgers et al., 2014; Dupouy et al., 2014), the latter values being linked to an exceptional increase in total phy-toplankton biomass during the 2008 Valhybio cruise in re-sponse to aLa Ninaheavy rain episode (Dupouy et al., 2009; Fuchs et al., 2012).
4.2 Coupling between the dynamics of chromophoric material and that of N2fixation in the mesocosm
4.2.1 Link between absorption and Synechococcus spp. Several observations suggest the observed change in par-ticulate matter absorption [ap(λ)] during the experiment
was mainly driven bySynechococcus spp. Several observa-tions may support this hypothesis. Firstly, Synechococcus spp. was the most abundant group among (non-diazotrophic) pico-, nano- and micro-phytoplankton communities in the mesocosm (Fig. 4c–g). For instance, the concentration of Synechococcus spp. (88±14×103cell mL−1 in P2) was higher by a factor∼1000 relative to that of total diatoms (44±37×103cell L−1in P2) (Table 1).Synechococcusspp.
nanoplank-tonic diatoms than for Synechococcusspp. over the visible domain (Morel et al., 1993; Stramski and Mobley, 1997). Considering than the number of cells ofSynechococcusspp. was on average 6 times higher than that ofProchlorococcus spp. and∼1000 times higher than that of total diatoms dur-ing P2, we may put forward that Synechococcus spp. was the main contributor to visible absorption in the mesocosm. Finally,ap(442) andap(676) showed the highest positive
cor-relation withSynechococcusspp. abundance (Table 2; Fig. 9) with a very similar evolution during P1 and P2 (Figs. 4d, 6d, e).
The absorption of CDOM also presented the highest (pos-itive) coupling with Synechococcusspp. abundance and BP (Figs. 3f, 4d, 6a, b; 9; Table 2), thereby suggesting CDOM was produced by heterotrophic bacteria from their assimila-tion of labile organic compounds released by Synechococ-cusspp. Indeed, the latter has been shown to release DOM (Bronk, 1999; Becker et al., 2014) that may be directly used to support heterotrophic activity (Nagata, 2000; Lefort and Gasol, 2014). These (non-coloured) labile organic substrates issued from Synechococcus spp. would be converted into chromophoric, more refractory compounds by heterotrophic bacteria (Nelson et al., 1998; Rochelle-Newall and Fisher, 2002; Nelson and Siegel, 2013). Currently, the coupling be-tween phytoplankton and heterotrophic bacteria seems to be recognized as a major pathway for the formation of CDOM in the ocean (Rochelle-Newall and Fisher, 2002; Nelson and Siegel, 2013; Organelli et al., 2014). Interestingly, Biers et al. (2007) highlighted the role of DON, specifically amino sugars and aromatic amino acids, in the microbial produc-tion of CDOM and FDOM while Bronk et al. (1999) re-ported the production of DON bySynechococcusspp. Con-sequently, the works by Biers et al. (2007) and Bronk et al. (1999) support the assumption of the CDOM production by heterotrophic bacteria consecutive to their utilization of labile DOM (that would be in part in the form of DON) re-leased by Synechococcusspp. cyanobacteria. CDOM could be also produced directly fromSynechococcusspp., as men-tioned by Romera-Castillo et al. (2011). Also, we cannot ex-clude the participation of other primary producers, such as diatoms, to the CDOM production through a direct release of coloured material (Romera-Castillo et al., 2010; Chari et al., 2013) or through the bacterial re-working. For example, from culture experiments, Chari et al. (2013) reported the production of CDOM by Cylindrotheca closterium, one of the most important diatom species in the mesocosm. Regard-ing the respective abundances ofSynechococcusspp. and di-atoms and their evolution all over the experiment, it seems, however, thatSynechococcusspp. was a greater contributor to CDOM than diatoms. Consequently, even though it seems difficult here to discriminate the respective contributions of cyanobacterial primary producers (Synechococcusspp.) and heterotrophic bacteria in the production of CDOM, unam-biguously the coupling between both plays a key role in the
absorption of particulate and dissolved chromophoric mate-rial in the mesocosm.
4.2.2 Link between absorption, Synechococcus spp. and N2fixation
During the first part of the experiment (P1), the diazotrophic community was dominated by diatoms-diazotrophs associa-tions (DDAs) (Fig. 4a), more specifically heterocyst-forming Richelia associated with Rhizosolenia (Turk-Kubo et al., 2015). The decrease observed in phytoplankton biomass (in-cluding diatoms,Synechococcusspp.,Prochlorococcusspp., pico- and nano-eukaryotes), BP and organic C/N pools from day 4 to day 9–11 (Figs. 3a–d, f; 4c–g) was attributable to a N limitation. In fact, during the first days, phytoplankton would have consumed the small stock of nitrates remaining in the water column without new inputs. In addition, DDAs would not have been a significant source of N for its surrounding environment becauseRicheliawould have given the major part of the N that they had fixed to their host diatoms (Berth-elot et al., 2015). This decrease inSynechococcusspp. and BP led to the decrease in CDOM and particulate matter ab-sorption (Fig. 6a, b, d, e). During P1, the total amount of N issued from the N2 fixation was equivalent to the total
amount of PON exported, suggesting there is a rapid and pos-sibly direct export of the recently fixed N2by DDAs
(Berth-elot et al., 2015). In the second part of the experiment (P2), unicellular cyanobacteria Group C (UCYN-C) became the dominant diazotrophs (Fig. 4b). The UCYN-C bloom was induced by the phosphate fertilization and increasing tem-peratures (Turk-Kubo et al., 2015). Consequently, N2
fixa-tion rates were higher during P2 than during P1 (Berthelot et al., 2015). From these authors, the N released by UCYN-C (in the form of DON and/or NH+4)allowed for support-ing non-diazotrophic cyanobacterial and heterotrophic bac-terial growths. This would have in turn stimulated the pro-duction of dissolved and particulate chromophoric materials (increase in TChla, PON, TOC, BP, Synechococcus spp., ag(370, 442) andap(442, 676) from day 9–11 to day 21–23;
Figs. 3a, c, d, f; 4d; 6a, b, d, e). The enhancement of Syne-chococcusspp. via the release of N by diazotrophs has been already underscored by Agawin et al. (2007). This N release could also explain the strong increase in diatoms (mainly Cylindrotheca closterium) at day 15 (Fig. 4c). In P2, both N2
fixation and DON consumption were significant N sources for primary production and might explain the PON produc-tion (Berthelot et al., 2015). It is worth noting that a per-fect temporal synchronization occurred between the varia-tions ofSynechococcusspp./BP and the variations of CDOM and particulate matter absorption. This implies rapidity in the production mechanisms of the chromophoric material inside the mesocosm. The variations ofSg(Fig. 6c) (no correlation
withag(370, 442); Table 2) suggested that CDOM
processes. It is very likely that these degradation processes were not intense enough to counterbalance the production of CDOM by the coupleSynechococcusspp./heterotrophic bac-teria.
4.2.3 Absorption budget
Also, the contribution of CDOM (ag)to the total absorption
(ag+p)remained high in the UV domain (370 nm), ranging
from 72 to 96 %, while it decreased from the beginning (50– 66 %) to the end of the experiment (40–48 %) in the visi-ble domain (442 nm). These percentages in the UV and vis-ible domains are in line with those reported in the literature for the open ocean (Siegel et al., 2002, 2005; Tedetti et al., 2010), the higher contribution of particulate material in the absorption budget at 442 nm during the second part of the experiment being explained by the bloom of cyanobacterial primary producers (Synechococcusspp.).
4.2.4 FDOM decoupling
FDOM did neither follow the evolution of CDOM nor the evolution of heterotrophic bacteria andSynechococcusspp. (Fig. 8; Table 2). The evolution of tyrosine-like fluorophore, whose fluorescence intensity was higher in P1 than in P2 (Table 1), tended to be close to that of DDAs (Figs. 4a, 8c; Table 2). Therefore, we may hypothesize a role of these diatoms-diazotrophs associations in the production of the tyrosine-like material. The tyrosine-like fluorophore re-leased by phytoplankton could then be consumed by het-erotrophic bacteria as labile substrates. UVC humic-like flu-orophore displayed an evolution close to that of tryptophan material with two important decreases at days 7–8 and 15. This observation supports the hypothesis by Stedmon and Cory (2014) of an association between humic substances and tryptophan fluorophore in seawater. This revealed that the humic-like component was also subjected to produc-tion/degradation processes in the mesocosm that cannot be precisely identified here. The fact that CDOM which ab-sorbs light at 370 nm was not fluorescent (no fluorophores with Ex peak at 370 nm) strengthened the assumption that ag(370) and the three fluorophores represented independent
chromophoric materials that were driven by different pro-cesses. Also, these fluorophores could be not major compo-nents of the CDOM. Consequently, they would absorb but not strongly enough to significantly affect the CDOM vari-ability. Tryptophan- and tyrosine-like fluorophores belonged to the DON pool. Nonetheless, they showed different patterns in the mesocosm: while DON decreased during P2 (both the DON consumption and the N2fixation supported the PON
production during P2; Berthelot et al., 2015), the two fluo-rophores tended to increase. This suggested that tryptophan-and tyrosine-like materials were probably not involved in the PON production.
5 Conclusions
Studies dealing with the CDOM dynamics in the frame of mesocosm experiments remain limited so far and have been conducted merely in coastal-temperate or polar ecosystems (Rochelle-Newall et al., 1999, 2004; Pavlov et al., 2014). This work highlights the spectral characteristics and the vari-ability of dissolved and particulate chromophoric materials throughout a 23-day mesocosm experiment in a tropical, oligotrophic LNLC ecosystem in which N2fixers and
pico-phytoplankton play an essential role. Although CDOM did not display any specific shoulders in its absorption spectra, those of particulate chromophoric material were dominated by Chla fingerprint with small signatures of carotenoids, phycourobilin and phycoerythrobilin, which could be related to Synechococcus spp., the most abundant cyanobacterial group in the mesocosm. The dynamics of CDOM and par-ticulate matter were strongly coupled with those of Syne-chococcusspp. and bacterial production. Indeed, in the sec-ond part of the experiment, the N released in the surround-ing environment, very likely by UCYN-C diazotrophs, al-lowed for supporting cyanobacterial and heterotrophic bac-terial growths and subsequently stimulating the production of dissolved and particulate chromophoric materials. The in-crease in phytoplankton biomass during the second part of the experiment led to a higher contribution of particulate ma-terial in the absorption budget at 442 nm. FDOM, composed by (N-containing) protein-like fluorophores and UVC humic-like (photoproduct) fluorophore, did not follow the evolution of CDOM and particulate matter, and was thus subjected to different production/degradation processes in the mesocosm. Finally, this study strongly supports the idea of an indirect link between the dynamics of the N2fixation and that of
chro-mophoric material in the south-west Pacific.
Acknowledgements. Funding for this research was provided by the Agence Nationale de la Recherche (ANR starting grant VAHINE ANR-13-JS06-0002), INSU-LEFE-CYBER program, GOPS, IRD and M.I.O. The authors thank the captain and crew of the R/VAlis. We acknowledge the SEOH divers service from the IRD research centre of Noumea (E. Folcher, B. Bourgeois and A. Renaud) and from the Observatoire Océanologique de Villefranche-sur-mer (OOV, J. M. Grisoni) as well as the technical service of the IRD research centre of Noumea for their helpful technical support. C. Guieu, F. Louis and J. M. Grisoni from OOV are warmly thanked for the mesocosms design and their useful advice for deployment. We also thank A. Desnues, B. Charrière, H. Berthelot, J. Héliou and T. Moutin for their help and assistance in the sampling and analyses. S. Bonnet, PI of the VAHINE project, and J. Neveux are greatly acknowledged for their constructive comments and discussions on the early versions of the manuscript. Two anonymous Reviewers are acknowledged for their relevant comments and corrections, which contributed to improve the quality of this manuscript.
References
Agawin, N. S. R., Rabouille, S., Veldhuis, M. J. W., Servatius, L., Hol, S., van Overzee, H. M. J., and Huisman, J.: Competition and facilitation between unicellular nitrogen-fixing cyanobac-teria and non-nitrogen-fixing phytoplankton species, Limnol. Oceanogr., 52, 2233–2248, 2007.
Aminot, A. and Kérouel, R.: Dosage automatique des nutriments dans les eaux marines: méthodes en flux continu, Ed. Ifremer, Méthodes d’analyse en milieu marin, 188 pp., 2007.
Andrew, A. A., Del Vecchio, R., Subramaniam, A., and Blough, N. V.: Chromophoric dissolved organic matter (CDOM) in the Equatorial Atlantic Ocean: Optical properties and their relation to CDOM structure and source, Mar. Chem., 148, 33–43, 2013. Antoine, D., Babin, M., Berthon, J. F., Bricaud, A., Gentili, B.,
Loisel, H., Maritorena, S., and Stramski, D.: Shedding Light on the Sea: André Morel’s Legacy to Optical Oceanography, Ann. Rev. Mar. Sci., 6, 15.1–15.21, 2014.
Babin, M., Stramski, D., Ferrari, G. M., Claustre, H., Bricaud, A., Obolensky, G., and Hoepffner, N.: Variations in the light absorp-tion coefficients of phytoplankton, nonalgal particles, and dis-solved organic matter in coastal waters around Europe, J. Geo-phys. Res., 108, 3211, doi:10.1029/2001JC000882, 2003. Balcarczyk, K. L., Jones Jr., J. B., Jaffe, R., and Maie, N.: Stream
dissolved organic matter bioavailability and composition in wa-tersheds underlain with discontinuous permafrost, Biogeochem-istry, 94, 255–270, 2009.
Becker, J. W., Berube, P. M. Follett, C. L., Waterbury, J. B., Chisholm, S. W., Delong, E. F., and Repeta, D. J.: Closely related phytoplankton species produce similar suites of dissolved organic matter, Front. Microbiol., 5, 111, doi:10.3389/fmicb.2014.00111, 2014.
Berthelot, H., Moutin, T., L’Helguen, S., Leblanc, K., Hélias, S., Grosso, O., Leblond, N., Charrière, B., and Bonnet, S.: Dinitro-gen fixation and dissolved organic nitroDinitro-gen fueled primary pro-duction and particulate export during the VAHINE mesocosm experiment (New Caledonia lagoon), Biogeosciences, 12, 4099– 4112, doi:10.5194/bg-12-4099-2015, 2015.
Bidigare, R., Schofield, O., and Prezelin, B.: Influence of zeaxanthin on quantum yield of photosynthesis of Synechococcus clone WH 7803 (CD2), Mar. Ecol.-Prog. Ser., 56, 177–188, 1989. Biegala, I. C. and Raimbault, P.: High abundance of diazotrophic
picocyanobacteria (< 3 µm) in a Southwest Pacific coral lagoon, Aquat. Microb. Ecol., 51, 45–53, 2008.
Biers, E. J., Zepp, R. G., and Moran, M. A.: The role of nitrogen in chromophoric and fluorescent dissolved organic matter forma-tion, Mar. Chem., 103, 46–60, 2007.
Blough, N. V. and Del Vecchio, R.: Chromophoric DOM in the coastal environment, in: Biogeochemistry of Marine Dissolved Organic Matter, edited by: Hansel, D. A. and Carlson, C. A., Academic Press, San Diego, California, 509–546, 2002. Bonnet, S., Moutin, T., Rodier, M., Grisoni, J.-M., Louis, F.,
Folcher, E., Bourgeois, B., Boré, J.-M., and Renaud, A.: In-troduction to the project VAHINE: VAriability of vertical and tropHIc transfer of diazotroph derived N in the south wEst Pa-cific, Biogeosciences, 13, 2803–2814, doi:10.5194/bg-13-2803-2016, 2016.
Bracchini, L., Tognazzi, A., Dattilo, A. M., Decembrini, F., Rossi, C., and Loiselle, S. A.: Sensitivity analysis of CDOM spec-tral slope in artificial and natural samples: an application in the
central eastern Mediterranean Basin, Aquat. Sci., 72, 485–498, 2010.
Bricaud, A., Claustre, H., Ras, J., and Oubelkheir, K.: Natural vari-ability of phytoplanktonic absorption in oceanic waters: Influ-ence of the size structure of algal populations, J. Geophys. Res., 109, C11010, doi:10.1029/2004JC002419, 2004.
Bricaud, A., Babin, M., Claustre, H., Ras, J., and Tièche, F.: Light absorption properties and absorption budget of Southeast Pacific waters, J. Geophys. Res., 115, C08009, doi:10.1029/2009JC005517, 2010.
Bronk, D. A.: Rates of NH+4 uptake, intracellular transformation, and dissolved organic nitrogen release in two clones of marine Synechococcusspp., J. Plankton Res., 21, 1337–1353, 1999. Carreto, J. J.: A new keto-carotenoid from the dino-flagellate
Pro-topendinium depressurn(Bayley) Balech, 1974, J. Plankton Res., 7, 421–423, 1985.
Chari, N. V. H. K., Keerthi, S., Sarma, N. S., Rao Pandi, S., Chiran-jeevulu, G., Kiran, R., and Koduru, U.: Fluorescence and absorp-tion characteristics of dissolved organic matter excreted by phy-toplankton species of western Bay of Bengal under axenic labo-ratory condition, J. Exp. Mar. Biol. Ecol., 445, 148–155, 2013. Coble, P. G.: Characterization of marine and terrestrial DOM in
seawater using excitation emission matrix spectroscopy, Mar. Chem., 51, 325–346, 1996.
Coble, P. G.: Marine optical biogeochemistry – the chemistry of ocean color, Chem. Rev., 107, 402–418, 2007.
Davis, J. and Benner, R: Quantitative estimates of labile and semi-labile dissolved organic carbon in the western Arctic Ocean: A molecular approach, Limnol. Oceanogr., 52, 2434–2444, 2007. Del Vecchio, R. and Blough, N. V.: Photobleaching of
chro-mophoric dissolved organic matter in natural waters: Kinetics and modelling, Mar. Chem. 78, 231–253, 2002.
Dupouy, C., Petit, M., and Dandonneau, Y.: Satellite detected cyanobacteria bloom in the southwestern tropical Pacific. Impli-cation for nitrogen fixation, Int. J. Remote Sens., 8, 389–396, 1988.
Dupouy, C., Neveux, J., and André, J. M.: Spectral absorption co-efficient of photosynthetically active pigments in the equatorial Pacific (165◦E–150◦W), Deep-Sea Res. Pt. II, 44, 1881–1906, 1997.
Dupouy, C., Loisel, H., Neveux, J., Brown, S. L., Moulin, C., Blan-chot, J., Le Bouteiller, A., and Landry, M. R.: Microbial absorp-tion and backscattering coefficients from in situ and POLDER satellite data during an El Nino–Southern Oscillation cold phase in the equatorial Pacific (180◦), J. Geophys. Res., 108, 8138, doi:10.1029/2001JC001298, 2003.
Dupouy, C., Neveux, J., Dirberg, G., Röttgers, R., Tenório, M. M. B., and Ouillon, S.: Bio-optical properties of the marine cyanobacteriaTrichodesmiumspp, J. Appl. Remote Sens., 2, 1– 17, 2008.
Dupouy, C., Frouin, R., Röttgers, R., Neveux, J., Gallois, F., Panché, J. Y., Gérard, P., Fontana, C., Pinazo, C., Ouillon, S., and Minghelli-Roman, A.: Ocean color response to an episode of heavy rainfall in the lagoon of New Caledonia, Proc. SPIE, 7459, Ocean Remote Sensing: Methods and Applications, 7459, 74590G, doi:10.1117/12.829251, 2009.


![Figure 9. Linear relationships between absorption coefficient ofticulate matter at 442 nm [CDOM at 370 nm [ag(370) in m−1] or absorption coefficient of par-ap(442) in m−1] and Synechoccocus spp.abundance (× 103 cell mL−1) for samples collected in the meso-co](https://thumb-us.123doks.com/thumbv2/123dok_us/8154732.248126/15.612.82.250.67.274/relationships-absorption-coefcient-ofticulate-absorption-coefcient-synechoccocus-collected.webp)
