Ames Laboratory Publications
Ames Laboratory
11-30-2004
Anisotropy of the Magnetoresistance in
Gd5Si2Ge2
H. Tang
Iowa State University
Vitalij K. Pecharsky
Iowa State University, vitkp@ameslab.gov
G. D. Samolyuk
Iowa State UniversityMin Zou
Iowa State University
Karl A. Gschneidner Jr.
Iowa State University, cagey@ameslab.gov
See next page for additional authors
Follow this and additional works at:
http://lib.dr.iastate.edu/ameslab_pubs
Part of the
Condensed Matter Physics Commons
, and the
Materials Science and Engineering
Commons
The complete bibliographic information for this item can be found at
http://lib.dr.iastate.edu/
ameslab_pubs/25
. For information on how to cite this item, please visit
http://lib.dr.iastate.edu/
howtocite.html
.
Abstract
The observed magnetoresistance of single crystalline Gd5Si2Ge2is negative and strongly anisotropic. The
absolute values measured along the [100] and [010] directions exceed those parallel to the [001] direction by more than 60%. First principles calculations demonstrate that a structural modification is responsible for the anisotropy of the magnetoresistance, and that the latter is due to a significant reduction of electronic velocity in the [100] direction and the anisotropy of electrical conductivity.
Keywords
Materials Science and Engineering
Disciplines
Condensed Matter Physics | Materials Science and Engineering
Comments
This article is fromPhysical Review Letters93 (2004): 237203, doi:10.1103/PhysRevLett.93.237203.
Authors
H. Tang, Vitalij K. Pecharsky, G. D. Samolyuk, Min Zou, Karl A. Gschneidner Jr., Vladimir P. Antropov, Deborah L. Schlagel, and Thomas A. Lograsso
Anisotropy of the Magnetoresistance in
Gd
5Si
2Ge
2H. Tang,1V. K. Pecharsky,1,2,* G. D. Samolyuk,3M. Zou,1,2K. A. Gschneidner, Jr.,1,2V. P. Antropov,3 D. L. Schlagel,1and T. A. Lograsso1
1Materials and Engineering Physics Program, Ames Laboratory, Iowa State University, Ames, Iowa 50011-3020, USA 2Department of Materials Science and Engineering, Iowa State University, Ames, Iowa 50011-2300, USA
3Condensed Matter Physics Program, Ames Laboratory, Iowa State University, Ames, Iowa 50011-3020, USA
(Received 7 July 2004; published 30 November 2004)
The observed magnetoresistance of single crystallineGd5Si2Ge2is negative and strongly anisotropic.
The absolute values measured along the [100] and [010] directions exceed those parallel to the [001] direction by more than 60%. First principles calculations demonstrate that a structural modification is responsible for the anisotropy of the magnetoresistance, and that the latter is due to a significant reduction of electronic velocity in the [100] direction and the anisotropy of electrical conductivity.
DOI: 10.1103/PhysRevLett.93.237203 PACS numbers: 75.47.De, 71.15.Mb, 75.30.Kz, 75.47.Np
Giant magnetocaloric [1,2], substantial magnetoresis-tance (MR) [3,4], and colossal magnetostrictive [5,6] effects, observed in some Gd5SixGe4x compounds, prompted further research that resulted in the discovery of many unusual physical behaviors near ferromagnetic (FM) ordering temperature, which is a function of com-position within this series of alloys [7–20]. The strong dependence of physical properties on magnetic field opens a potential for applications of Gd5SixGe4x and related materials in magnetic refrigeration, magnetoelec-trical devices, and magnetomechanical devices, and si-multaneously calls for the development of a coherent approach in order to understand their unique magneto-responsiveness. In addition to magnetic field, large changes of magnetization, electrical resistance, and shape can be triggered in this series of materials by variation of temperature [1– 9] and hydrostatic pressure [11,12] aroundTC. The exceptional sensitivity of physical prop-erties to a range of intensive thermodynamic variables has been correlated to the first-order martensiticlike structural change, which accompanies FM ordering whenx 2:0in theGd5SixGe4x system [5,8,10,14].
Earlier studies of polycrystalline Gd5SixGe4x com-pounds withx0:4[15], 1.5 [16], 1.8 [3], 1.95 [17], and 2.0 [4] point to a negative MR with values reaching 50% [15]. However, preferred orientation and grain boundary effects may be dominant in polycrystalline samples, thus masking the intrinsic magnetotransport properties (e.g., see Ref. [16], where the MR of a poly-crystalline sample withx1:5is positive, the only such example among all compounds from this series studied to date). In this Letter, we report first experimental evidence of the anisotropic MR of the Gd5Si2Ge2 compound and show that it can be reproduced from first principles by calculating diffusion conductivity in the low- and high-temperature phases or in the high- and low-magnetic-field phases. The proposed model, considering the contribu-tions from crystal structure and magnetic ordering
changes, facilitates a microscopic explanation of the an-isotropic MR inGd5Si2Ge2.
Gd5Si2Ge2 single crystal was grown by the Bridgman method from a polycrystalline stock with the same nomi-nal composition. The Curie temperature of the as-grown crystal indicates a nearly idealGd5Si2Ge2 stoichiometry. The samples were extracted from several large grains of the same batch by using the spark-eroding technique. The three single crystals had a rectangular shape with the longest dimensions parallel to [100], [010], and [001] crystallographic directions, respectively. Electrical re-sistance was measured on heating and cooling, as well as isothermally, by means of a standard dc four-probe method. The electrical contacts were prepared by using silver epoxy and platinum wires. The magnetic field var-ied from40to 40 kOe, and the temperature from 4.2 to 320 K. A constant dc current of 10 mA was employed in
Temperature, T (K)
250 260 270 280 290 300
Magnetoresistance,
M
R
(%)
-25 -20 -15 -10 -5 0 5
heating cooling
Gd5Si2Ge2
H|| I|| [100]
H= 10 kOe
H= 0
H= 10 kOe
TC(cooling) TC(heating)
TC(cooling) TC(heating)
Temperature, T (K)
250 260 270 280 290 300
Magnetoresistance,
M
R
(%)
-25 -20 -15 -10 -5 0 5
heating cooling
Gd5Si2Ge2
H|| I|| [100]
H= 10 kOe
H= 0
H= 10 kOe
TC(cooling) TC(heating)
TC(cooling) TC(heating)
FIG. 1 (color online). The MR ratios ofGd5Si2Ge2measured
along the [100] direction on heating and cooling in 0 and 10 kOe magnetic fields. The individual TC’s and temperature
changing directions are marked with arrows.
PRL93,237203 (2004) P H Y S I C A L R E V I E W L E T T E R S 3 DECEMBER 2004week ending
[image:3.612.319.557.488.663.2]all the measurements. The current vector was collinear with the magnetic-field direction and the longest dimen-sions of the specimens in all cases. The magnetoresis-tance ratio was calculated as MR% H0= 0100, whereHand0 are the electrical resistivities measured in a magnetic fieldH and in a zero magnetic field, respectively.
MR ratios along the [100] direction measured on heat-ing and coolheat-ing in magnetic fields 0 and 10 kOe are plotted against temperature in Fig. 1. The corresponding zero-field and 10 kOe TC values determined from the maximum of d=dT are also marked on the plot. A negative MR of 22% at 280 K is observed between theTC0 kOeandTC10 kOeon heating and of20%at 270 Kon cooling. A10 Khysteresis in the MR min-ima is consistent with the hysteresis inTC— a character-istic feature of a first-order transformation —which also is observed in other physical properties of polycrystalline
Gd5Si2Ge2 samples.
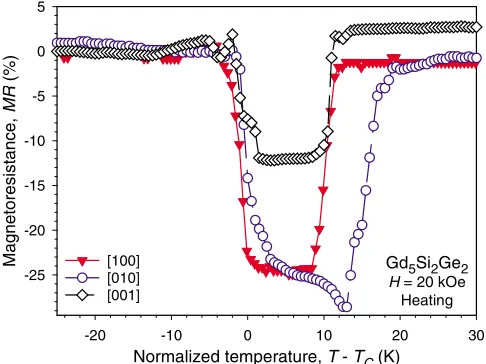
Temperature dependencies of MR along the three prin-cipal crystallographic directions ofGd5Si2Ge2 measured on heating in 0 and 20 kOe fields are compared in Fig. 2. The temperatures in Fig. 2 have been normalized by subtracting the individual zero-fieldTC values measured on heating, which were slightly different for three differ-ent specimens used in this study, most likely due to a
small variation in the Si:Ge ratio. In all the cases, a minimum is observed around the Curie temperature. It is also clear that the temperature dependence of the MR ratio is strongly anisotropic. The maximum absolute val-ues of the MR along the [100] and [010] directions (25% and 28%) are much larger than 13% measured along the [001] direction. The MR signal measured parallel to the [010] direction is also slightly broader than the other two. Although potentially intrinsic to the material (the [010] direction is unique since it is nearly perpendicular to the slabs [7]), this feature could be related to a difference in the stoichiometry, which appears to be the greatest for this particular specimen as judged from its lowTC, and therefore, extrinsic.
The magnetic-field dependencies of the MR ratios measured5 Kabove the zero fieldTCare compared in Fig. 3. With increasing magnetic field, resistance drops sharply around 20 kOe, rapidly approaching saturation. With decreasing magnetic field, MR jumps back to zero with a5 kOe hysteresis between the magnetic-field in-creasing and the dein-creasing branches. The starting point for each measurement is in the high resistance monoclinic (MC) paramagnetic (PM) phase, and, therefore, it is driven into the low resistance FM orthorhombic (OR) phase by magnetic fields exceeding temperature-specific critical values. Conversely, the magnetic-field-induced FM OR phase transforms back into the PM MC phase with decreasing magnetic field. Consistent with the tem-perature dependent data, the magnetic-field dependence of the MR ratio is also anisotropic: the largest negative values are 24%, 21%, and14:5%along the [100], [010], and [001] directions, respectively.
In order to obtain further insight into the nature of the observed MR behavior, electronic structure and diffusion
Normalized temperature, T - TC (K)
-20 -10 0 10 20 30
Magnetoresistance, M R (%) -25 -20 -15 -10 -5 0 5 [100] [010] [001]
Gd5Si2Ge2
H= 20 kOe Heating
Normalized temperature, T - TC (K)
-20 -10 0 10 20 30
Magnetoresistance, M R (%) -25 -20 -15 -10 -5 0 5 [100] [010] [001]
Gd5Si2Ge2
H= 20 kOe Heating
FIG. 2 (color online). The MR ratios ofGd5Si2Ge2 as
func-tions of temperature measured along different crystallographic directions on heating in 0 and 20 kOe magnetic fields. The temperatures were normalized by subtracting the individual zero-field TC values, which are as follows: 278.6 K ([100]),
269 K ([010]), and 276.5 K ([001]), indicating, respectively, the following actual stoichiometries: Gd5Si2:03Ge1:97,
Gd5Si1:97Ge2:03, andGd5Si2:02Ge1:98 [13]. Transport
measure-ments of polycrystalline samples with a much larger variance of the chemical compositions, from Gd5Si1:8Ge2:2 [3] to
Gd5Si2Ge2 [4], show that, except for a systematic change of
the Curie temperature, theSi:Geratio has a negligible effect on the electronic transport behavior.
Magnetic field, H (kOe)
0 10 20 30 40
Magnetoresistance, M R (%) -25 -20 -15 -10 -5 0
[100], T-TC = 3.9 K
[010], T-TC = 5.7 K
[001], T-TC = 5.0 K
Gd5Si2Ge2
H|| I
Magnetic field, H (kOe)
0 10 20 30 40
Magnetoresistance, M R (%) -25 -20 -15 -10 -5 0
[100], T-TC = 3.9 K
[010], T-TC = 5.7 K
[001], T-TC = 5.0 K
Gd5Si2Ge2
H|| I
FIG. 3 (color online). The magnetic-field dependencies of the MR ratios of Gd5Si2Ge2 along the [100], [010], and [001]
crystallographic directions measured 4 to 6 K above the zero-fieldTC’s.
[image:4.612.56.299.380.562.2] [image:4.612.319.563.477.664.2]conductivity ofGd5Si2Ge2were calculated using the tight binding linear muffin-tin orbital (TB LMTO) method within local spin density approximation with theU cor-rection approach (LSDAU) for more accurate treat-ment of the 4f states of Gd atoms. The values of U
(Coulomb repulsion between localized4f electrons) and
J(exchange interaction between localized 4f electrons) are equal to 6.7 and 0.7 eV, respectively [21]. To imitate disordering effects, two possible distributions of Si and Ge atoms in the unit cell were considered [called direct and inverse hereafter (see Ref. [10] for details)]. A mesh of 4800k points in the full Brillouin zone was sufficient to reach a few percent accuracy in the calculated con-ductivity tensor. Assuming that the MR effect is caused by the magnetic-field-induced MC!OR phase transi-tion and the concurrent modificatransi-tion of the electronic structure, we implement the following expressionMR
MCOR=OR100%, where corresponds to Cartesian coordinates and
OR and MC are diffusion conductivity tensors of the OR and MC phases, respec-tively, which were calculated in the relaxation time ap-proach [22]
/
X
k;;s
v;skv;sk";sk EF hvvi:
(1)
In Eq. (1),is the relaxation time,v;s@";sk=@kis the electronic group velocity,";sk is the energy spec-trum, andk,, andsare the wave vector, band, and spin indices, respectively. We calculated electronic velocity for FM ordering in the OR phase and FM and antiferromag-netic (AFM) orderings in the MC phase.
The results of theoretical calculations are presented in Table I and Fig. 4. MR ratios are in qualitative agreement with the experimental data regardless of the magnetic order in the high-temperature phase. In the case of the
AFM ordering of the MC phase, the MR is overestimated by more than a factor of 2, yet it still demonstrates the same anisotropy. The larger MR ratios for the case of AFM ordering of the MC phase are related to a sharp peak in the density of states (DOS) at the Fermi energy (EF) corresponding to dstates of Gd atoms with a very small dispersion ofkatEF. Therefore, AFM ordering will not be considered in the following discussion.
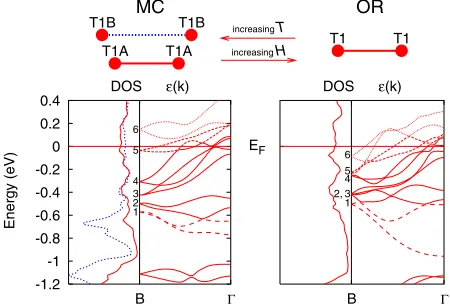
The 30%increase of theT1B-T1B (see notations in Ref. [7]) distance in the MC phase [6 –8] leads to a natural decrease of Si(Ge)-Si(Ge) interactions [7,10]. This weak-ening of bond strength reduces splitting between corre-sponding bonding and antibonding states. As a result, the position of the antibondingpstates is lowered in the MC phase as indicated by large peaks belowEF at1:1and 0:65 eVfor the majority (Fig. 4) and0:5and0:1 eV
for the minority (not shown) spin states in the DOS of
T1B atoms. The T1A-T1A distance does not change through the transition [6 –8] and the DOS of T1A atoms (Fig. 4) varies insignificantly. A shift of the antibonding states becomes apparent as a significantly decreased dis-persion of bands 1, 5, and 6 that occurs in the MC phase. Reduced dispersion of band 1 is responsible for the peak at0:65 eVin the DOS of the MC phase, and it leads to the corresponding reduction of jvkjat the Fermi level.
The main contribution to electrical conductivity corre-sponds todelectrons of Gd atoms, while Ge and Si atoms are responsible for about 20% of its total value. Our calculations demonstrate that absolute change of hv2
[image:5.612.324.549.456.610.2]i is practically the same for the [010] and [001] directions in the direct configuration and slightly smaller for the [001] direction in the inverse configuration (see Table I). This
TABLE I. Calculated values of hv2
aiat EF. In OR and MC
phases, direct and inverse configurations of Ge and Si atoms and two types of magnetic order in MC phase (FM and AFM) were considered. All values are normalized tohv2
100iin the OR
phase with direct configuration. hv2
ai hv2aiMC-FMor MC-AFM hv2
aiOR-FMand MRhv2ai=hv2aiOR-FM 100%for different directions and two types of magnetic order-ings in the MC phase are shown.
hv2
ai hv2ai hv2ai MR(%) MR(%)
MC-FM MC-AFM MC-FM MC-AFM
# # # #
Configuration OR-FM OR-FM OR-FM OR-FM OR-FM
Direct [100] 1.00 0:20 0:61 20 61
[010] 0.54 0:18 0:38 33 70
[001] 0.96 0:18 0:23 19 24
Inverse [100] 0.92 0:29 0:56 32 61
[010] 0.51 0:18 0:31 35 61
[001] 0.81 0:15 0:01 19 0
-1.2 -1 -0.8 -0.6 -0.4 -0.2 0 0.2 0.4 B Γ Energy (eV)
DOS ε(k)
1 2 3 4 5 6 B Γ
DOS ε(k)
EF 1 2, 3 4 5 6 MC T1B T1B T1A T1A OR T1 T1
increasing H increasing T
FIG. 4 (color online). The most relevant bands in the elec-tronic structure ofGd5Si2Ge2modified through
magnetostruc-tural phase transition showing the DOS of theT1atoms (solid line, right-hand side) in the OR phase; theT1A(solid line) and theT1B(dashed line) in the MC phase and the band structure along the [100] direction for majority spin states. EF
corre-sponds to zero energy. The shortT1-T1bond in the OR phase splits into two different bonds in the MC phase: the short
T1A-T1Abond and the elongated by30%T1B-T1Bbond.
PRL93,237203 (2004) P H Y S I C A L R E V I E W L E T T E R S 3 DECEMBER 2004week ending
[image:5.612.51.295.599.716.2]result correlates with the almost negligible change of interatomic distances along these two crystallographic directions through the structural transition and the reduc-tion of conductivity occurs because of the increased
T1B-T1Bdistance. A larger MR ratio in the [010] direc-tion (perpendicular to the slabs) arises from the smaller hv2
010i value compared to the in-slab [100] and [001]
directions; see Table I. As is well documented for this series of compounds [7,8,13], the slabs that could be treated as infinite along the [100] and [001] directions are stacked along the [010] direction, and they may or may not be connected by Si(Ge)-Si(Ge) covalent bonds through Si(Ge) located atT1B sites. The most dramatic structural changes occur along the [100] direction, and certain interactions along the [010] direction alternatively break and reform through breaking and reforming of the interslab Si(Ge)-Si(Ge) bonds. Owing to the significant distortion occurring between the slabs along the [100] direction but almost ignorable interatomic distances var-iability along [010] and [001] [7,8,13], the conductivity along the [100] direction is reduced more profoundly (see
hv2
100i in Table I), and the MR ratio is 20% and
32% in the direct and inverse configurations, respec-tively. A large MR in the [100] direction in the inverse configuration is related to a large contribution to the DOS at the Fermi level from Si atoms inT1Bpositions, rather than from T1B Ge atoms. As a result, the change of electronic velocity atEF caused by the above-described modification of the antibonding states of T1B sites is more significant for Si atoms. Correspondingly, the values of the MR ratio statistically averaged over direct and inverse configurations are 26%,34%, and 19% in the [100], [010], and [001] directions, respectively. This result is in agreement with the experimental data.
In summary, the MR of aGd5Si2Ge2single crystal has been studied both experimentally and theoretically as a function of crystallographic direction, magnetic field, and temperature. The MR ratio of up to25%is observed around theTCwith a 20 kOe magnetic field applied along the [100] and [010] directions, which is higher than the 14%observed along the [001] direction. The MR effect calculated from electrical conductivity values along dif-ferent directions is in qualitative agreement with the experiment. Theoretical calculations indicate that the MR ratio shows some dependence on the type of magnetic order in the high-temperature phase, but the anisotropy of MR does not. The anisotropy of the MR in Gd5Si2Ge2 arises from a structural transition taking place
concur-rently with a ferromagnetic ordering atTCbecause, first, drastic changes in the lattice occur along the [100] direc-tion and, second, interacdirec-tions between the slabs along the [010] direction are greatly affected by variability of
T1B-T1B, Gd-Gd, and Gd-Si(Ge) interslab bonds. Combined, these changes in this layered crystal structure result in the largest MR along the [100] and [010] direc-tions, while the MR along the [001] direction is the smallest.
This work was supported by the Office of Basic Energy Sciences, Materials Sciences Division of the U.S. Department of Energy under Contract No. W-7405-ENG-82. G. D. S. and V. P. A. thank M. van Schilfgaarde for useful discussion and providing his TB LMTO code.
*Corresponding author.
Electronic address: vitkp@ameslab.gov
[1] V. K. Pecharsky and K. A. Gschneidner, Jr., Phys. Rev. Lett.78, 4494 (1997).
[2] V. K. Pecharsky and K. A. Gschneidner, Jr., Appl. Phys. Lett.70, 3299 (1997).
[3] L. Morellonet al., Appl. Phys. Lett.73, 3462 (1998). [4] E. M. Levin, V. K. Pecharsky, and K. A. Gschneidner, Jr.,
Phys. Rev. B60, 7993 (1999).
[5] L. Morellonet al., Phys. Rev. B58, R14 721 (1998). [6] L. Morellonet al., Phys. Rev. B62, 1022 (2000). [7] W. Choeet al., Phys. Rev. Lett.84, 4617 (2000). [8] V. K. Pecharsky and K. A. Gschneidner, Jr., Adv. Mater.
13, 683 (2001).
[9] H. Tanget al., J. Appl. Phys.93, 8298 (2003).
[10] V. K. Pecharsky et al., J. Solid State Chem. 171, 57 (2003).
[11] L. Morellonet al., Phys. Rev. B68, 024417 (2003). [12] C. Magenet al., Phys. Rev. Lett.91, 207202 (2003). [13] V. K. Pecharsky and K. A. Gschneidner, Jr., J. Alloys
Compd.260, 98 (1997).
[14] V. K. Pecharskyet al., Phys. Rev. Lett.91, 197204 (2003). [15] L. Morellonet al., J. Magn. Magn. Mater.237, 119 (2001). [16] E. M. Levinet al., J. Magn. Magn. Mater.210, 181 (2000). [17] E. M. Levinet al., Phys. Rev. B63, 064426 (2001). [18] H. Tanget al., Phys. Rev. B69, 064410 (2004).
[19] C. Magen et al., J. Phys. Condens. Matter 15, 2389 (2003).
[20] M. Nazihet al., Solid State Commun.126, 255 (2003). [21] B. N. Harmon et al., J. Phys. Chem. Solids 56, 1521
(1995).
[22] J. M. Ziman,Electrons and Phonons(Oxford University Press, London, 1967), Chap. VII.
![FIG. 1 (color online).The MR ratios of Gd5Si2Ge2 measuredalong the [100] direction on heating and cooling in 0 and10 kOe magnetic fields](https://thumb-us.123doks.com/thumbv2/123dok_us/8129670.241855/3.612.319.557.488.663/online-ratios-measuredalong-direction-heating-cooling-magnetic-elds.webp)