www.ann-geophys.net/29/1731/2011/ doi:10.5194/angeo-29-1731-2011
© Author(s) 2011. CC Attribution 3.0 License.
Annales
Geophysicae
Three-dimensional spatial structures of solar wind turbulence from
10 000-km to 100-km scales
Y. Narita1, K.-H. Glassmeier1,2, M. L. Goldstein3, U. Motschmann4,5, and F. Sahraoui6
1Institut f¨ur Geophysik und extraterrestrische Physik, Technische Universit¨at Braunschweig, Mendelssohnstr. 3, 38106 Braunschweig, Germany
2Max-Planck-Institut f¨ur Sonnensystemforschung, Max-Planck-Straße 2, 37191 Katlenburg-Lindau, Germany 3Geospace Physics Laboratory, Code 673, Goddard Space Flight Center, Greenbelt, MD 20771, USA
4Institut f¨ur Theoretische Physik, Technische Universit¨at Braunschweig, Mendelssohnstr. 3, 38106 Braunschweig, Germany 5Deutsches Zentrum f¨ur Luft- und Raumfahrt, Institut f¨ur Planetenforschung, Rutherfordstr. 2, 12489 Berlin, Germany 6Laboratoire de Physique des Plasmas Observatoire de Saint-Maur, 4 avenue de Neptune, 94107 Saint-Maur-Des-Foss´es, France
Received: 7 July 2011 – Accepted: 16 August 2011 – Published: 5 October 2011
Abstract. Using the four Cluster spacecraft, we have deter-mined the three-dimensional wave-vector spectra of fluctuat-ing magnetic fields in the solar wind. Three different solar wind intervals of Cluster data are investigated for this pur-pose, representing three different spatial scales: 10 000 km, 1000 km, and 100 km. The spectra are determined using the wave telescope technique (k-filtering technique) without as-suming the validity of Taylor’s frozen-in-flow hypothesis nor are any assumptions made as to the symmetry properties of the fluctuations. We find that the spectra are anisotropic on all the three scales and the power is extended primarily in the directions perpendicular to the mean magnetic field, as might be expected of two-dimensional turbulence, how-ever, the analyzed fluctuations are not axisymmetric. The lack of axisymmetry invalidates some earlier techniques us-ing sus-ingle spacecraft observations that were used to esti-mate the percentage of magnetic energy residing in quasi-dimensional power. However, the dominance of two-dimensional turbulence is consistent with the relatively long mean free paths of cosmic rays in observed in the helio-sphere. On the other hand, the spectra also exhibit secondary extended structures oblique from the mean magnetic field di-rection. We discuss possible origins of anisotropy and asym-metry of solar wind turbulence spectra.
Keywords. Interplanetary physics (Interplanetary magnetic fields; MHD waves and turbulence; Plasma waves and turbu-lence)
Correspondence to: Y. Narita (y.narita@tu-bs.de)
1 Introduction
Investigating three-dimensional spatial structures is one of the most exciting tasks in studying the complex behavior of space plasma turbulence. There are several reasons for this: (1) various studies (observations and theories) suggest plasma turbulence to be anisotropic with respect to the ambi-ent magnetic field; (2) determining spatial structure in three dimensions provides direct visualization that can give evi-dence of anisotropies; and (3) such a task is only possible with multi-spacecraft missions, such as Cluster (Escoubet et al., 2001). Solar wind turbulence serves as the only acces-sible, fully-developed plasma turbulence in space that allows detailed in-situ measurements using spacecraft. Studying the fluctuation properties of solar wind turbulence has immedi-ate implications to astrophysical phenomena such as coronal heating, cosmic ray acceleration and propagation, as well as angular momentum transport in accretion disks.
Alexandrova et al., 2009).
Various studies suggest that plasma turbulence should be anisotropic. Earlier observations based on single spacecraft showed that correlation of magnetic field fluctuations in the solar wind tends to peak in directions both parallel and per-pendicular to the mean magnetic field, and not in oblique directions (Matthaeus et al., 1990). Turbulent fluctuations in the solar wind are therefore often interpreted as a compe-tition between two different fluctuation geometries. One is associated with wave vectors parallel to the mean magnetic field (referred to as the slab model because the fluctuations are primarily in a plane perpendicular to the background magnetic field), and the other is associated with perpendicu-lar wave vectors (the two-dimensional turbulence model, in which the magnetic fields or flux tubes are distorted without being bent). Studies of cosmic ray transport also suggest that the two-dimensional turbulence geometry must play a dom-inant role to account for the long mean free paths of cosmic rays (Bieber et al., 1994, 1996). On the other hand, extensive correlation analyses using single spacecraft data suggest that the dominance of the two fluctuation geometries is case de-pendent: fluctuations described by the slab geometry dom-inate the fast streams and that of the two-dimensional tur-bulence geometry dominate the slow streams (Dasso et al., 2005).
The Cluster mission is unique in studying solar wind tur-bulence, since it can determine spatial structures (size and direction) of fluctuating fields in three dimensions without employing assumptions about symmetry or Taylor’s frozen-in-flow hypothesis (Taylor, 1938). This paper is motivated by recent Cluster measurements of three-dimensional wave-vector spectra (Narita et al., 2010a; Sahraoui et al., 2010b) of fluctuating magnetic fields in the solar wind, which con-firmed the existence of anisotropic energy spectra. These analyses concluded that there was a preference for two-dimensional turbulence. Furthermore, it was shown that ax-isymmetry in the spectrum is broken around the direction of the mean magnetic field. Here we use the analysis method developed by Sahraoui et al. (2006, 2010a) and Narita et al. (2010b) and investigate the three-dimensional structures of solar wind turbulence on three distinct scales: 10 000 km,
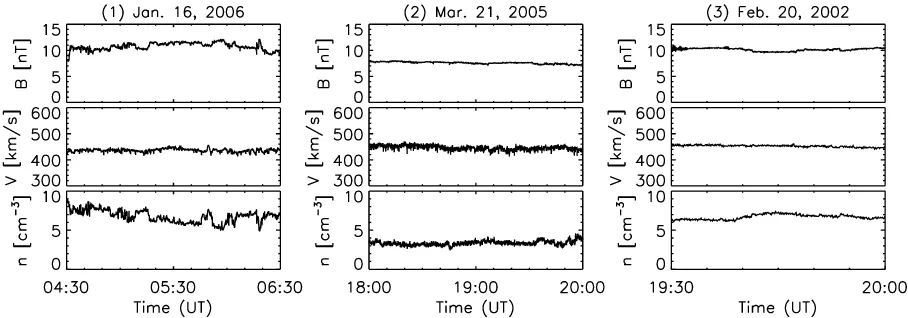
We chose three time intervals of solar wind data from Clus-ter fluxgate magnetomeClus-ter experiment (FGM) (Balogh et al., 2001) for the analysis of the three-dimensional wave-vector spectra: (interval 1) 16 January 2006, 04:30–06:30 UT dur-ing the mission phase with about 10 000 km spacecraft sep-aration; (interval 2) 21 March 2005, 18:00–20:00 UT with about 1000 km separation; (interval 3) 20 February 2002, 19:30–20:00 UT with about 100 km separation. These in-tervals were selected using the following criteria: (a) Clus-ter forms tetrahedron close to regular, which minimizes spectral distortion effects such as spatial aliasing and arti-ficial anisotropies induced by irregular tetrahedron of sensor configuration (Narita et al., 2010b; Sahraoui et al., 2010a) in the analysis. For this purpose we set the minimum value for the tetrahedral configuration parameter,QG≥2.5.
The parameter characterizes the tetrahedral shape such that one-dimensional array, two-dimensional plane, and three-dimensional regular tetrahedron formed by four points are given by the value 1.0, 2.0, and 3.0, respectively (von Stein et al., 1992; Robert et al., 1998). (b) The intervals contain very few discontinuities. (c) Fluctuations are weakly station-ary, in the sense that the mean fields (magnetic field, flow velocity, and density) can be regarded as nearly constant (note that the strict stationarity requires more justification from power spectra and higher order moments of the prob-ability density function. (d) The flow speed, the magnetic field magnitude, and the plasma beta are similar as shown in Table 1 to minimize the risk of mixing different solar wind phases, e.g. high-speed and low-speed streams. Figure 1 dis-plays the time series plots of the magnetic field magnitude, solar wind speed, and ion density in the three intervals, re-spectively. Frequency spectra of magnetic field fluctuations (trace of the spectral density matrix in the spacecraft frame) exhibit the power-law with the index close to−5/3 at fre-quencies up to almost 1 Hz in all the three intervals (Fig. 2), confirming the typical power spectra in the solar wind in the low-frequency range.
Fig. 1. Three time intervals displaying magnetic field magnitude, flow speed, and ion density in the solar wind. The data were obtained by
fluxgate magnetometer (FGM) and electrostatic ion analyzer (CIS-HIA) on board Cluster-1 spacecraft.
Table 1. Mean values of plasma and magnetic field data in the
three analyzed intervals: Characteristic tetrahedron size of Cluster
L, flow speedV, ion number densityn, magnitude of magnetic field
B, ion temperatureT, and the plasma parameter beta.
Mean values L V n B T Beta
Units km km s−1 cm−3 nT MK 1
Interval 1 (2006) 10 000 436.11 6.76 10.74 0.36 0.73 Interval 2 (2005) 1000 446.26 3.35 7.59 0.28 0.57 Interval 3 (2002) 100 443.05 6.69 10.13 0.32 0.72
foreshock as identified in high-frequency (2–80 kHz) electric field data from the WHISPER instrument (D´ecr´eau et al., 2001), although the intervals are uncontaminated by back-streaming ions associated with low-frequency foreshock ac-tivity. The interval 1 is the one that doesn’t contain much electron foreshock activity, but the high-frequency wave data are nevertheless disturbed by the WHISPER sounding ex-periment. In addition, the spacecraft tetrahedral configura-tion is not strictly regular; planarity and elongaconfigura-tion are not the smallest. Interpreting the fluctuation properties there-fore needs special care. Quantitative analysis is performed to judge if the measured anisotropy is of natural origin and not “fake” anisotropies produced by irregular tetrahedron. 2.2 Data analysis
The three-dimensional wave-vector spectra were determined according to the procedure described in Narita et al. (2010b). In the first step, we determined the 12×12 cross spectral density (CSD) matrix in the frequency domain (in the space-craft frame). Each element of the matrix represents cross-correlation of the magnetic field variation for different pairs of three components of the field measured at four spacecraft. For the interval 2 and 3, the data are split into 7 and 17
sub-Fig. 2. Frequency spectra of magnetic field fluctuations in the three
analyzed intervals: the upper curve in thin color is the spectrum for the interval 1, the lower curve the interval 2, and the middle curve in black the interval 3. The data are taken from fluxgate magnetometer on board Cluster, and the spectra are averaged over 4 spacecraft. Horizontal bars represent frequency ranges used in the wave vector analysis. Vertical bar with notation “95 %” at bottom left represents the confidence interval for the average number of sub-intervals used in the analysis.
[image:3.595.314.541.279.429.2]power spectra in the wave-vector domain based on measure-ments only at several spatial points. In this projection method the filter coefficients are chosen so as to minimize the vari-ance of the filter output under two constraints. The first is that the response of the filter is unity at the wave vector so as not to change the amplitude of waves by the projection, and the other is the divergence-free condition of the magnetic field. In the wave telescope technique, the wave vector serves as a parameter in the analysis, and the filter coefficients (pro-jection weights) are determined not only by the wave vector but also by the measured CSD matrix itself for the purpose of reducing noise that comes from interference or cross-talk between different wave vectors in the spectral analysis.
The wave telescope technique can be regarded as a fitting procedure with propagating plane waves at various pairs of frequencies and wave vectors; this technique can determine the sign of wave vectors without use of cross helicity (which requires flow velocity data). Examples of distinguishing be-tween forward and backward propagation directions using the wave telescope are displayed in Glassmeier et al. (2001) and Narita et al. (2009). In the spacecraft frame the acces-sible wave vectors are symmetric with respect to changing the sign. However, when the measurement is performed in a stream such as in the solar wind the accessible frequen-cies and wave vectors in the plasma rest frame (co-moving frame with the flow) become asymmetric between the flow direction and the opposite direction to it, which needs to be taken into account. The concept of the projection method for multi-point data analysis can further be applied to vari-ous fluctuation geometries, e.g. for spherical wave patterns (Constantinescu et al., 2006, 2007), and for phase-shifted wave patterns for field line resonances of geomagnetic fields (Plaschke et al., 2008).
In the third step, we obtain the fluctuation power by tak-ing the trace of the reduced matrix as a function of frequen-cies and wave vectors in the spacecraft frame. The energy distribution is then transformed into the plasma rest frame by correcting for the Doppler shift. The mean flow veloc-ity obtained by the electrostatic ion analyzer CIS-HIA on board Cluster (R`eme et al., 2001) is used for the Doppler correction.
Figure 3 displays the three-dimensional wave-vector spec-tra for the three intervals (and therefore on different spa-tial scales). For the purpose of comparison, the wave-vector ranges of the spectra are trimmed and presented as stereographic cubes with the maximum wave numbers 0.0001 rad km−1, 0.001 rad km−1, and 0.01 rad km−1for the intervals 1, 2, and 3, respectively. The spectra are presented in the MFA (mean-field-aligned) coordinate system spanned by the mean magnetic field along the z-axis (thekkaxis) and
the flow direction in the xz-plane (thek⊥1-kk-plane). The
mean magnetic field and the flow velocity can be regarded as nearly constant within accuracy 1 % or even better. For representation, the three-dimensional distributions are aver-aged over the directions normal to the xy-, xz-, and yz-planes and displayed as three surfaces/contours on the cubes. Three-dimensional wave-vector spectra provide information on the symmetries and energy cascade directions (indicated by the extended structures of the spectra) in solar wind turbulence. We find the following symmetric or extension properties of the spectra.
On the spatial scale about 10 000 km (interval 1), the spec-trum exhibits an anisotropic structure extended perpendicu-lar to the mean magnetic field direction (left and right side panels,k⊥1-kkandk⊥2-kk planes). Furthermore, the
spec-trum is asymmetric around the mean field direction, too (top panel,k⊥1-k⊥2plane). The spectrum is roughly symmetric with respect to changing the sign of the wave vector.
On the spatial scale about 1000 km (interval 2), the spec-trum also exhibits an extended structure perpendicular to the mean field (left side panel,k⊥2-kkplane). On the other hand,
there is a moderate, secondary extended structure oblique from the mean field direction (right side panel,k⊥1-kkplane).
The axisymmetry around the mean field is broken and the spectrum is extended perpendicular to the flow direction (top panel,k⊥1-k⊥2plane). The spectrum is again roughly sym-metric with respect to changing the sign of the wave vector.
Fig. 3. Stereographic representation of the three-dimensional wave-vector spectra of fluctuating magnetic field in the solar wind for the
three time intervals shown in Fig. 1. The spectra are presented in the MFA (mean-field-aligned) coordinate system spanned by the mean magnetic field (in the z-axis orkk-axis) and the flow direction (in the xz-plane ork⊥1-kk-plane) and averaged over the directions normal to
the displayed plane. The confidence intervals at the color scales are based on the degree of freedom used for averaging over frequencies, wave numbers, and sub-intervals (for the interval 2 and 3).
magnetic field the spectrum is more gyrotropic than that in the interval 2, i.e. the asymmetry between thek⊥1andk⊥2 components is weaker than that on the 1000 km scale. The spectrum is again nearly symmetric with respect to changing the sign of the wave vector. Interestingly, the oblique, ex-tended structure in thek⊥1-kkplane was found to be roughly
perpendicular to the flow direction (about 100 degrees). While the effects of irregular tetrahedron on the measure-ment of spectral anisotropy were minimized by event selec-tion, the tetrahedral formation of the four spacecraft is not strictly regular in reality. It is therefore natural to ask if the detected anisotropies are physically relevant. Also, some of the recipcocal vectors happened to be nearly perpendicular to either the mean magnetic field direction or the flow direction. Angles of the longest reciprocal vectors of the tetrahedron are 106, 123, and 81 degrees from the mean magnetic field for interval 1, 2,3, respectively, and 59, 165, and 146 degrees from the flow direction. Angles of the shortest reciprocal vectors are 89, 50, and 41 degrees from the mean magnetic field, and 138, 97, and 118 degrees from the flow direction. For this purpose the measured anisotropies were evaluated quantitatively and compared with that caused by the irregular shape of tetrahedron using synthetic data. The anisotropy in-dexAconveniently describes the elliptical shape of the spec-trum in two dimensions, introduced by Shebalin et al. (1983) and later by Saito et al. (2008):
A=6kk 2
aE(ka,kb) 6kk2bE(ka,kb)
, (1)
wherekaandkbdenote the wave numbers in the maximum
extended direction (or semi-major axis) and the minimum ex-tended direction (semi-minor axis) in the two-dimensional spectrum, E(ka,kb), respectively. Summation6k is taken
over ka andkb. This index essentially measures the ratio
of the second order moments of the distribution (the width, namely) between the maximum and minimum extended di-rections by fitting the distribution with an ellipse. The values of the anisotropy index for the three planes (k⊥1-k⊥2,k⊥1-kk,
andk⊥2-kk) are graphically presented in Fig. 4 as a function
of the tetrahedron configuration parameterQGfor the three
time intervals.
The maximum anisotropy is found in the interval 2 (on 1000 km scale),k⊥2-kk-plane; and the minimum anisotropy
in the interval 3 (on 10 000 km scale), k⊥1-k⊥2-plane. The values of the anisotropy index are separated from one plane to another in the three intervals. The average anisotropy in-dex is about 2.0 in thek⊥1-kk andk⊥2-kk planes, and 1.6
in thek⊥1-k⊥2 plane. Error bars represent the variation of tetrahedral shape during the measurement (horizontal bars) and its effect on the anisotropy index (vertical bars, but they are smaller than the plotted symbol size). Dotted curve at the bottom in Fig. 4 represents anisotropy caused by the ir-regular shape of tetrahedron. Numerical test using synthetic data presented in Narita et al. (2010b) was extended to ir-regular, tetrahedral configuration at various values of QG.
Fig. 4. Values of the anisotropy index as a function of the
tetrahe-dral configuration parameterQG. The numbers (1)–(3) at the top of the panel denote the analyzed time interval. Three symbols denote the three projected planes in Fig. 3 for each time interval. Error bars reflect the variation of tetrahedral shape during the measure-ment. Dotted curve represent the artificial anisotropy produced by irregular tetrahedron.
the sensor tetrahedral configuration is not regular. This artifi-cial anisotropy is larger at smaller values ofQG(more
irreg-ular tetrahedron), and becomes minimum as the value ofQG
approaches to 3.0 (more regular tetrahedron). The artificial anisotropy is, however, at most about 1.2 for the tetrahedral configurations in the analyzed time intervals and is smaller than the measured values except for the k⊥1-k⊥2 plane in the interval 3. This justifies the anisotropy and asymmetry in field structure in solar wind turbulence most likely to be physically relevant.
3 Discussion and conclusions
To summarize the properties of the three-dimensional en-ergy spectra, we find that anisotropy exists on all the three investigated scales from 10 000 km down to 100 km, and axi-ally asymmetric, too. The anisotropy cannot be explained by the irregular tetrahedral shapes alone, and must reflect some physical mechanism in solar wind turbulence. It is interesting to compare our results with that derived from single space-craft measurements. Podesta (2009) argues, for example, that the frequency spectrum of magnetic field fluctuations in the high-speed solar wind is approximately azimuthally symmetric about the mean field both in the inertial range (corresponding to 10 000 to 1000 km scales in our work) and dissipation/dispersion range (100 km in our work). The spa-tial structure of solar wind turbulence, in particular around the mean magnetic field, might be different between low-speed and high-low-speed streams. The three-dimensional energy spectra prefer extension primarily perpendicular to the mean magnetic field, and furthermore perpendicular to the mean flow direction on the intermediate and small scales (1000
and so on. The spectral anisotropy and asymmetry in our re-sults should be extended to a variety of solar wind intervals of Cluster data including intervals with more regular tetrahedral configuration and also uncontaminated by electron foreshock activities.
The origin and mechanism of spectral anisotropy and asymmetry would be an interesting topic for understanding spatial and temporal structure of solar wind turbulence. Our data analysis shows that the spectral anisotropy prefers the sense of energy cascade perpendicular to the mean magnetic field, and there are several possible explanations: (1) the anisotropy already exists in the solar corona and it is simply transported by the solar wind, (2) it develops in the interplan-etary space by scattering of Alfv´en waves, or (3) it develops due to radial expansion of the solar wind in the heliosphere. Large-amplitude Alfv´en waves are known to exist in the so-lar wind (Belcher and Davis, 1971) and theoretical studies have shown that large-amplitude Alfv´en waves are subject to decay and modulational instabilities, collapsing into daugh-ter waves (Goldstein, 1978; Longtin and Sonnerup, 1986; Terasawa et al., 1986; Wong and Goldstein, 1986). It is, however, questionable if these instabilities are relevant be-cause they require a “pump” wave. Radial expansion of the solar wind may influence solar wind turbulence. Grappin (1996) demonstrated in numerical simulation that the expan-sion of the solar wind plasma causes stretching of eddies and anisotropy. As Roberts et al. (1987a,b) argued, large-scale inhomogeneity must be present in the solar wind and turbu-lence can actively be excited along with its divergent flow.
One may consider our results such that fluctuations in the N direction in theRT N coordinate system (pointing the di-rection of Sun’s rotation axis in the solar equatorial plane) have no projection along the radial direction while fluctua-tions in the T direction do (perpendicular to the radial di-rection from the Sun and to Sun’s rotatio axis). There may well be kinetic interaction with theδBT component and not
withδBN. The simple implication would be not only
interaction. Further studies of the three-dimensional spec-tra using Cluster data under various conditions of the solar wind and the tetrahedron sizes will verify our results and the possible causes of anisotropy.
Acknowledgements. This work was financially supported by Bun-desministerium f¨ur Wirtschaft und Technologie and Deutsches Zentrum f¨ur Luft- und Raumfahrt, Germany, under con-tract 50 OC 0901.
Guest Editor A. Masson thanks S. P. Gary and J. Vogt for their help in evaluating this paper.
References
Alexandrova, O., Saur, J., Lacombe, C., Mangeney, A., Mitchell, J., Schawartz, S. J., and Rober, P.: Universality of solar wind tur-bulent spectrum from MHD to electron scale, Phys. Rev., Lett., 103, 165003, doi:10.1103/PhysRevLett.103.165003, 2009. Bale, S. D., Kellogg, P. J., Mozer, F. S., Horbury, T. S., and
Reme, H.: Measurement of the electric fluctuation spectrum of magnetohydrodynamic turbulence, Phys. Rev. Lett., 94, 215002, doi:10.1103/PhysRevLett.94.215002, 2005.
Balogh, A., Carr, C. M., Acu˜na, M. H., Dunlop, M. W., Beek, T. J., Brown, P., Fornacon, H., Georgescu, E., Glassmeier, K.-H., Harris, J., Musmann, G., Oddy, T., and Schwingenschuh, K.: The Cluster Magnetic Field Investigation: overview of in-flight performance and initial results, Ann. Geophys., 19, 1207–1217, doi:10.5194/angeo-19-1207-2001, 2001.
Behannon, K. W.: Heliocentric distance dependence of the inter-planetary magnetic field, Rev. Geophys., 16, 125–145, 1978. Belcher, J. W. and Davis, L.: Large-amplitude Alfv´en waves in the
interplanetary medium, J. Geophys. Res., 76, 3534–3563, 1971. Bieber, J. W., Matthaeus, W. H., Smith, C. W., Wanner, W.,
Kallen-rode, M.-B., and Wibberenz, G.: Proton and electron mean free paths: The Palmer consensus revisited, Astrophys. J., 420, 294– 306, 1994.
Bieber, J. W., Wannger, W., and Matthaeus, W. H.: Dominant two-dimensional solar wind turbulence with implications for cosmic ray transport, J. Geophys. Res., 101, 2511–2522, 1996. Capon, J.: High resolution frequency-wavenumber spectrum
analy-sis, Proc. IEEE, 57, 1408–1418, 1969.
Coleman Jr., P. J.: Turbulence, viscosity, and dissipation in the solar-wind plasma, Astrophys. J., 153, 371–388, 1968.
Constantinescu, O. D., Glassmeier, K.-H., Motschmann, U., Treumann, R. A., Fornac¸on, K.-H., and Fr¨anz, M.: Plasma wave source location using CLUSTER as a spherical wave telescope, J. Geophys. Res., 111, A09221, doi:10.1029/2005JA011550, 2006. Constantinescu, O. D., Glassmeier, K.-H., D´ecr´eau, P. M. E., Fr¨anz, M., and Fornac¸on, K.-H.: Low frequency wave sources in the outer magnetosphere, magnetosheath, and near Earth solar wind, Ann. Geophys., 25, 2217–2228, doi:10.5194/angeo-25-2217-2007, 2007.
Dasso, S., Milano, L. J, Matthaeus, W. H., and Smith, C. W.: Anisotropy in fast and slow solar wind fluctuations, Astrophys. J., 635, L181–L184, 2005.
D´ecr´eau, P. M. E., Fergeau, P., Krasnoselskikh, V., Le Guirriec, E., L´evˆeque, M., Martin, Ph., Randriamboarison, O., Rauch, J. L., Sen´e, F. X., S´eran, H. C., Trotignon, J. G., Canu, P., Cornilleau, N., de F´eraudy, H., Alleyne, H., Yearby, K.,
M¨ogensen, P. B., Gustafsson, G., Andr´e, M., Gurnett, D. C., Darrouzet, F., Lemaire, J., Harvey, C. C., Travnicek, P., and Whisper experimenters: Early results from the Whisper instru-ment on Cluster: an overview, Ann. Geophys., 19, 1241–1258, doi:10.5194/angeo-19-1241-2001, 2001.
Denskat, K. U., Beinroth, H. J., and Neubauer, M. F.: J. Geophys, 54, 60–67, 1983.
Escoubet, C. P., Fehringer, M., and Goldstein, M.: Introduc-tion: The Cluster mission, Ann. Geophys., 19, 1197–1200, doi:10.5194/angeo-19-1197-2001, 2001.
Glassmeier, K.-H., Motschmann, U., Dunlop, M., Balogh, A., Acu˜na, M. H., Carr, C., Musmann, G., Fornac¸on, K.-H., Schweda, K., Vogt, J., Georgescu, E., and Buchert, S.: Cluster as a wave telescope – first results from the fluxgate magnetome-ter, Ann. Geophys., 19, 1439–1447, doi:10.5194/angeo-19-1439-2001, 2001 (correction in 21, 1071, 2003).
Goldstein, M. L.: An instability of finite amplitude circularly polar-ized Alfv´en waves, Astrophys. J., 219, 700–704, 1978.
Goldstein, M. L., Roberts, D. A., and Fitch, A. C.: Properties of the fluctuating magnetic helicity in the inertial and dissipation ranges of solar wind turbulence, J. Geophys. Res., 99, 11519– 11538, 1994.
Grappin, R.: Onset of anisotropy and Alfv´en waves turbulence in the expanding solar wind, Solar Wind Eight, edited by: Winter-halter, D., Gosling, J. T., Habbal, S. R., Kurth, W. S., and Neuge-bauer, M., AIP Conference Proceedings, 382, pp. 306–309, 1996. Kiyani, K. H., Chapman, S. C., Khotyaintsev, Y. V., Dunlop, M. W., and Sahraoui, F.: Global scale-invariant dissipation in col-lisionless plasma turbulence, Phys. Rev. Lett., 103, 075006, doi:10.1103/PhysRevLett.103.075006, 2009.
Leamon, R. J., Smith, C. W., Ness, N. F., Matthaeus, W. H., and Wong, H. K.: Observational constraints on the dynamics of the interplanetary magnetic field dissipation range, J. Geophys. Res., 103, 4775–4787, 1998.
Longtin, M. and Sonnerup, B.: Modulational instability of circu-larly polarized Alfv´en waves, J. Geophys. Res., 91, 798–801, 1986.
Marsch, E. and Tu, C.-Y.: On the radial evolution of MHD turbu-lence in the inner heliosphere, J. Geophys. Res., 95, 8211–8229, 1990.
Matthaeus, W. H. and Goldstein, M. L.: Measurement of the rugged invariants of magnetohydrodynamic turbulence in the solar wind J. Geophys. Res., 87, 6011–6028, 1982.
Matthaeus, W. H., Goldstein, M. L., and Smith, C.: Evaluation of magnetic helicity in homogeneous turbulence, Phys. Rev. Lett., 48, 1256–1259, 1982.
Matthaeus, W. H., Goldstein, M. L., and Roberts, D. A.: Evidence for the presence of quasi-two-dimensional nearly incompress-ible fluctuations in the solar wind, J. Geophys. Res., 95, 20673– 20683, 1990
Motschmann, U., Woodward, T. I., Glassmeier, K. H., Southwood, D. J., and Pinc¸on, J. L.: Wavelength and direction filtering by magnetic measurements at satellite arrays: Generalized mini-mum variance analysis, J. Geophys. Res., 101, 4961–4966, 1996. Narita, Y., Kleindienst, G., and Glassmeier, K.-H.: Evaluation of magnetic helicity density in the wave number domain using multi-point measurements in space, Ann. Geophys., 27, 3967– 3976, doi:10.5194/angeo-27-3967-2009, 2009.
tute, Berne, Switzerland, 1998.
Plaschke, F., Glassmeier, K.-H., Constantinescu, O. D., Mann, I. R., Milling, D. K., Motschmann, U., and Rae, I. J.: Statisti-cal analysis of ground based magnetic field measurements with the field line resonance detector, Ann. Geophys., 26, 3477–3489, doi:10.5194/angeo-26-3477-2008, 2008.
Podesta, J. J.: Dependence of solar-wind power spectra on the di-rection of the local mean magnetic field, Astrophys. J., 698, 986– 999, doi:1.1088/0004-637X/698/2/986, 2009.
Podesta, J. J., Roberts, D. A., and Goldstein, M. L.: Spectral expo-nents of kinetic and magnetic energy spectra in solar wind turbu-lence, Astrophys. J., 664, 543–548, doi:10.1086/519211, 2007. R`eme, H., Aoustin, C., Bosqued, J. M., Dandouras, I., Lavraud,
B., Sauvaud, J. A., Barthe, A., Bouyssou, J., Camus, Th., Coeur-Joly, O., Cros, A., Cuvilo, J., Ducay, F., Garbarowitz, Y., Medale, J. L., Penou, E., Perrier, H., Romefort, D., Rouzaud, J., Vallat, C., Alcayd´e, D., Jacquey, C., Mazelle, C., d’Uston, C., M¨obius, E., Kistler, L. M., Crocker, K., Granoff, M., Mouikis, C., Popecki, M., Vosbury, M., Klecker, B., Hovestadt, D., Kucharek, H., Kuenneth, E., Paschmann, G., Scholer, M., Sckopke, N., Seiden-schwang, E., Carlson, C. W., Curtis, D. W., Ingraham, C., Lin, R. P., McFadden, J. P., Parks, G. K., Phan, T., Formisano, V., Amata, E., Bavassano-Cattaneo, M. B., Baldetti, P., Bruno, R., Chion-chio, G., Di Lellis, A., Marcucci, M. F., Pallocchia, G., Korth, A., Daly, P. W., Graeve, B., Rosenbauer, H., Vasyliunas, V., Mc-Carthy, M., Wilber, M., Eliasson, L., Lundin, R., Olsen, S., Shel-ley, E. G., Fuselier, S., Ghielmetti, A. G., Lennartsson, W., Es-coubet, C. P., Balsiger, H., Friedel, R., Cao, J.-B., Kovrazhkin, R. A., Papamastorakis, I., Pellat, R., Scudder, J., and Sonnerup, B.: First multispacecraft ion measurements in and near the Earth’s magnetosphere with the identical Cluster ion spectrometry (CIS) experiment, Ann. Geophys., 19, 1303–1354, doi:10.5194/angeo-19-1303-2001, 2001.
Robert, P., Roux, A., Harvey, C. C., Dunlop, M. W., Daly, P. W., and Glassmeier, K.-H.: Tetrahedron geometric factors, in: Analysis Methods for Multi-Spacecraft Data, pp. 323–348, ISSI Scientific Report SR-001, edited by: Paschmann, G. and Daly, P. W., Inter-national Space Science Institute, ISSI/ESA, 1998.
lence at the electron gyroscale, Phys. Rev. Lett., 102, 231102, doi:10.1103/PhysRevLett.102.231102, 2009.
Sahraoui, F., Belmont, G., Goldstein, M. L., and Rezeau, L.: Lim-itations of multispacecraft data techniques in measuring wave number spectra of space plasma turbulence, J. Geophys. Res., 115, A04206, doi:10.1029/2009JA014724, 2010a.
Sahraoui, F., Goldstein, M. L., Belmont, G., Canu, P., and Rezeau, L.: Three dimensional anisotropic k spectra of turbulence at sub-proton scales in the solar wind, Phys. Rev. Lett., 105, 131101, doi:10.1103/PhysRevLett.105.131101, 2010b.
Saito, S., Gary, S. P., Li, H., and Narita, Y.: Whistler turbu-lence: Particle-in-cell simulations, Phys. Plasmas, 15, 102305, doi:10.1063/1.2997339, 2008.
Shebalin, J. V., Matthaeus, W. H., and Montgomery, D.: Anisotropy in MHD turbulence due to a mean magnetic field, J. Plasma Phys, 29, 525–547, 1983.
Smith, C. W., Hamilton, K., Vasquez, B. J., and Leamon, R. J.: Dependence of the dissipation range spectrum of interplanetary magnetic fluctuations on the rate of energy cascade, Astrophys. J., 645, L85, doi:10.1029/2006JA011651, 2006.
Taylor, G. I.: The spectrum of turbulence, Proc. R. Soc. Lond. A, 164, 476–490, 1938.
Terasawa, T., Hoshino, M., Sakai, J.-I., and Hada, T.: Decay insta-bility of finite-amplitude circularly polarized Alfv´en waves: A numerical simulation of stimulated brillouin scattering, J. Geo-phys. Res., 91, 4171–4187, 1986.
von Stein, R., Glassmeier, K.-H., and Dunlop, M.: A configura-tion parameter for the Cluster satellites, Tech. Rep. 2/1992, Insti-tut f¨ur Geophysik und Meteorologie der Technischen Universit¨at Braunschweig, 1992.