Improved Filter Selection Method for Filter Bank
Common Spatial Pattern for EEG-Based BCI
Systems
Geun-Ho Park, Yu-Ri Lee, and Hyoung-Nam Kim
Pusan National University/Department of Electrical & Computer Engineering, Busan, Republic of Korea Email: [email protected]
Abstract—In this paper, we propose an improved filter selection method using Welch’s t-test based on discriminative filter bank common spatial pattern (DFBCSP). Existing DFBCSP used the Fisher ratio in order to find out discriminative filters. However, the Fisher ratio can be used to know only comparative value of distinguishability but may not become a meaningful criterion to reject null hypothesis. As a reasonable alternative, we have introduced the Welch’s t-test to find out not only contributory but also redundant filters used to classify features efficiently. Experimental results show that the classification accuracy increased by 1.28% on average when using the proposed filter selection method.
Index Terms—Brain-Computer Interface (BCI), Electroencephalography (EEG), Common Spatial Pattern (CSP), Discriminative Filter Bank Common Spatial Pattern (DFBCSP), Welch’s t-test
I. INTRODUCTION
Brain-Computer Interface (BCI) is a direct communication system between a human brain and a computer without any conventional input devices. In order to obtain useful information from brain signals, most of BCI systems use scalp electroencephalography (EEG) because of its feasibility. EEG is the measurement of an electrical signal induced by neuron activity. Because EEG usually represents some patterns related to subject’s intention, BCI utilizes these useful features including important information. Especially, motor imagery conducted by imagining hand or foot movement has been an important part of studies in BCI research [1]-[3]. The performance of the BCI system mainly depends on the classification accuracy of motor imagery.
However, there are some difficulties in achieving high classification accuracy. First, EEG patterns are slightly different from each other. Personal EEG features show different patterns individually in frequency domain as well. This subject-specific difference may cause the performance degradation in non-adaptive BCI systems.
Manuscript received November 25, 2013; revised January 10, 2014.
This work was supported by Basic Science Research Program through the National Research Foundation of Korea (NRF) funded by the Ministry of Education, Science and Technology (2012R1A1A2008555).
Hence, BCI needs to acquire subject-specific frequency features. Second, EEG has extremely low spatial resolution [4] as compared with other neuroimaging technology, such as magnetic resonance imaging (MRI) and positron emission tomography (PET), because of the conductivity of scalp. At multi-channel environment, low spatial resolution makes it hard to analyze EEG patterns and to decide correct subject’s intention. Therefore, it is essential to apply spatial filtering technique in order to solve this problem. Common spatial pattern (CSP) has been extensively investigated, especially in the field of constructing a spatial filter that maximizes the difference in variance of each motor task [5]-[8]. However, CSP has a shortcoming that the proper frequency band discriminating two tasks should be manually found through repeated experiments. To simplify this manual processing method, modified BCI systems were proposed by introducing sub-band common spatial pattern (SBCSP) [9], filter bank common spatial pattern (FBCSP) [10], and discriminative filter bank common spatial pattern (DFBCSP) [11].
The process of automatic frequency-band selection was proposed in DFBCSP, where more informative frequency bands were found in accordance with subjects by calculating the signal power and the Fisher ratio in each band. However, DFBCSP involved fixed number of filters, resulting in fixed feature dimensions. However, to enhance the classification accuracy in using DFBCSP, the number of filters is needed to be properly varied whenever subjects or EEG data are changed. To find the proper number of filters, additional analysis is required to investigate the classification accuracy according to the number of filters. This inconvenient process is not suitable for machine-learning based BCI systems. In this paper, to solve this problem, Welch’s t-test [12] is introduced to automatically decide the proper number of filters. In addition, the proposed BCI system improves the classification accuracy by selecting suitable feature dimensions and removing redundant frequency bands.
Welch’s t-test. The simulation results are presented in Section III. Finally, conclusions are drawn in Section IV.
Discriminative filter bank Filter bank
Classifier
(SVM)
Classification accuracy EEG signal
(Training)
Band-selection using the Fisher ratio
Common spatial pattern
EEG signal (Test)
2 W
3 W
4 W
1 W
k
W
k1, , 4
Feature vectorsv
4
K
2( )
d n
1( )
d n
4( )
d n
3( )
d n
2( )
h n
1( )
h n
12( )
h n
Figure 1. Block diagram of the discriminative filter bank common spatial pattern.
Band-selection Using the Welch`s t-test
Discriminative filter bank Filter bank
Classifier
(SVM)
Classification Accuracy EEG signal
(Training)
p
EEG signal (Test)
Common spatial pattern
2 W
K
W 1 W
K
k1, , K k
W 2( )
h n
1( )
h n
12( )
h n
Feature vectorsv 2( )
d n
1( )
d n
( ) K
d n
Figure 2. Block diagram of the proposed discriminative filter bank common spatial pattern.
II. METHODS
A. Common Spatial Pattern (CSP) [5]
The Common spatial pattern (CSP) algorithm is effective in constructing an optimal spatial filter that discriminates two classes of EEG signals by diagonalizing two spatial covariance matrices simultaneously [5]. Each normalized spatial covariance matrix can be obtained by
trace
T i i
i T
i i
X X
C
X X
(1)
where
i
group of spatial covariance matrix. Using these averaged spatial covariance matrices, a composite spatial covariance matrix is obtained by
1 2
c
C C C (2)
The composite matrix Ccis factored as T
c c c c
C S Λ S
where Sc is an eigenvector matrix and
c
Λ is a diagonal matrix of eigenvalues. Using a whitening transformation
matrix 1 T
c c
A Λ S , each averaged spatial covariance matrix is transformed as
1 1
T
E AC A and 2 2 T
E AC A (3)
Because E1 and E2 have common eigenvectors, E1
and E2 are also factored as 1 1 T
E MΛ M
And 2 2 T
E MΛ M and Λ1Λ2I (4) where M is an eigenvector matrix and Λi is a diagonal
matrix of eigenvalues. In (4), eigenvalues in Λ1 are
assumed to be sorted in descending order. Since the sum of two eigenvalue matrices is an identity matrix, the eigenvector corresponding to the largest eigenvalue in Λ1
has the smallest eigenvalue inΛ2and vice versa. Using
this property, the eigenvector matrix M is useful for classifying each task. Some eigenvectors with large eigenvalues in Λ1 or Λ2 can be used for extracting
feature vectors of test EEG signals. Since the most discriminative eigenvectors are the first and last columns of M(NN), submatrix M'(N2m) can be determined by extracting the first m columns and the last m columns of M.
Finally, the projection matrix W is obtained by
T
W A M (5)
And the decomposition of a test EEG signal X is calculated by
T
Z W X (6)
Since the X is projected onto the spatial filter W, the feature vectors used for classifying two tasks can be calculated by the p-th row vector zp (p1, 2, , 2 )m of
signal Z. The feature vector
1 2 2
[ , , , , , ]T
p m
v v v v
v can be obtained by
2 1 var log var p p m j j v
z z (7)The projection matrix W is also obtained by minimizing the Rayleigh quotient of the spatial covariance matrices to achieve high discriminability of EEG data X1 and X2 [13]. The projection matrix W can
be briefly estimated by
1 2 trace( ) arg max trace( ) T T W
W C W W
W C W
(8)
where
i
C is the averaged covariance matrix of EEG data
i
X.
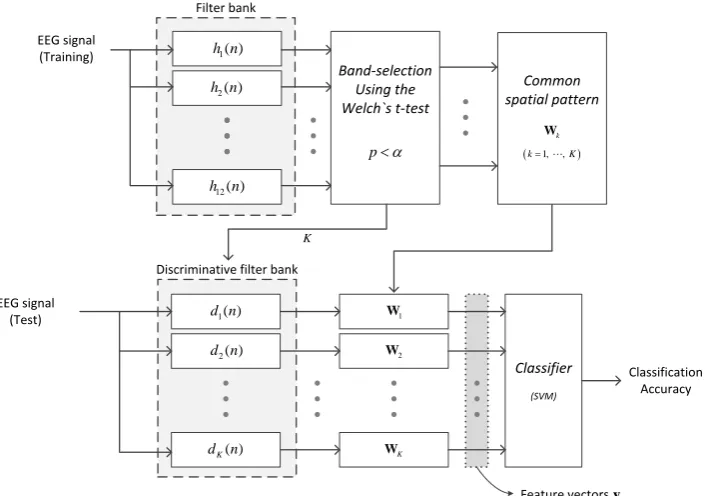
B. Discriminative Filter Bank Common Spatial Pattern (DFBCSP) [11]
DFBCSP was proposed to find the subject-specific frequency band which discriminates one task from the other as in Fig. 1 [11]. To find discriminative frequency band adaptively, filter bank is introduced to CSP-based BCI system. Filter bank is made up of twelve band-pass filters covering 6-32Hz. Each filter h nj( ) (j=1,∙∙∙, 12) has
4Hz pass-band and is laid to overlap 2Hz with adjacent other filter’s pass-band.
To find out subject-specific frequency bands, the average power of EEG signal,
P
i j, can be obtained from2 , , 1 1 ( [ ]) T
i j i j
n
P x n
T
(9)where
x
i j, is jth band-pass filtered EEG signal and T isthe number of the samples. The Fisher ratio
F
j, whichmeans how much the tasks are well distinguished, can be obtained by 2 1 2 2 2 1 2 ( ) j X X F s s
(10)
where Xiis the sample mean of
P
i j, and 2i
s
is the samplevariance of
P
i j, . Out of twelve filters, K filters (d nk( ),k=1,∙∙∙,K) which have the largest Fisher ratio are selected to establish discriminative filters. In [11], K was determined to four as shown in Fig. 1.
C. Welch’s T-Test [12]
T-test is used to verify a hypothesis if the test statistic of null hypothesis follows t-distribution. Especially, Welch’s t-test is used to verify the null hypothesis which assumes that two populations have same sample mean [12]. The p-value is a probability of obtaining a test statistic on condition that null hypothesis is true. If the p -value is less than significance level, generally 0.05 or 0.01, null hypothesis is rejected.
D. DFBCSP Using the Welch’s T-Test
of discriminative filters K is an integer value in 1 ≤ K ≤ 6. To calculate a p-value, test statistic as in (11) and degree of freedom as in (12) can be obtained by [12]
1 2
2 2 1 2
1 2
X X
t
s s
T T
(11)
2 2 2 1 2
1 2
4 4
1 2
1 2
2 2
1 2
s s T T
s s
T T
(12)
where
X
i is sample mean,s
i2 is sample variance,T
i isthe number of samples and
i
T
i1
. T-distribution varies according to degree of freedom which can be obtained from (12).III. SIMULATION RESULTS
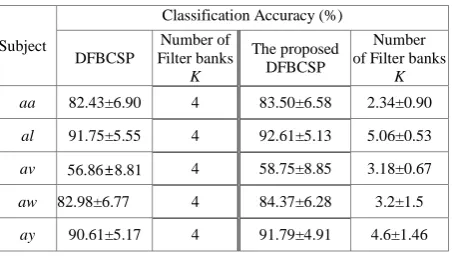
BCI competition III data set IVa [5] was used to verify the performance of the proposed method. EEG signal was measured from five subjects named 'aa', 'al', 'av', 'aw', and 'ay'. Each subject was indicated to conduct right hand and foot imagery when the cue appeared on the monitor screen and 280 trials were performed for each subject. EEG data were extracted from 7 electrodes near the sensorimotor area, i.e., F3, F4, C3, Cz, C4, P3 and P4. Support Vector Machine (SVM) [14] was used to classify the feature vector. In order to precisely estimate the performance of the BCI system with the fixed number of filters (conventional) and the variable number of filters (proposed), 10ⅹ10-fold cross-validation was used [11].
TABLE I. PERFORMANCE COMPARISON WITH DFBCSP AND THE PROPOSED DFBCSP(MEAN±STANDARD DEVIATION)
Subject
Classification Accuracy (%)
DFBCSP
Number of Filter banks
K
The proposed DFBCSP
Number of Filter banks
K
aa 82.43±6.90 4 83.50±6.58 2.34±0.90
al 91.75±5.55 4 92.61±5.13 5.06±0.53
av 56.86±8.81 4 58.75±8.85 3.18±0.67
aw 82.98±6.77 4 84.37±6.28 3.2±1.5
ay 90.61±5.17 4 91.79±4.91 4.6±1.46
The resulting classification accuracy and the number of filters used to classify feature vectors are in Table I. For all of subjects, classification accuracy was increased. For 'al' and 'ay', the numbers of filters increased as 5.06 and 4.6, respectively. However, for 'aa', ‘av’ and 'aw', the number of filters decreased as 2.34, 3.18 and 3.2, respectively. These results show that the proposed DFBCSP selects proper filters and these filters discriminate two tasks more efficiently.
IV. CONCLUSION
In this paper, Welch’s t-test was employed to DFBCSP instead of the Fisher ratio for determining the number of filters. As a result, the classification accuracy increased by 1.28% on average. The proposed DFBCSP improved the performance of the EEG-based BCI system by removing unnecessary filters which have a larger p-value than the significance level. Consequently, the results of this study confirm that the proposed DFBCSP contributes to finding out proper feature dimensions and discriminative frequency features, resulting in classifying tasks more correctly.
ACKNOWLEDGMENT
This research was supported by Basic Science Research Program through the National Research Foundation of Korea (NRF) funded by the Ministry of
Education, Science and Technology
(2012R1A1A2008555).
REFERENCES
[1] J. R. Wolpaw, “Brain-computer interfaces as new brain output path-ways,” J. Physiol., vol. 579, pp. 613-619, Mar. 2007. [2] A. Akrami, S. Solhjoo, A. Motie-Nasrabadi, and M.
Hashemi-Gol-payegani, “EEG-based mental task classification: Linear and nonlinear classification of movement imagery,” in Proc. 27th IEEE Eng. Med. Biol. Conf., Sep. 2005, pp. 4626-4629.
[3] H. Ramoser, J. Műller-Gerking, and G. Pfurtscheller, “Optimal filtering of single trial EEG during imagined hand movement,”
IEEE Trans. Rehab. Eng., vol. 8, no. 4, pp. 441-446, Dec. 2000. [4] R. Srinivasan, “Methods to improve the spatial resolution of
EEG,” International Journal of Bioelectromagnetism, vol. 1, no. 1, pp. 102-111, 1999.
[5] H. Ramoser, J. Műller-Gerking, and G. Pfurtscheller. “Optimal filtering of single trial EEG during imagined hand movement,”
IEEE Trans. Rehab. Eng., vol. 8, no. 4, pp. 441-446, Dec. 2000. [6] Z. J. Koles, J. C. Lind, and A. C. K. Soong, “Spatio-temporal
decomposition of the EEG: A general approach to the isolation and localization of sources,” Electroencephalogr. Clin. Neurophysiol., vol. 95, pp. 219-230, Oct. 1995.
[7] H. Wang, Q. Tang, and W. Zheng, “L1-norm-based common spatial patters,” IEEE Trans. Biomed. Eng., vol. 59, no. 3, pp. 653-662, Mar. 2012.
[8] M. Arvaneh, C. Guan, K. K. Ang, and C. Quek, “Optimizing spatial filters by minimizing within-class dissimilarities in electroencephalogram-based brain-computer interface,” IEEE Trans. Networks and Learning Sys, vol. 24, no. 4, pp. 610-619, April 2013.
[9] Q. Novi, C. Guan, T. H. Dat, and P. Xue, “Sub-band common spatial pattern for brain-computer interface,” in Proc. 3rd Int. Conf. Neural Eng. IEEE Eng. Med. Biol. Soc., May 2007, pp. 204-207. [10] K. K. Ang, Z. Y. Chin, H. Zhang, and C. Guan, “Filter bank
common spatial pattern (FBCSP) in brain-computer interface,” in
Proc. IEEE Int. Joint Conf. Neural Netw., June 2008, pp. 2390-2397.
[11] K. Thomas, C. Guan, C. Lau, A. Vinod, and K. Ang, “A new discriminative common spatial pattern method for motor imagery brain-computer interfaces,” IEEE Trans. Biomed. Eng., vol. 56, no. 11, pp. 2730-2733, Nov. 2009.
[12] B. L. Welch, “The generalization of “Student’s” problem when several different population variances are involved,” Biometrika, vol. 34, no. 1-2, pp. 28-35, Feb. 1947.
[13] S. Sanei, Adaptive Processing of Brain Signals, 1st ed. University of Surrey, U.K.: Wiley, 2013, ch. 6, pp. 112-115.
Geun-Ho Park received the B.S. degrees in electronic and electrical engineering from Pusan National University (PNU), Busan, Korea, in 2013. He is currently working toward the M.S. degree at the Communications and Signal Processing Laboratory (CSPL), Department of Electronics Engineering at Pusan National University (PNU), Busan, Korea. His main research interests are in the area of digital signal processing, machine-learning, in particular, bio signal processing for Brain-computer Interface (BCI).
Yu-Ri Lee received the B.S. and M.S. degree in electronic and electrical engineering from Pusan National University, Busan, Korea, in 2010 and 2012, respectively. She is currently working toward the Ph.D. degree at the Communications and Signal Processing Laboratory (CSPL), Department of Electrical & Computer Engineering at Pusan National University, Busan, Korea. Her main research interests are in the area
of digital signal processing, bio signal processing, signal processing for digital broadcasting, and SCA.
Hyoung-Nam Kim (M’00) received the BS, MS,