ISSN 0975-928X
558
Research Article
Character association and path co-efficient analysis studies on yield and yield
attributing characters in chilli (
Capsicum annuum
L.)
M. Janaki*, C. Venkata Ramana1,L. Naram Naidu1,J. Dilip Babu2,K. Koteswara Rao3 and K. Uma Krishna4
*
Scientist, HRS, Dr. Y.S.R.H.U., Peddapuram - 533 437, A.P., India.
1
HRS, Dr. Y.S.R.H.U., Lam Farm, Guntur - 522 034, A.P., India.
2
Director of Research, Dr. Y.S.R.H.U., V.R.Gudem - 534 101, A.P., India.
3
Associate Director of Research (Rtd), ANGRAU, Guntur - 522 034, A.P., India.
4
Department of Statistics, COH, Dr. Y.S.R.H.U., V.R.Gudem - 534 101 (A. P.), India. E-Mail:[email protected]
(Received: 24 Oct 2017; Revised: 25 Jun 2018; Accepted:25 Jun 2018)
Abstract
Seventy one genotypes (54 F1 hybrids, 15 parents and two commercial checks) of chilli (Capsicum annuum L.) were evaluated at
Horticultural Research Station, Lam, Guntur, Andhra Pradesh to carry out the correlation studies between twelve quantitative traits and to estimate the direct and indirect effects of yield attributing traits on yield per plant. The phenotypic and genotypic association of fruit yield per plant was significant and positive with plant height, plant spread, number of fruits per plantand days to fruit maturity indicating the importance of these traits in selection for yield. The path analysis revealed that the direct contribution of number of fruits per plant and average dry fruit weight was high and positive on yield per plant. Whereas, it was moderate, positive for days to fruit maturity and low, positive for fruit length indicated that its true relationship with yield and direct selection based on these traits may be helpful in evolving high yielding genotypes of chilli.
Keywords
Chilli, Capsicum annuum, correlation, path analysis, yield
Introduction
Chilli, known as the universal spice of India has its unique place in the diet as a vegetable cum spice crop along with additional importance of offering outstanding job and income generating opportunities for enormous small farmers in the country. It is an indispensable spice due to its pungency, taste, appealing colour and flavour. India is the largest producer (1.492 million tonnes from 0.775 million hectares), consumer and exporter of chilli in the world with productivity of 1.9 metric t/ha (National Horticulture Board, 2014). Even though India ranks first in area and production of chilli, its productivity is very low as compared to other countries like Japan (3.6 t/ha) and Korea (2 t/ha), USA and Indonesia (Patil et al., 2012). Hence, there is a need to develop high yielding varieties and hybrids. Yield is a complex character determined by several component characters (Singh, 2005). Improvement in yield is possible only through selection for the desired component characters. For evaluating the yield potential of any variety, it is necessary to give attention to all the yield contributing characters. It is essential to assess the degree of association of various quantitative characters with yield in order to effective selection programme. Hence, the knowledge of association of the various plant characters with yield and among themselves is required so that a rational choice of characters for selection can be exercised. The correlation coefficient analysis measures the mutual relationship between various characters and it determines the component traits on which selection can be relied upon the effect of improvement. Assessing the direct and indirect effects of each component towards yield through path
coefficient analysis would help in identifying the reliable characters contributing to yield. Studies on this aspect in chilli were made by several earlier workers
viz. Jogi et al. (2013), Vikram et al. (2014) and Rohini & Lakshmanan (2015). Therefore the investigation was carried out to determine the nature and degree of association among the characters and their direct and indirect effects on chilli yield.
Materials and Methods
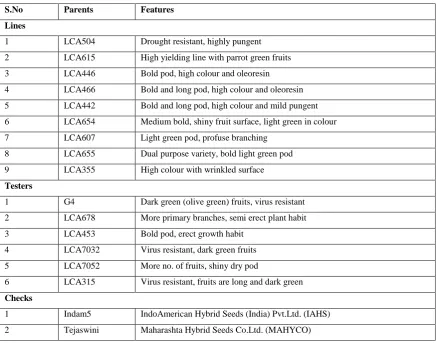
An experiment was conducted at Horticulture Research Station, Dr. Y. S. R. Horticultural University, Lam farm, Guntur. The experimental material and their characters used in this experiment were presented in Table 1. The experimental material comprised of nine lines (LCA 504, LCA 615, LCA 446, LCA 466, LCA 442, LCA 654, LCA 607, LCA 655 and LCA 355) and six testers (G4, LCA 678, LCA 453, LCA 703-2, LCA 705-2 and LCA 315). These parents were crossed in Line × Tester fashion during Kharif, 2013-14 and developed 54 F1 hybrids. The resulting 54 F1 hybrids
along with their 15 parents and two commercial checks (Tejaswini and Indam-5) were evaluated during Kharif,
ISSN 0975-928X
559 fruit weight (g), dry fruit yield per plant (g), number of
seeds per fruit and seed weight (g/1000 seed).
Phenotypic and genotypic correlations were worked out by using formula suggested by Falconer (1964). The direct and indirect effects were computed by using the procedure suggested by Wright (1921) and elaborated by Dewey and Lu (1959).
Results and Discussion
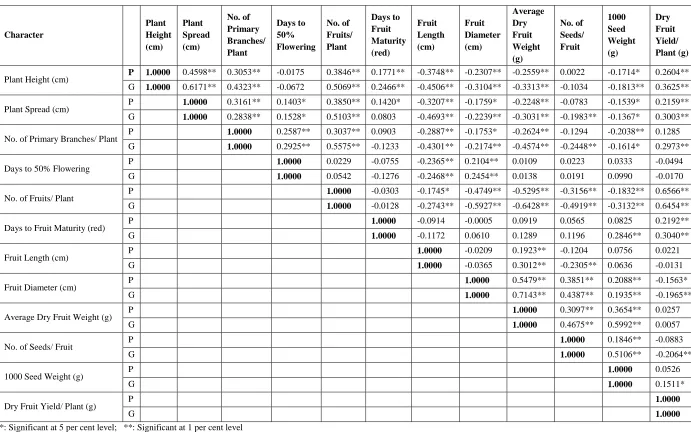
In the present study, the estimates of phenotypic and genotypic correlation coefficients (Table 2) depicted that the genotypic correlations were higher than the corresponding phenotypic correlations for most of the traits indicated presence of high heritability for that respective traits. Moreover, it may be due to masking effect of environment causing differential genotypic and phenotypic expression of these traits. These studies are in conformity with the earlier observations of Krishnamurthy et al. (2013), Janaki et al. (2016) and Sharma and Sridevi (2016).
The fruit yield per plant exhibited significant and positive phenotypic and genotypic association with plant height (rp0.2604, rg0.3625), plant spread
(rp0.2159, rg0.3003) , number of fruits per plant
(rp0.6566, rg0.6454) and days to fruit maturity
(rp0.2192, rg0.3040) indicating the usefulness of these
traits upon improvement of fruit yield in chilli, whereas its association with no. of primary branches per plant (rg0.2973) and seed weight (rg0.1511) was significant
and positive only at genotypic level (Table 2). Hence, fruit yield can be improved by selecting the lines with maximum plant height & plant spread, more number of fruits per plant & maximum days to fruit maturity. Similar results have been reported in chillies by Hasanuzzaman and Golam (2011) and Rohini & Lakshmanan (2015) who have also observed significant positive correlation of various yield attributing traits with fruit yield.
The inter relationship among the plant height, plant spread, no. of primary branches per plant and no. of fruits per plant was positive and significant at both phenotypic and genotypic levels (Table 2). These results are in conformity with earlier findings of Reddy
et al. (2008) and Jogi et al. (2013). Similarly the inter relationship among the fruit diameter, average dry fruit weight, number of seeds per fruit and 1000 seed weight was positive and significant at both phenotypic and genotypic levels (Table 2). These results indicated that increase in one trait leads to increase in other correlated traits. These results are in agreement with reports of Hasanuzzaman and Golam (2011) and Kumar et al. (2012).
Fruit length and fruit diameter showed negative and significant association with plant height, plant spread, no. of primary branches per plant, days to 50% flowering and no. of fruits per plant (Table 2). Similar findings were reported by Tembhurne et al. (2008). Similarly average dry fruit weight and 1000 seed weight exhibited negative and significant association with plant height, plant spread, no. of primary branches per plant and no. of fruits per plant (Table 2). These results are
supported by earlier findings of Tembhurne et al.
(2008) and Sharma et al. (2010) in chilli. These results indicated that increase in fruit length/fruit diameter/average dry fruit weight/1000 seed weight/all leads to decrease in other negatively correlated traits and vice-versa. No. of seeds per fruit showed negative, significant correlation with plant spread, no. of primary branches per plant and fruit length at genotypic level while with no. of fruits per plant at both phenotypic and genotypic levels (Table 2). These results indicated that increase in no. of seeds per fruit leads to decrease in other negatively correlated traits and vice-versa. Kumar
et al. (2012) has also reported similar findings in chilli. Fruit length exhibited significant, positive association with average dry fruit weight (rp0.1923, rg0.3012)
whereas it showed significant, negative association (rg
-0.2305) with no. of seeds per fruit which revealed that increase in fruit length associated with increase in average fruit weight and decrease in no. of seeds per fruit and vice-verse (Table 2). These results are in conformity with earlier findings of Berhanu et al.
(2011). Days to 50% flowering showed positive and significant association with plant spread, no. of primary branches per plant and fruit diameter while its association with fruit length is significant and negative. Days to fruit maturity exhibited significant and positive association with plant height (rp, rg), plant spread (rp)
and 1000 seed weight (rg) (Table 2). These results are in
line with earlier reports of Tembhurne et al. (2008) and Sharma et al. (2010).
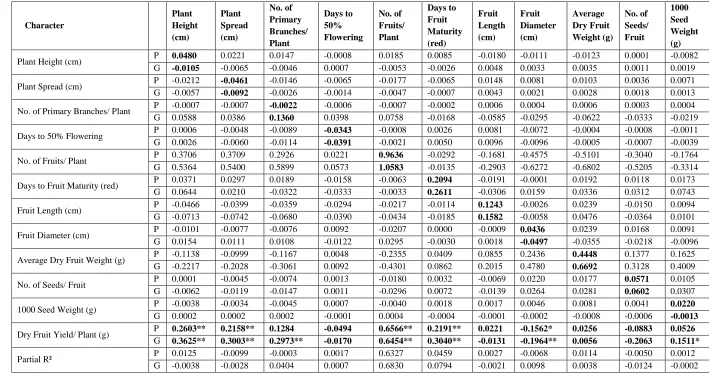
The path coefficient analysis provides an effective means of finding out direct and indirect effect of association and permits a critical examination of specific forces acting to produce given correlation and measure the relative importance of each factor. The direct and indirect effects of different characters on yield are presented in Table 3.
The path analysis studies (Table 3) revealed that plant height, fruit diameter and 1000 seed weight at phenotypic level, no. of primary branches per plant at genotypic level, number of fruits per plant, days to fruit maturity, fruit length, average dry fruit weight, number of seeds per fruit at both phenotypic and genotypic levels exhibited positive direct effect indicating that direct selection based on these traits may be helpful in evolving high yielding varieties of chilli. These results are in agreement with reports made by Kumar et al. (2012).
ISSN 0975-928X
560 flowering, days to fruit maturity, fruit length, fruit
diameter, no. of seeds per fruit and 1000 seed weight. The high direct effect of these traits and its pronounced association with yield per plant reveals its true relationship with yield and direct selection for these traits will be rewarding. The direct effect of days to fruit maturity was moderate and positive, whereas it was low and positive in case of fruit length (Table 3). These results are in conformity with earlier reports of Sharma et al. (2010), Rohini & Lakshmanan (2015) and Hasan et al. (2016).
Studies on character association indicated that plant height, plant spread, number of fruits per plantand days to fruit maturity had positive significant association with yield per plant indicating the importance of these traits in selection for yield and were identified as yield attributing characters on which selection can be relied upon for the genetic improvement of fruit yield in chilli. The path analysis revealed that the direct contribution of number of fruits per plant and average dry fruit weight was high and positive on yield per plant. Whereas, it was moderate, positive for days to fruit maturity and low, positive for fruit length indicated that direct selection based on these traits may be helpful in evolving high yielding hybrids of chilli.
Acknowledgement
I extend my deep sense of reverence and gratitude to Associate Dean, College of Horticulture, Venkataramannagudem, Dr. Y.S.R.H.U for allotting me to HRS, Lam to take up my research work. I am highly thankful to Dr. Y.S.R. Horticultural University, Venkataramannagudem for providing financial assistance in the form of stipend to complete this endeavour.
References
Berhanu, Y., Derbew, B., Wosene, G. and Fekadu, M. 2011. Genetic association among some attributes of Hot Pepper (Capsicum annuum L.) Genotypes in West Shoa, Ethiopia. Middle –East J Sci Res. 7(4): 567-573.
Dewey, D.R. and Lu, K.H. 1959. A correlation and path analysis of components of crested wheat grass seed production. Agron J. 51: 515-518.
Falconer, D.S. 1964. An introduction to quantitative genetics. Second Edition. Oliver and Boyd Ltd Edinburgh. 312-324.
Hasan, R., Akand, M., Alam, N., Bashar, A. and Huque, A. K. M. M. 2016. Analysis and Selection Indices for Yield Attributing Traits in Available Chilli (Capsicum annuum L.) Genotypes. Molecular Plant Breeding. 7 (19): 1-9.
Hasanuzzaman, M. and Golam, F. 2011. Selection of traits for yield improvement in chilli (Capsicum annuum L.). J Innov Dev Strategy.5: 78-87.
Janaki, M., Naram Naidu, L., Venkata Ramana, C. and Paratpara Rao, M. 2016. Character Association and
Path Analysis Studies of Quantitative Traits in Chilli (Capsicum annuum L.). Environment & Ecology 34 (2A): 698-702.
Jogi, M.Y., Madalageri1, M.B., Ganiger, V.M., Bhuvaneswari, G., Patil, H.B. and Kotikal. Y.K. 2013. Character association and path analysis studies in green chilli (Capsicum annuum L.). International Journal of Agricultural Sciences. 9(2): 547-550.
Krishnamurthy, S.L., Madhavi Reddy, K. and Mohan Rao, A. 2013. Genetic variation, path and correlation analysis in crosses among Indian and Taiwan parents in chilli. Vegetable Science. 40(2): 210-213.
Kumar, D., Bahadur, V., Rangare, S.B. and Singh, D. 2012. Genetic variability, heritability and correlation studies in chilli (Capsicum annuum L.). Hort Flora Res Spectrum. 1: 248-252.
Lenka, D. and Mishra, B. 1973. Path coefficient analysis of yield in rice varieties. Indian J. Agric. Sci.. 43: 376-379.
National Horticulture Board (NHB). 2014. Data Base of Horticulture crops, Gurgaon, New Delhi.
Patil, B.T., Bhalekar, M.N. and Shinde, K.G. 2012. Heterosis studies in chilli (Capsicum annuum L.) for earliness, growth and green fruit yield. Vegetable Science. 39
(1): 73-75.
Reddy, M.G., Kumar, H.D.M. and Salimath, P.M. 2008. Correlation and path coefficient analysis in chilli (Capsicum annuum, L.). Karnataka J Agr Sci. 21: 259-261.
Rohini, N. and Lakshmanan, V. 2015. Correlation and path coefficient analysis in chilli for yield and yield attributing traits. Journal of Applied and Natural Sciences. 4 (1): 25-32.
Sharma, M. and Sridevi, O. 2016. Genetic variation and character association analysis in chilli (Capsicum annuum L.). The bioscan. 11(3): 1675-1678.
Sharma, V.K., Semwal, C.S. and Uniyal, S.P. 2010. Genetic variability and character association analysis in bell pepper (Capsicum annuum L.). Journal of Horticulture and Forestry. 2(3): 058-065.
Singh, B.D. 2005. Plant Breeding - Principles and Methods. Kalyani Publishers, New Delhi, p. 87.
Tembhurne, B.V., Revanappa, R. and Kuchanur, P.H. 2008. Varietal performance, genetic variability and correlation studies in chilli (Capsicum annuum L.). Karnataka J Agr Sci. 21(4): 541-543.
Vikram, A., Warshamana, I.K. and Gupta, M. 2014. Genetic correlation and path coefficient studies on yield and biochemical traits in chilli (Capsicum annuum L). International Journal of Farm Sciences. 4(2): 70-75.
ISSN 0975-928X
561 Table 1. Salient features of parents used in Line × Tester analysis of chilli
S.No Parents Features Lines
1 LCA504 Drought resistant, highly pungent
2 LCA615 High yielding line with parrot green fruits
3 LCA446 Bold pod, high colour and oleoresin
4 LCA466 Bold and long pod, high colour and oleoresin
5 LCA442 Bold and long pod, high colour and mild pungent
6 LCA654 Medium bold, shiny fruit surface, light green in colour
7 LCA607 Light green pod, profuse branching
8 LCA655 Dual purpose variety, bold light green pod
9 LCA355 High colour with wrinkled surface
Testers
1 G4 Dark green (olive green) fruits, virus resistant
2 LCA678 More primary branches, semi erect plant habit
3 LCA453 Bold pod, erect growth habit
4 LCA7032 Virus resistant, dark green fruits
5 LCA7052 More no. of fruits, shiny dry pod
6 LCA315 Virus resistant, fruits are long and dark green
Checks
1 Indam5 IndoAmerican Hybrid Seeds (India) Pvt.Ltd. (IAHS)
ISSN 0975-928X
562 Table 2. Phenotypic (P) and Genotypic (G) correlation coefficients among twelve quantitative characters in chilli (Capsicum annuum L.)
Character
Plant Height (cm)
Plant Spread (cm)
No. of Primary Branches/ Plant
Days to 50% Flowering
No. of Fruits/ Plant
Days to Fruit Maturity (red)
Fruit Length (cm)
Fruit Diameter (cm)
Average Dry Fruit Weight (g)
No. of Seeds/ Fruit
1000 Seed Weight (g)
Dry Fruit Yield/ Plant (g)
Plant Height (cm) P 1.0000 0.4598** 0.3053** -0.0175 0.3846** 0.1771** -0.3748** -0.2307** -0.2559** 0.0022 -0.1714* 0.2604** G 1.0000 0.6171** 0.4323** -0.0672 0.5069** 0.2466** -0.4506** -0.3104** -0.3313** -0.1034 -0.1813** 0.3625**
Plant Spread (cm) P 1.0000 0.3161** 0.1403* 0.3850** 0.1420* -0.3207** -0.1759* -0.2248** -0.0783 -0.1539* 0.2159** G 1.0000 0.2838** 0.1528* 0.5103** 0.0803 -0.4693** -0.2239** -0.3031** -0.1983** -0.1367* 0.3003**
No. of Primary Branches/ Plant P 1.0000 0.2587** 0.3037** 0.0903 -0.2887** -0.1753* -0.2624** -0.1294 -0.2038** 0.1285 G 1.0000 0.2925** 0.5575** -0.1233 -0.4301** -0.2174** -0.4574** -0.2448** -0.1614* 0.2973**
Days to 50% Flowering P 1.0000 0.0229 -0.0755 -0.2365** 0.2104** 0.0109 0.0223 0.0333 -0.0494
G 1.0000 0.0542 -0.1276 -0.2468** 0.2454** 0.0138 0.0191 0.0990 -0.0170
No. of Fruits/ Plant P 1.0000 -0.0303 -0.1745* -0.4749** -0.5295** -0.3156** -0.1832** 0.6566**
G 1.0000 -0.0128 -0.2743** -0.5927** -0.6428** -0.4919** -0.3132** 0.6454**
Days to Fruit Maturity (red) P 1.0000 -0.0914 -0.0005 0.0919 0.0565 0.0825 0.2192**
G 1.0000 -0.1172 0.0610 0.1289 0.1196 0.2846** 0.3040**
Fruit Length (cm) P 1.0000 -0.0209 0.1923** -0.1204 0.0756 0.0221
G 1.0000 -0.0365 0.3012** -0.2305** 0.0636 -0.0131
Fruit Diameter (cm) P 1.0000 0.5479** 0.3851** 0.2088** -0.1563*
G 1.0000 0.7143** 0.4387** 0.1935** -0.1965**
Average Dry Fruit Weight (g) P 1.0000 0.3097** 0.3654** 0.0257
G 1.0000 0.4675** 0.5992** 0.0057
No. of Seeds/ Fruit P 1.0000 0.1846** -0.0883
G 1.0000 0.5106** -0.2064**
1000 Seed Weight (g) P 1.0000 0.0526
G 1.0000 0.1511*
Dry Fruit Yield/ Plant (g) P 1.0000
G 1.0000
ISSN 0975-928X
563 Table 3. Phenotypic (P) and Genotypic (G) path analysis showing direct (diagonal) and indirect effects of yield attributing characters on yield per plant in chilli
(Capsicum annuum L.)
Character
Plant Height (cm)
Plant Spread (cm)
No. of Primary Branches/ Plant
Days to 50% Flowering
No. of Fruits/ Plant
Days to Fruit Maturity (red)
Fruit Length (cm)
Fruit Diameter (cm)
Average Dry Fruit Weight (g)
No. of Seeds/ Fruit
1000 Seed Weight (g)
Plant Height (cm) P 0.0480 0.0221 0.0147 -0.0008 0.0185 0.0085 -0.0180 -0.0111 -0.0123 0.0001 -0.0082
G -0.0105 -0.0065 -0.0046 0.0007 -0.0053 -0.0026 0.0048 0.0033 0.0035 0.0011 0.0019
Plant Spread (cm) P -0.0212 -0.0461 -0.0146 -0.0065 -0.0177 -0.0065 0.0148 0.0081 0.0103 0.0036 0.0071 G -0.0057 -0.0092 -0.0026 -0.0014 -0.0047 -0.0007 0.0043 0.0021 0.0028 0.0018 0.0013
No. of Primary Branches/ Plant P -0.0007 -0.0007 -0.0022 -0.0006 -0.0007 -0.0002 0.0006 0.0004 0.0006 0.0003 0.0004 G 0.0588 0.0386 0.1360 0.0398 0.0758 -0.0168 -0.0585 -0.0295 -0.0622 -0.0333 -0.0219
Days to 50% Flowering P 0.0006 -0.0048 -0.0089 -0.0343 -0.0008 0.0026 0.0081 -0.0072 -0.0004 -0.0008 -0.0011 G 0.0026 -0.0060 -0.0114 -0.0391 -0.0021 0.0050 0.0096 -0.0096 -0.0005 -0.0007 -0.0039
No. of Fruits/ Plant P 0.3706 0.3709 0.2926 0.0221 0.9636 -0.0292 -0.1681 -0.4575 -0.5101 -0.3040 -0.1764 G 0.5364 0.5400 0.5899 0.0573 1.0583 -0.0135 -0.2903 -0.6272 -0.6802 -0.5205 -0.3314
Days to Fruit Maturity (red) P 0.0371 0.0297 0.0189 -0.0158 -0.0063 0.2094 -0.0191 -0.0001 0.0192 0.0118 0.0173 G 0.0644 0.0210 -0.0322 -0.0333 -0.0033 0.2611 -0.0306 0.0159 0.0336 0.0312 0.0743
Fruit Length (cm) P -0.0466 -0.0399 -0.0359 -0.0294 -0.0217 -0.0114 0.1243 -0.0026 0.0239 -0.0150 0.0094 G -0.0713 -0.0742 -0.0680 -0.0390 -0.0434 -0.0185 0.1582 -0.0058 0.0476 -0.0364 0.0101
Fruit Diameter (cm) P -0.0101 -0.0077 -0.0076 0.0092 -0.0207 0.0000 -0.0009 0.0436 0.0239 0.0168 0.0091 G 0.0154 0.0111 0.0108 -0.0122 0.0295 -0.0030 0.0018 -0.0497 -0.0355 -0.0218 -0.0096
Average Dry Fruit Weight (g) P -0.1138 -0.0999 -0.1167 0.0048 -0.2355 0.0409 0.0855 0.2436 0.4448 0.1377 0.1625 G -0.2217 -0.2028 -0.3061 0.0092 -0.4301 0.0862 0.2015 0.4780 0.6692 0.3128 0.4009
No. of Seeds/ Fruit P 0.0001 -0.0045 -0.0074 0.0013 -0.0180 0.0032 -0.0069 0.0220 0.0177 0.0571 0.0105 G -0.0062 -0.0119 -0.0147 0.0011 -0.0296 0.0072 -0.0139 0.0264 0.0281 0.0602 0.0307
1000 Seed Weight (g) P -0.0038 -0.0034 -0.0045 0.0007 -0.0040 0.0018 0.0017 0.0046 0.0081 0.0041 0.0220 G 0.0002 0.0002 0.0002 -0.0001 0.0004 -0.0004 -0.0001 -0.0002 -0.0008 -0.0006 -0.0013
Dry Fruit Yield/ Plant (g) P 0.2603** 0.2158** 0.1284 -0.0494 0.6566** 0.2191** 0.0221 -0.1562* 0.0256 -0.0883 0.0526 G 0.3625** 0.3003** 0.2973** -0.0170 0.6454** 0.3040** -0.0131 -0.1964** 0.0056 -0.2063 0.1511*
Partial R² P 0.0125 -0.0099 -0.0003 0.0017 0.6327 0.0459 0.0027 -0.0068 0.0114 -0.0050 0.0012
G -0.0038 -0.0028 0.0404 0.0007 0.6830 0.0794 -0.0021 0.0098 0.0038 -0.0124 -0.0002