Analysis of Change Effect in the Market Interest Rate on Net Interest Income of
Commercial Banks
Angele Lileikiene
1, Aurimas Likus
21,2 Siauliai University
Architektu st.1, LT-78366, Siauliai, Lithuania
e-mail: angele.lileikiene@vlvk.lt, aurimaslikus@gmail.com
The article presents an analysis and description of the methods of an income gap analysis and a duration gap analysis that enable assessing an interest rate risk of commercial banks also their policy of assets and liabilities management in the view of concordance of terms. On the basis of gap analysis methods applied to make an assessment of an interest rate risk and annual financial statements of the banks “Šiauliai bankas” and “Medicinos bankas” for the period of 2006 – 2009, a theoretical simulation model of sensitivity of the net interest income to the changes in the market interest rate was developed and implemented in practice; the aim of the model – with the aid of gap methods and a sensitivity analysis to make quantitative assessment of the effect of the change in the interest rate on a net interest income, as hypothetically, there is a functional dependency between changes in the market interest rate and net interest income of commercial banks. Management of an interest rate risk in commercial banks is one of the “foundation stones” in management of banks assets and liabilities as it determines profitability of a bank. M. Jasiene (1998) describes in detail the interest rate risk and its potential effect on the structure of assets and liabilities. A. Lileikiene and J. Martinkiene (2004) in their research articles emphasise the importance of a choice of the strategy of assets and liabilities formation in commercial banks and tools for the management of an interest rate risk. Interest rate risk and its management tools are also described in N. Zaltauskiene’s (2005), A. Lakstutiene’s, A. Breiteryte’s, D. Rumsaite’s (2009) research works. There is a considerable body of research and studies on this topic by foreign authors. E. N. Murthy (2008), S. Priyank (2007) describe in detail methods of interest rate risk assessment, analysing values of assets and liabilities balance-sheet items of commercial banks. F. S. Mishkin (2007) provides mathematical methods for the assessment of the structure of assets and liabilities in commercial banks. Interest rate risk assessment methods and results of research are also described in specialised periodical publications that are publicly distributed, e.g. “GAP Analysis” bulletin published by the initiative of the US Central Bank.
Keywords: interest rate risk, net interest income, gap, sensitivity analysis.
Introduction
The analysis of the sources of economic research literature shows that the major part of research on the topic of interest rate risk management deals with the analysis of the measures for risk mitigation or neutralization – interest swap and future interest transaction, also interest options. By the authors’ opinion, beside the interest rate risk management, a separate area of research should be discerned – assessment of interest rate risk. Although the methods of interest rate risk assessment known in the research literature enable an accurate and comprehensive assessment of interest rate risk, but it is difficult to find quantitative and qualitative models for an interest rate risk assessment that would relate changes in the market interest rate to financial performance indicators of banks. Interest income is the main source of income of commercial banks. Having other factors constant, the changes in the market interest rate can make a significant effect on the interest income of commercial banks. M. Jasiene (1998) emphasises that the level of the market interest rate and economic activity cycle are changing simultaneously. While Lithuanian economy is entering into the decline and recession stages of the economic cycle, the market interest rate level is likely to change. The dynamic analysis of an interbank interest rate shows significant changes in the interest rate level. It increases the interest rate risk and strengthens the effect of changes of the market interest rate on net interest income of commercial banks.
Object of research of the article is to develop the methods of the assessment of interest rate risk due to the changes in the market interest rate for commercial banks and to apply it in practice for the assessment and management of interest rate risk in the banks “Šiauliai bankas” and “Medicinos bankas”, thus increasing competitiveness of retail banks in the financial market.
The following tasks were set to achieve the objective of research:
1. to analyse and describe the analysis methods enabling the assessment of the interest rate risk of commercial banks and their policy of assets and liabilities management in a view of concordance of terms;
2. to define the effect of the market interest rate fluctuations on net interest income of commercial banks;
Research methods: the analysis of economic research and academic literature, comparison, generalisation, statistical and econometric methods, synthesis and extrapolation, graphical representation, the analysis of static and dynamic data, forecasting and simulation modelling.
Theoretical importance of the results is based on the systemic approach to the interest rate risk and assets and liabilities management, which is implemented in a theoretical model of sensitivity of net interest income to the market interest rate. This model is developed taking into account the possibilities for its wide application in practice, which virtually depend on the initial rationales of researchers and provide for possibilities to increase the competitiveness of regional commercial banks.
Aspects of interest rate risk assessment
Performing every commercial bank’ lending and borrowing operations faces the interest rate risk problem. This risk results from different revaluation terms of assets and liabilities balance sheet items. Upon the changes in the market interest rate, costs related to debt management incurred by a bank can increase more than income generated from assets used by a commercial bank. That‘s why, as precise as possible methods for assessment and management of interest rate risk should be used; also advanced tools for forecasting of the market interest rate should be available. As Crouhy, M., Galai, D., Mark R., (2000) maintain, the interest rate risk level depends on the type of composition and structure of assets and liabilities of commercial bank and the type of pursued strategy for management of assets and liabilities. It means that the process of interest rate risk recognition in commercial banks is expressed through the pursued policy for management of assets and liabilities. According to N. Zaltauskiene (2005), an interest rate risk makes impact on the economic value of various bank assets, liabilities or out-balance-sheet items, that are derived by discounting all future cash flows. It can be concluded that a net current value of commercial banks is constantly changing upon the changes in the level of the market interest rate. As many national and foreign authors state, the interest rate risk is assessed by a gap method. Several methods of gap analysis are provided in research literature. However various methods of the analysis give different results that often are measured in different measurement units. In order to make a comprehensive evaluation of the results generated by the interest rate risk assessment methods and to relate them with the financial performance indicators of commercial banks, the authors combine several methods of interest rate risk assessment and financial analysis that make the theoretical model of sensitivity of net interest income to the market interest rate. Thus, a systematic approach to the market interest rate risk and management of assets and liabilities in commercial banks is provided. The authors maintain that the existence of the market interest rate risk is not a negative factor itself, as favourable policy of management of assets and liabilities in a bank and changes in the market interest rate can generate an additional value of assets for banks.
One of the key crediting principles in commercial banks is the concordance of terms. It means that a bank must
observe the “golden rule of banking” stipulating that the time-term of the loans a bank grants cannot be longer than the term when a bank has funds of its customers in its disposal. This coordination of terms is referred to in research literature as concordance. Theoretically, concordance is achieved when terms to the maturity of money received from debtors concur with the terms to maturity of money that a bank is bound to pay to creditors (Macerinskiene, 2000). But absolute concordance of time-terms is not beneficial in the view of profitability. The goal of a bank is to strive for maximum profit ensuring sufficient indicators of liquidity and security. D. S. Kidwell, R. L. Peterson & D. W. Blackwell (2000) provide liquidity, profitability and security as three fundamental principles of a commercial bank and represent them in a form of a triangle. Depending on the principle that a bank is more focused on, a credit policy is classified into aggressive, conservative and liberal. Kidwell, Peterson, Blackwell (2000), also Macerinskiene, Ivaskeviciute (2000) state that striving for the three fundamental principles, a commercial bank has to take contradicting decisions:
o to achieve high profitability, a bank must maximise the number of long-term loans (due to higher interest);
o to maintain required liquidity, a bank must optimise the number of short-term loans;
o to ensure security, a bank must make a detailed assessment of every bank customer.
If a commercial bank chooses an aggressive credit policy, a bank maximises profit at a liquidity account. In this case fixed-time short-term deposits and balances of current accounts are used for the financing of medium-term loans; and medium-medium-term and long-medium-term fixed-medium-term deposits for long-term loans. Pursuing such a credit policy a bank not only increases liquidity (solvency) risk, but also an interest rate risk occurs due to non-concordance of terms.
A commercial bank seeking to maintain required liquidity optimises the number of short-term loans, but high liquidity ratios do not reduce the level of bank interest rate risk. In this case it should be emphasised that the interest rate risk is a specific type of financial performance risk for a commercial bank, which virtually is not directly dependent on credit policy pursued by a commercial bank. Interest rate risk can be an important factor pursuing both aggressive and conservative credit policy. Interest rate risk is minimised only in the case of total concordance of terms. However in practice a total concordance of time-terms in commercial banks does not exist. It means that the interest rate risk more or less in every commercial bank is a significant factor determining profitability.
in regard of concordance of time-terms determines what level of interest rate risk a bank accepts.
Policy and its importance for the management
of assets and liabilities in banks
According to M. Jasiene (1998), the aim of assets and liabilities management is to coordinate regulation of assets and liabilities of a bank in order to increase the market value of share capital of a bank. Management of interest rate risk is one of the most important obligations of the Committee of assets and liabilities management .
In research literature (Murthy, 2008), it is emphasised that assets and liabilities management in operations of commercial banks is required in the following stages of planning (20):
o making plans for Day-to-Day Decisions. In this case assets and liabilities management is performed analysing short-term reports and setting short-term goals of a bank;
o annual budget planning and control plan forming; o strategic planning that includes setting of long-term goals of a bank performance.
Referring to the above, it can be stated that the management of assets and liabilities in operations of commercial banks includes making both running and strategic plans. This fact emphasises the importance of the management of assets and liabilities. One of the key task in the management of assets and liabilities is an interest income analysis and management. Net interest income is the difference between interest income earned by a bank
granting credits and providing investing services, and interest expenditures that a bank incurs paying interest on deposits and other liabilities. Depending on various circumstances and economic factors, net interest income in every bank can change both in positive and negative direction, i.e. it can both increase and decrease. It depends on the change in the market interest rate and on bank‘s approach to assets and liabilities. If a bank has a larger share of assets depending on interest rate than a share of liabilities depending on an interest rate, then this relative ratio of assets and liabilities will be higher than one. And vice versa, if a bank has a larger share of liabilities depending on an interest rate than a share of assets, then a relative ratio will be lower than one. Relative ratio of interest rate sensitive assets and liabilities is calculated under the following formula (Beck, 2000):
Relative ratio of interest rate sensitive assets and liabilities = RSA / RSL (1);
where:
RSA
– Interest Rate Sensitive Assets;RSL
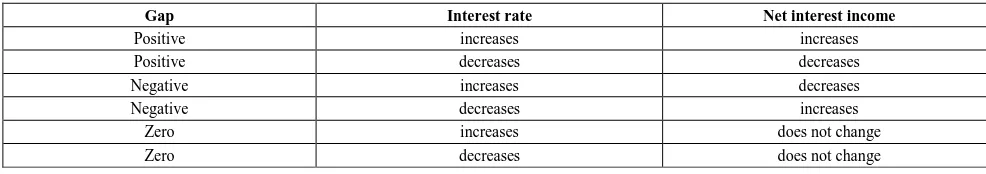
– Interest Rate Sensitive Liabilities.Changes in the market interest rate have direct impact on net interest income (Table 1). In the market, interest rate can increase, decrease or remain constant. Data provided in the table shows the directions of change in net interest income upon changes in the market interest rate. Gap (in other words - difference) is a value of difference between interest rate sensitive assets and interest rate sensitive liabilities.
Table 1 Effect of the change in interest rate on net interest income
Gap Interest rate Net interest income
Positive increases increases
Positive decreases decreases
Negative increases decreases
Negative decreases increases
Zero increases does not change
Zero decreases does not change
In order to perform a gap analysis, the balance-sheet items of a commercial bank are classified into sensitive to the market interest rate and insensitive to the interest rate. In other words, it can be said that to perform an analysis it is necessary to know the net present value of which assets and liabilities balance-sheet items depend on interest rate level and changes (sensitive to the changes in the market interest rates), and
which assets and liabilities balance-sheet items do not depend on the market interest rate. The analysis of the values of these variables constitutes the essence of a gap analysis.
Classification of sensitivity of assets and liabilities to interest rate is provided in Table 2 where assets and liabilities balance-sheet items are classified into sensitive and insensitive to the changes in the market interest rate.
Table 2 Classification of sensitivity of assets and liabilities balance-sheet items of a bank to interest rate
Assets Classification Liabilities Classification
Cash Insensitive on call deposits Insensitive
Short-term securities Sensitive Current accounts Insensitive
Long-term securities Insensitive Money market deposits Sensitive
Fluctuating interest rate credits Sensitive Short-term deposits Sensitive
Short-term loans Sensitive Long-term liabilities Insensitive
Long-term loans Insensitive Repo operations Sensitive
Those assets and liabilities balance-sheet items, which interest income or costs are changing upon changes of the market interest rate during certain time period, are considered sensitive to the changes in interest rate. Those assets and liabilities balance-sheet items, which interest income or expenditure does not change, upon changes of the market interest rate during the same reporting period, are considered insensitive to changes in interest rate (Zeitlin, 2009). It is extremely important to emphasise that the period from which sensitive and insensitive to the changes in interest rate balance-sheet items differ, is one year. By Santomero (2009), extension or reduction of the reporting period may result in the situation when assets and liabilities balance-sheet items that had earlier been sensitive (insensitive) to changes in the market interest rate may become insensitive (sensitive).
A. Lileikiene (2008) emphasises that each balance-sheet item of assets or liabilities that matures within a selected time interval, can be re-valued, because a bank can re-invest with other interest rate or to set other interest rate for deposits . By M. Jasiene (1998), every credit or fixed-term deposit that matures within this time period, will be interest rate sensitive assets or liabilities. Even each payment of credit instalment is sensitive, if it is expected to be received within a certain time interval. This includes both final and intermediate payments of the principal amount.
Asset and liability is interest rate sensitive within a certain time interval, if (7):
o its term matures;
o it is intermediate or final payment of the principal amount;
o pursuant to agreement, interest rate on loan or deposit is changed within this interval;
o pursuant to agreement, the principal amount of loan or deposit may be re-valued, upon changes in certain basis rate, or index, and it is expected that basis rate (index) would change within that time period.
In a classic case, sensitive assets and liabilities balance-sheet items are considered sensitive to the changes in interest rate for the period of up to one year. However, the analysis of research literature shows that this reference time is not an approved theoretical standard, but rather more depending on economic rationales of a researcher and objectives of research. Having the aim to analyse the effect of interest rate risk on financial performance indicators of a bank within the period of several years, it is expedient to extend this term or to classify all the assets and liabilities balance-sheet structure into balance-sheet items that are in general sensitive or insensitive to changes in interest rate. In the simulation model of sensitivity of net interest income of a commercial bank, the assets and liabilities that are re-valued later than after one year period are considered sensitive to the changes in the market interest rate. Only assets and liabilities balance-sheet items that are absolutely independent from the market interest rate are discerned.
Assessment of interest rate risk by the gap
method
GAP Analysis is applied to make an assessment of interest rate risk in commercial banks. Gap analysis includes the analysis of individual balance-sheet items of a commercial bank by potential re-valuation periods. It shows the amount of interest rate risk. Re-valuation period is a particular date, when the interest of certain financial instrument may be changed, thus making impact on bank‘s profit (loss) generated from the interest (Lileikiene, 2008).
Having analysed the sources of foreign literature (Federal Reserve Bank bulletin “GAP Analysis”, 2004; F. S. Mishkin The Economics of Money, Banking, and Financial Markets, 8th edition), it can be maintained that the gap analysis of balance-sheet items of commercial banks can be performed in two methods: calculating the value of a gap in monetary terms by a particular re-valuation date or assessing average duration of the gap (e.g. in years) in average required to re-value assets and liabilities.
Due to this different initial reference position of the analysis, there are two different methods of gap analysis calculation (19):
1) Income Gap Analysis; 2) Duration Gap Analysis.
Making the assessment of the effect of both income gap and duration gap on the value of assets and liabilities of commercial banks, only interest rate sensitive balance-sheet items are analysed. It means, that performing a gap analysis, it has to be decided, which assets and liabilities balance-sheet items are sensitive to changes in the interest rate. In other words, it is important to discern such elements of assets and liabilities balance-sheet items that are likely to be revaluated upon changes in the market conditions (Makstutiene, 2009, Lukosevicius, 2003).
In the case of Income Gap Analysis, an absolute gap value is calculated as a difference between values of interest rate sensitive assets and interest rate sensitive liabilities by a particular selected re-valuation date. This difference in financial statements of Lithuanian commercial banks is referred to as a net position of balance-sheet items or just a gap. The following formula is used to calculate net position of balance-sheet items (to find a gap value) (7):
RSL RSA
GAP = − (1);
where:
GAP – net position of balance-sheet items or a gap; Large difference (both in positive, and negative direction) means that changes in interest rate have a very big effect on interest income (Murthy, 2008). By M. Jasiene (1998), information on the value of a net position of balance-sheet items (gap) can be used to protect net interest income from changes in interest rate or for speculative purposes to change the value of difference trying to increase net interest income .
increasing, the interest income is also growing, if interest rate is decreasing, then interest income is also decreasing.
If a difference between values of interest rate sensitive assets and interest rate sensitive liabilities is negative, then interest rate will be changing in opposite direction than interest income, i.e. if interest rate is increasing, the interest income is decreasing; if interest rate is decreasing, interest income is increasing.
Analysing in more detail the benefit provided by difference of the values of interest rate sensitive assets and interest rate sensitive liabilities, strategies for assets and liabilities management are discerned. Banks choosing a strategy for the management of assets and liabilities in such a way expect to earn additional income or to reduce potential loss.
Duration gap analysis is performed in order to evaluate what effect on the net position of balance-sheet items or gap can be made by a change in interest rate at certain value ( Beck, 2000). The essential difference from the income gap analysis method is that in this case gap duration of an average revaluation time of both assets and liabilities is calculated, i.e. during calculations, every value of assets balance-sheet item is divided by total value of interest rate sensitive assets and a ratio is obtained, which shows what is a relative weight of a particular balance-sheet element in the total context of interest rate sensitive assets. An analogical operation is performed with liabilities: a ratio between the value of the element of a liabilities balance-sheet item and the total interest rate sensitive liabilities of a bank is calculated. Afterwards, this ratio is multiplied by a ratio of average duration gap of revaluation time of a particular balance-sheet item.
Having performed calculations, an assessment can be made of the structure of balance-sheet items of both assets and liabilities which shows at what average time-intervals are the elements of assets and liabilities balance-sheet items re-valued. Advantage of this method is an ability to make a single-method assessment of the total value of assets (liabilities) elements in regard of revaluation terms, taking into account relative values of balance-sheet items in the context of assets (liabilities). Having summed-up leveraged durations of revaluation time of individual assets and liabilities balance-sheet items, the following ratios are obtained: average leveraged duration of assets revaluation duration time and average leveraged duration of liabilities revaluation duration time.
In terms of assets, this ratio is calculated as following (Mishkin, 2007):
i i
i D W
RSA A
=
× , where i = (1,n),i∈ Z (2);
a n i i DUR W =
∑
=1, where
i
=
(
1
,
n
),
i
∈
Z
(3);where:
i
A – value of i-th assets balance-sheet item;
i
D – duration of revaluation time of i-th assets balance-sheet item;
i
W – leveraged duration of revaluation time of i-th assets balance-sheet item;
a
DUR – average leveraged duration of assets revaluation time;
n – number of interest rate sensitive assets balance-sheet items;
In terms of liabilities, this ratio is calculated as following (Mishkin, 2007):
z z
z D W
RSL L
=
× , where z = (1,m),z∈ Z (4);
l m z z DUR W =
∑
=1, where z = (1,m),z ∈ Z (5);
where:
z
L – value of z-th liabilities balance-sheet item;
z
D – duration of revaluation time of z-th liabilities balance-sheet item;
z
W – leveraged duration of revaluation time of z-th
liabilities balance-sheet item; l
DUR – average leveraged duration of liabilities
revaluation time;
m – number of interest rate sensitive liabilities balance-sheet items;
The obtained results of average leveraged duration of assets revaluation time
a
DUR and average leveraged duration of liabilities revaluation time
l
DUR are used in
further analysis for the following aims:
1) to define whether the structure of assets and liabilities of a commercial bank is balanced in regard of revaluation terms (results are compared with planned indicators of a bank);
2) to develop a model of sensitivity of net interest income of a bank to the market interest rate.
Changing the interest rate by a certain percentage, it is possible to make a model of changes in the bank‘s assets and liabilities and to observe the effect of these changes on the gap value. The analysis of sensitivity of net interest income to the market income rate is performed calculating an average leveraged gap duration of revaluation time under the following formula (18):
) ( l a gap DUR RSA RSL DUR
DUR = − × (6);
where:
gap
DUR – average leveraged gap duration of revaluation time;
Sensitivity ratio is calculated under the following equation (19): i i DUR A nw gap + ∆ × − = ∆ 1 (7); where: nw
∆ – sensitivity ratio;
i
∆ – change in market interest rate;
i – market interest rate before a change.
Sensitivity ratio
∆
nw
, expressed as a percentage, shows gap change as a percentage of the amount of interest rate sensitive assets. Performing a sensitivity analysis to develop a model that would show absolute value of a gap at certain market interest rates.i i DUR
Pa a
+ ∆ × −
= ∆
1
% (8);
i i DUR
Pl l
+ ∆ × −
= ∆
1
% (9);
where: a
P
∆
% - a percentage change in interest rate sensitive
assets; l
P
∆
% - a percentage change in interest rate sensitive
liabilities.
Certain shortcomings of the model are approached when performing a gap analysis. Rational of the gap analysis is that the changes in the market interest rate equally change the values of assets and liabilities balance-sheet items. It is not always correct. Changes in interest rate can be different in regard of assets and liabilities. According to A. Lileikiene (2008), if the trend for drop (rise) of interest on issued credits and decrease (increase) of interest on deposits is constant, then such changes do not infringe an interest rate equilibrium in the financial market. Obviously, if such condition is violated, then the results of the gap analysis can not reflect the real situation in the market.
The gap analysis is one of the methods to manage market interest rate risk. It is also a tool to create models for alternative operations, changing the market interest rate. Income gap analysis allows for the evaluation, whether assets and liabilities balance-sheet items are in
concordance with each other in a view of revaluation terms. A duration gap analysis enables the comparison of an average leveraged duration of assets and liabilities revaluation time. With the aid of these ratios, having calculated an average leveraged gap duration of revaluation time, it is possible to make further calculations of the ratio of sensitivity of net interest income to the changes in the market interest rate. This ratio shows changes in the gap (difference), when the market interest rate is changing by certain percentage value.
Simulation model of sensitivity of net interest
income to the changes in the market interest
rate in the banks “Šiauliai bankas” and
“Medicinos bankas”
To make calculations of net interest income it is necessary to know the estimates of the total interest income and income cost. They can be calculated knowing values of all interest generating assets and interest cost incurring liabilities. In addition to this, the total interest income and total interest costs can be calculated having the values of interest rate sensitive assets and interest rate sensitive liabilities, and also all potential estimates of basis interest rate.
The estimates of the bank “Šiauliai bankas” basis interest rate are provided in Table 3.
Table 3 Potential estimates of “Šiauliai bankas” basis interest rate upon the changes in the market interest rate (%)
Ratio i( a)(2006) i( l)(2006) i( a)(2007) i( l)(2007) i( a)(2008) i( l)(2008) i( a) (2009) i( l)(2009)
i
∆
= -7 - - - 0.78% 0.37%i
∆
= -6 - - - - 1.22% 0.12% 1.78% 1.37%i
∆
= -5 - - - - 2.22% 1.12% 2.78% 2.37%i
∆
= -4 - - - - 3.22% 2.12% 3.78% 3.37%i
∆
= -3 2.15% 0.45% 2.47% 0.94% 4.22% 3.12% 4.78% 4.37%i
∆
= -2 3.15% 1.45% 3.47% 1.94% 5.22% 4.12% 5.78% 5.37%i
∆
= -1 4.15% 2.45% 4.47% 2.94% 6.22% 5.12% 6.78% 6.37%i
∆
= 0 5.15 % 3.45 % 5.47 % 3.94 % 7.22 % 6.12 % 7.78 % 7.37 %i
∆
= 1 6.15% 4.45% 6.47% 4.94% 8.22% 7.12% 8.78% 8.37%i
∆
= 2 7.15% 5.45% 7.47% 5.94% 9.22% 8.12% 9.78% 9.37%i
∆
= 3 8.15% 6.45% 8.47% 6.94% 10.22% 9.12% 10.78% 10.37%i
∆
= 4 9.15% 7.45% 9.47% 7.94% 11.22% 10.12% 11.78% 11.37%i
∆
= 5 10.15% 8.45% 10.47% 8.94% 12.22% 11.12% 12.78% 12.37%i
∆
= 6 11.15% 9. 5% 11.47% 9.94% 13.22% 12.12% 13.78% 13.37%i
∆
= 7 12.15% 10.45% 12.47% 10.94% 14.22% 13.12% 14.78% 14.37%Interest rate estimates provided in Table 3 represent basis interest rate after
∆
i
change. On the basis of this interest, the total interest income (taking into account i( a) interest rate) and total interest costs (taking into account) (l
i interest rate) are calculated in the simulation model.
Interest rate estimates, when ∆i= 0, represents the real basis reference interest rate, calculated on the basis of financial statements of commercial banks.
and liabilities. This provides a possibility for the fluctuation of an interest margin of a bank. In order to find and forecast how interest margin
of a bank will be changing, it is necessary to evaluate how the value of assets and liabilities will be changed also subjected to other factors than the change in interest rate. Let’s say, the value of assets of commercial bank can change as the result of increase in the number of insolvent customers, or upon the decrease of the market interest rate, the value of liabilities is decreasing, if customers decide not to keep deposits in the bank but invest into real estate instead, etc.
The estimates of the bank “Medicinos bankas” basis interest rate are provided in Table 4.
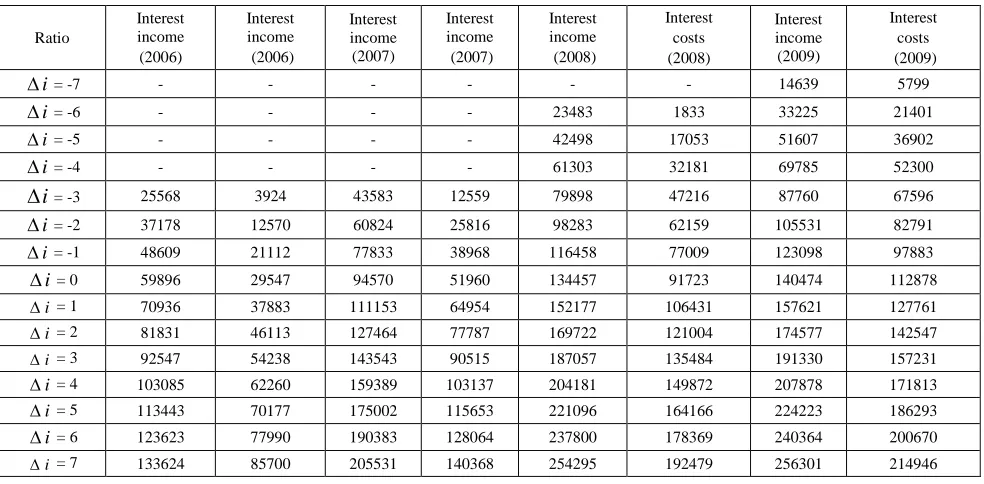
The estimates of the basis interest rate calculated in Tables 3-4 are used to make calculations of the total interest income and total interest costs, the results whereof in terms of Litas are provided in Tables 5-6.
Interest income and interest costs are calculated taking into account the changes in the market interest rate, also the effect of such changes on interest rate sensitive assets and liabilities (Table 5).
Table 4
Potential estimates of “Medicinos bankas” basis interest rate upon the changes in the market interest rate (%)
Ratio i( a)(2006) i( l)(2006
) i( a)
(2007) i( l)(2007) i( a)(2008) i( l)(2008) i( a)(2009) i( l)(2009)
i
∆ = -7 - - - -
i
∆ = -6 - - - 3.04 % 0.73 %
i
∆ = -5 - - - - 4.23 % 0.69 % 4.04 % 1.73 %
i
∆ = -4 - - - - 5.23 % 1.69 % 5.04 % 2.73 %
i
∆ = -3 - - 3.16 % 0.79 % 6.23 % 2.69 % 6.04 % 3.73 %
i
∆ = -2 2.71 % 0.91 % 4.16 % 1.79 % 7.23 % 3.69 % 7.04 % 4.73 %
i
∆ = -1 3.71 % 1.91 % 5.16 % 2.79 % 8.23 % 4.69 % 8.04 % 5.73 %
i
∆ = 0 4.71 % 2.91 % 6.16 % 3.79 % 9.23 % 5.69 % 9.04 % 6.73 %
i
∆ = 1 5.71 % 3.91 % 7.16 % 4.79 % 10.23 % 6.69 % 10.04 % 7.73 %
i
∆ = 2 6.71 % 4.91 % 8.16 % 5.79 % 11.23 % 7.69 % 11.04 % 8.73 %
i
∆ = 3 7.71 % 5.91 % 9.16 % 6.79 % 12.23 % 8.69 % 12.04 % 9.73 %
i
∆ = 4 8.71 % 6.91 % 10.16 % 7.79 % 13.23 % 9.69 % 13.04 % 10.73 %
i
∆ = 5 9.71 % 7.91 % 11.16 % 8.79 % 14.23 % 10.69 % 14.04 % 11.73 %
i
∆ = 6 10.71 % 8.91 % 12.16 % 9.79 % 15.23 % 11.69 % 15.04 % 12.73 %
i
∆ = 7 11.71 % 9.91 % 13.16 % 10.79 % 16.23 % 12.69 % 16.04 % 13.73 %
Table 5
The total “Šiauliai bankas” interest income and costs upon changes in the market interest rate (in thousand LTL)
Ratio
Interest income (2006)
Interest income (2006)
Interest income (2007)
Interest income (2007)
Interest income (2008)
Interest costs (2008)
Interest income (2009)
Interest costs (2009)
i
∆ = -7 - - - 14639 5799
i
∆ = -6 - - - - 23483 1833 33225 21401
i
∆ = -5 - - - - 42498 17053 51607 36902
i
∆ = -4 - - - - 61303 32181 69785 52300
i
∆
= -3 25568 3924 43583 12559 79898 47216 87760 67596i
∆ = -2 37178 12570 60824 25816 98283 62159 105531 82791
i
∆ = -1 48609 21112 77833 38968 116458 77009 123098 97883
i
∆ = 0 59896 29547 94570 51960 134457 91723 140474 112878
i
∆ = 1 70936 37883 111153 64954 152177 106431 157621 127761
i
∆ = 2 81831 46113 127464 77787 169722 121004 174577 142547
i
∆ = 3 92547 54238 143543 90515 187057 135484 191330 157231
i
∆ = 4 103085 62260 159389 103137 204181 149872 207878 171813
i
∆ = 5 113443 70177 175002 115653 221096 164166 224223 186293
i
∆ = 6 123623 77990 190383 128064 237800 178369 240364 200670
i
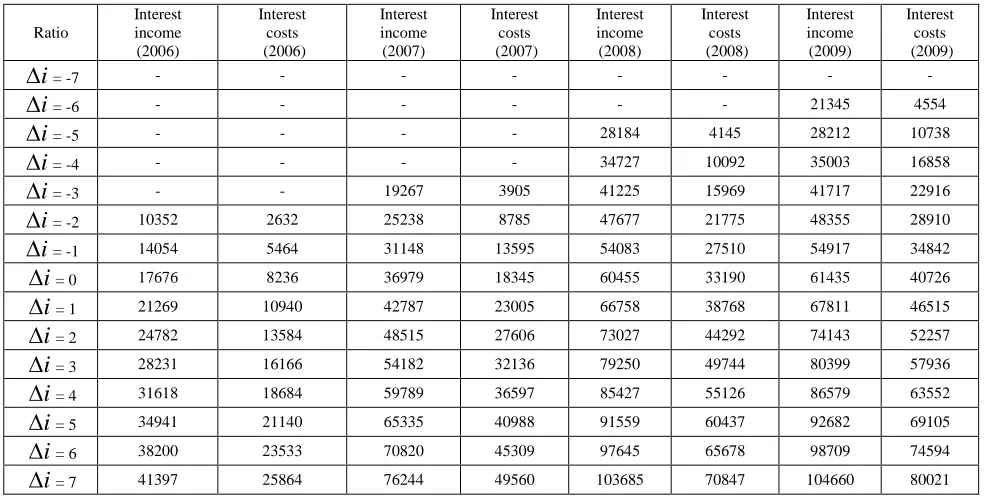
Table 6 provides absolute estimates of “Medicinos bankas” interest income and the total interest costs in Litas, taking
into account possible changes in the market interest rate shown in previous table no. 4.
Table 6
The total “Medicinos bankas” interest income and costs upon changes in the market interest rate (in thousand LTL)
Ratio
Interest income (2006)
Interest costs (2006)
Interest income (2007)
Interest costs (2007)
Interest income (2008)
Interest costs (2008)
Interest income (2009)
Interest costs (2009)
i
∆
= -7 - - - -i
∆
= -6 - - - 21345 4554i
∆
= -5 - - - - 28184 4145 28212 10738i
∆
= -4 - - - - 34727 10092 35003 16858i
∆
= -3 - - 19267 3905 41225 15969 41717 22916i
∆
= -2 10352 2632 25238 8785 47677 21775 48355 28910i
∆
= -1 14054 5464 31148 13595 54083 27510 54917 34842i
∆
= 0 17676 8236 36979 18345 60455 33190 61435 40726i
∆
= 1 21269 10940 42787 23005 66758 38768 67811 46515i
∆
= 2 24782 13584 48515 27606 73027 44292 74143 52257i
∆
= 3 28231 16166 54182 32136 79250 49744 80399 57936i
∆
= 4 31618 18684 59789 36597 85427 55126 86579 63552i
∆
= 5 34941 21140 65335 40988 91559 60437 92682 69105i
∆
= 6 38200 23533 70820 45309 97645 65678 98709 74594i
∆
= 7 41397 25864 76244 49560 103685 70847 104660 80021The difference between the total interest income and the total interest cost equals to the net interest income that is the result of simulation model. The results of simulation model
of sensitivity of the bank “Šiauliai bankas” net interest income to the market interest rate for the year period of 2006 – 2009 in graphical form are provided in Figure 1.
The effect of interest rate change to the net interest income of "Šiauliai bankas" in period of Y2006 - Y2009
0 10000 20000 30000 40000 50000 60000 70000
-0.08 -0.06 -0.04 -0.02 0 0.02 0.04 0.06 0.08
Interest rate change (0.01 = 1 %)
N
et
i
n
te
re
st
i
n
co
m
e
(t
h
o
u
L
T
L
)
NII(2006) NII(2007) NII(2008) NII(2009)
Figure 1. Graph of “Šiauliai bankas” net interest income under conditions of the simulation model
Information provided in Table 1 shows that subject to changes in the market interest rate level and other conditions remaining constant, the net interest income is changing. As interest margin of a bank in the simulation model is considered as constant value, increasing market interest rate increases net interest income and vice versa – decreasing market interest rate decreases interest income. It means that there is dependency between the changes in
the market interest rate and net interest income of a commercial bank.
Simulation model shows that elasticity of graphs of “Šiauliai bankas” net interest income is unfavourable to growth of the market interest rate during the period of 2006/2009.
The results of simulation model of sensitivity of AB “Medicinos bankas” net interest income to the market interest rate for the years 2006/2009 in graphical form are provided in Figure 2.
0 5000 10000 15000 20000 25000 30000 35000
-0.08 -0.06 -0.04 -0.02 0 0.02 0.04 0.06 0.08
Interest rate change (0.01 = 1 %)
N
e
t
in
te
re
st
i
n
c
o
m
e
(
th
o
u
L
T
L
)
NII(2006) NII(2007) NII(2008) NII(2009)
The effect of interest rate change to the net interest income of "Medicinos bankas" in period of Y2006 - Y2009
Figure 2. Graph of “Medicinos bankas” net interest income under conditions of the simulation model
The results of the simulation model provided in Figure 2 show that the form of graphs of “Medicinos bankas” net interest income in the period of the years 2007 – 2008 is positively curved against abscise axis, and in 2009 – negatively. In 2006, the graph of net interest income is not curved and has linear form. Graph forms in the period of 2007 – 2008 show that upon the increase of the market interest rate, the boundary values of net interest income is increasing. Subject to other conditions remaining constant, the structure of “Medicinos bankas” assets and liabilities is favourable to the market interest rate growth in 2007 – 2008 period, unfavourable in 2009, and having no effect in the year 2006.
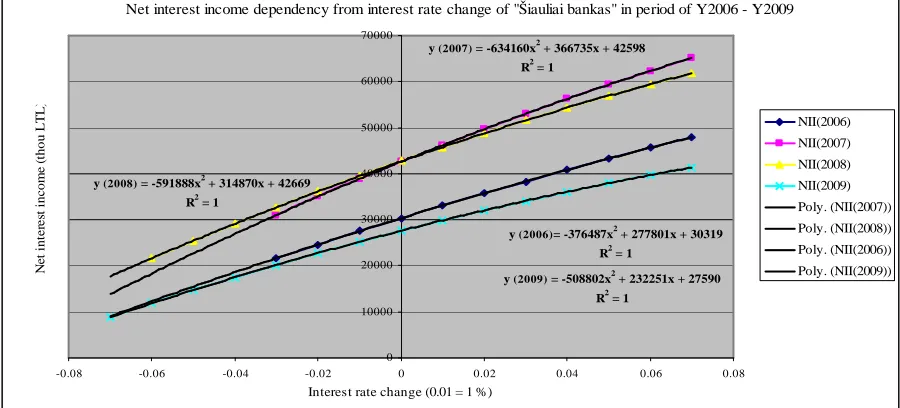
In order to make unprejudiced assessment and the comparison of the elasticity of a net interest income, it is necessary to find a functional relation between independent and dependent variables in the net interest income provided in the model. Mathematical functional relation and elasticity of this relation allow the assessment of the level of the market interest rate risk using net interest income graphs of the simulation model. Functional dependency of net interest income on the changes in the market interest rate enable calculating boundary values of net interest income, having changed the market interest rate by a forecasted value. In other words, simulation modelling allows forecasting of the boundary values of net interest income, upon changes in income rate (Figure 3)
y (2007) = -634160x2 + 366735x + 42598 R2 = 1
y (2008) = -591888x2 + 314870x + 42669 R2 = 1
y (2006)= -376487x2 + 277801x + 30319 R2 = 1
y (2009) = -508802x2 + 232251x + 27590 R2 = 1
0 10000 20000 30000 40000 50000 60000 70000
-0.08 -0.06 -0.04 -0.02 0 0.02 0.04 0.06 0.08
Interest rate change (0.01 = 1 %)
N
e
t
in
te
re
st
i
n
c
o
m
e
(
th
o
u
L
T
L
)
NII(2006) NII(2007) NII(2008) NII(2009)
Poly. (NII(2007)) Poly. (NII(2008)) Poly. (NII(2006)) Poly. (NII(2009)) Net interest income dependency from interest rate change of "Šiauliai bankas" in period of Y2006 - Y2009
In the course of the research it was found that the functional relation of the simulation model is statistically reliable as the determination coefficient of net interest income function in every analysed year is equal to one. The determination coefficient shows the level of dependency between a result characteristic and its determinant factors. In the calculations of the simulation model it was shows that there is a functional dependency between net interest income of a commercial bank and the change in the market interest rate.
The graphs of “Šiauliai bankas” net interest income mathematically are defined in the form of parabolic function. coefficients of all parabolic functions – negative.
In the case of the increase of interest rate level it shows the decreasing boundary values of net interest income.
Having sufficiently accurate forecasts of changes in the market interest rate, the structure of assets and liabilities can be reorganised in such a way that boundary values of interest income would increase upon changes in the market interest rate. Thus, interest rate risk factors through simulation modelling and the market interest rate forecasting tools can make positive impact on net value and net interest income of a bank.
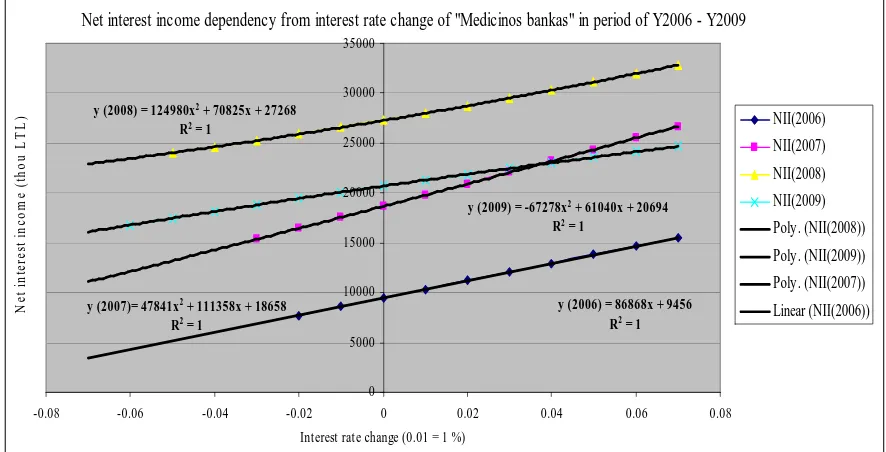
Figure 4 shows algebraic functions of the dependence of “Medicinos bankas” net interest income from the changes in the market interest rate.
y (2008) = 124980x2 + 70825x + 27268
R2 = 1
y (2009) = -67278x2 + 61040x + 20694
R2 = 1
y (2007)= 47841x2 + 111358x + 18658
R2 = 1
y (2006) = 86868x + 9456 R2 = 1
0 5000 10000 15000 20000 25000 30000 35000
-0.08 -0.06 -0.04 -0.02 0 0.02 0.04 0.06 0.08
Interest rate change (0.01 = 1 %)
N
et
i
n
te
re
st
i
n
c
o
m
e
(
th
o
u
L
T
L
) NII(2006)
NII(2007)
NII(2008)
NII(2009)
Poly. (NII(2008))
Poly. (NII(2009))
Poly. (NII(2007))
Linear (NII(2006))
Net interest income dependency from interest rate change of "Medicinos bankas" in period of Y2006 - Y2009
Figure 4. Net interest income dependency from interest rate change of “Medicinos bankas“
The results of the bank “Medicinos bankas” simulation model for the years 2006 – 2009 also show mathematical functional correlation, with its determination coefficient being also equal to one. Contrary to “Šiauliai bankas” case, the dependence of “Medicinos bankas” the net interest income in 2007 – 2009 shows functional relation in the form of parabola, while in 2006 – linear dependence. Functional relation of “Medicinos bankas” net interest income in the year 2006 shows minimisation of interest rate risk. In this case, commercial bank distributes the structure of assets and liabilities in such a way that boundary values of net interest income would be constant.
A parabolic function characterising the dependency of “Medicinos bankas” net interest income in the years 2007 and 2008 has positive sign. In case of increase of the market interest rate, it shows increasing boundary values of net interest income. The trend for increase of the market interest rate is observed both in 2006 – 2008 historical data analysis of VILIBOR and EURIBOR interest rate, and in analysis of “Šiauliai bankas” and “Medicinos bankas” basis interest rate in regard of assets and liabilities. It means that the structure of “Medicinos bankas” interest sensitive assets and interest sensitive liabilities is balanced for growth of the market interest rate, expecting to earn additional income from changes in the interest rate (policy
focused on speculative purposes).The graph of “Medicinos bankas” net interest income in the year 2009 has negative function sign. However, in the end of 2009 and beginning of 2010 decrease in interbank interest rate is observed. In this case the structure of “Medicinos bankas” assets and liabilities is favourable for the decrease of the market interest rate.
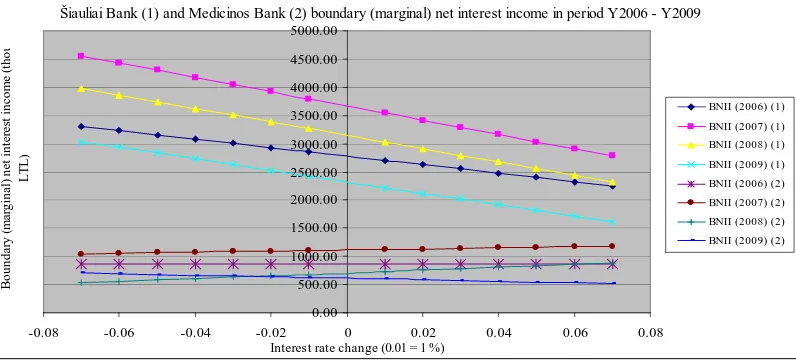
If net interest income function has a linear form, then the first-order derivative of this function is a constant. In that case, the graph of the boundary values of net interest income – is a horizontal line against abscise axis. It shows that boundary values of net interest income is changing in equal proportions, notwithstanding whether the market interest rate is increasing or decreasing (Figure 5. Graph of “Medicinos bankas” RGPP (2006)).
Šiauliai Bank (1) and Medicinos Bank (2) boundary (marginal) net interest income in period Y2006 - Y2009
0.00 500.00 1000.00 1500.00 2000.00 2500.00 3000.00 3500.00 4000.00 4500.00 5000.00
-0.08 -0.06 -0.04 -0.02 0 0.02 0.04 0.06 0.08
Interest rate change (0.01 = 1 %)
B
o
u
n
d
a
ry
(
m
a
rg
in
a
l)
n
e
t
in
te
re
st
i
n
c
o
m
e
(
th
o
u
L
T
L
)
BNII (2006) (1)
BNII (2007) (1)
BNII (2008) (1)
BNII (2009) (1)
BNII (2006) (2)
BNII (2007) (2)
BNII (2008) (2)
BNII (2009) (2)
Figure 5. Graphs of “Siauliai bankas” and “Medicinos bankas” boundary values of net interest income
In this case, much attention should be paid to the sign of coefficient of boundary values of net interest income function. If it is positive, the increase in the market interest rate is favourable to a bank, if it is negative , the decrease in the market interest rate is favourable.
The provided results of the simulation model of the sensitivity of net interest income to the changes in the market interest rate closely correlate with results of revaluation duration gap analysis. The inclination of the graph of boundary values of net interest income correlates with a ratio of average leveraged duration gap of revaluation. But in the simulation model the ratios of revaluation duration are mathematically correlated with net interest income and become a tool for assessment of the level of the market interest rate risk.
Conclusions
The methods of an income gap and a duration gap of an average revaluation term, also the methods of the sensitivity analysis and simulation modelling are combined making the basis for the theoretical model of sensitivity of net interest income to the changes in the market interest rate.
Simulation modelling provides a possibility to define the effect of the market interest rate fluctuations on net interest income of commercial banks, in other words, it is possible to assess the value of net interest income risk, i.e.a certain change in income due to the changes in the market interest rate within the selected period.
Gap analysis calculations allow to conclude: in the period of 2006 - 2009 “Medicinos bankas” gave the priority to short-term credits and investments, reserving a possibility to make more often revaluation of interest rate sensitive assets. Such principles of the formation of assets and liabilities were favourable during the period of the market interest rate growth. On the contrary, long-term credits and investments prevailed in “Šiauliai bankas” assets and liabilities structure. As a consequence average leveraged duration of “Medicinos bankas” assets revaluation was shorter than average leveraged duration of liabilities revaluation, while the principles of the formation
of “Šiauliai bankas” assets and liabilities were opposite: an average leveraged duration of assets revaluation was longer than an average leveraged duration of liabilities revaluation. Such policy of assets and liabilities management is not favourable during the period of the market interest rate growth.
The calculations and applied model of sensitivity of net interest income to the changes in interest rate established the possibility to prove that there ezists a mathematical functional dependency of net interest income from the market interest rate. The graphic form of this dependency is a parabolic or linear dependency functions. An independent variable in these specific functions shows a change in the market interest rate. A dependent variable stands for net interest income. The first-order derivative of a net interest income function shows the dependency of boundary values of interest income from the changes in the market interest rate. In the case of increasing interest rate level, when the function of parabola is negative, boundary values of interest income of a bank are decreasing. When the function of parabola is positive, the boundary values of interest income are increasing.
The bigger inclination of net interest income function, the higher level of market interest rate risk is to the structure of assets and liabilities of a commercial bank. If the function sign is positive, increase in the market interest rate is favourable to a bank, if negative, the decrease in the market interest rate is favourable.
In the simulation model of the sensitivity of net interest income to the market interest rate, the revaluation duration ratios are mathematically correlated with net interest income. This correlative link is a tool for the quantitative assessment of the effect of the market interest rate risk on profitability ratios of commercial banks.
under the market conditions, as due to the changes in interest rate sensitive items and rapid response to the changes in the market interest rate, banks would maximise
their net interest income, thus increasing competitiveness of retail banks in the financial market.
References
Beck, K. L., Goldreyer, E. F., & D‘Antonio, L. J. (2000). Duration gap in the context of a bank‘s strategic planning process. Journal of Financial and Strategic Decisions, 13(2).
Crouhy, M., Galai, D., & Mark, R. (2000). Essentials of Risk Management.
Deltuvaite, V., Vaskelaitis, V., & Pranskeviciute, A. (2007). The Impact of Concentration on Competition and Efficiency in the Lithuanian Banking Sector. Inzinerine Ekonomika- Engineering Economics(4),7-19.
European Central Bank. Working Paper Series. An Economic capital model integrating credit and interest rate risk in the banking book. [interactive]. 2009. [accessed 2010-04-11]. Internet access: <http://www.ecb.int/pub/pdf/scpwps/ecb wp1041.pdf>
Federal Reserve Bank website. GAP Analysis. [interactive]. [accessed 2009-06-21]. Internet access:<http://www.stlouisfed.org /col/director/Materials/alco_gapanalysis_print.htm>
Houpt, J. V., & Embersit, J. A. (1991). Federal Reserve Bulletin. A Method for evaluating interest rate risk in U.S. commercial banks. Retrieved April 11, 2010 from http://www.accessmylibrary.com/article-1G1-11131420/method-evaluating-interest-rate.html.
Jasiene, M. (1998). Palukanu normos rizikos valdymas. Vilnius.
Kidwell, D., Peterson, R., & Blackwell, D. (2000). Financial Institutions, Markets and Money. Fort Worth: The Dryden Press.
Kraujalis, S., Karpaviciene, E., & Cvilikas, A. (2006). The specifics of Operational Risk Assessment Methodology. Kropas, S., Ciapas, L., Sidlauskas, G., & Vengraitis, D. (1998). Bank finansų valdymas. Vilnius: Lietuvos bankininkyst÷s,
draudimo ir finansų institutas.
Statistical data of the bank of Lithuania. (2010). Bank of Lithuania. VILIBOR database. Retrieved February 12, from http://www.lb.lt/statistics/statbrowser.aspx?group=7222&lang=lt&orient=horz
Lileikiene, A. (2008). Analysis of Chosen Strategies of Asset and Liabiliti. Inzinerine Ekonomika-Engineering Economics(2), 32-40.
Lakstutiene, A., Breiteryte, A., & Rimsaite, D. (2009). Stress Testing of Credit Risk Lithuania Banks under Simulated Economical Crisis Enviroment Conditions. Inzinerine Ekonomika-Engineering Economics(5), 15-25.
Lukosevicius, M., & Dzikevicius, A. (2003). Palukanu normos risk ir jos matavimas komerciniame banke. Lietuva be mokslo – Lietuva be ateities konferencijos medziaga. Vilnius: Technika.
Macerinskiene, I., & Ivaskeviciute, L. (2000). Banku paskolu portfelio valdymo tyrimo metodologiniai aspektai. Socialiniai mokslai, 5.
Mahshid, D. (2010). Managing interest rate risk, a case study of four Swedish savings banks (Master’s Thesis 2010). Retrieved March 12.
Medicinos banko finansines ataskaitos. (2010). Medicinos bankas. Retrieved March 28, from http://www.medbank.lt/apie-medicinos-banka/48-apie-banka/134-bank-finansines-ataskaitos.html
Miller, R., L., & VanHoose, D. D. (2000). Money, Banking and Financials Markets.
Mishkin, F. S. (2007). The Economics of Money, Banking, and Financial Markets. Eight edition. Murthy, E. N. (2008). Managing assets and liabilities. ICFAI journal Professional Banker, 5(1).
Priyank, S. (2007). An Assignment on Assets – Liabilities Management proprietary in Banks. Retrieved April 11, 2010 from http://www.scribd.com/doc/13822454/ASSET-LIABILITIES-Mnagament-in-banks
Ruskys, G. (2002). Risk parametrųįvertinimo ypatumai Lietuvos finansų rinkoje. Organizacijų vadyba: sisteminiai tyrimai,3, 7.
Rutkauskas, A. V. (2009). Integruotas įmon÷s vert÷s ir rizikos valdymas. Retrieved June 17, from http://distance.ktu.lt/kursai/verslumas/finansu_valdymas_II/117013.html
Santomero, M. A. (2009). Commercial bank risk management: an analysis of the process. The Wharton Financial Institution Center Conference. University of Pennsylvania. Retrieved April 22, from http://fic.wharton.upenn.edu/fic/ papers/95/9511.pdf
Saunders, A. (1994). Financial Institutions Management: A Modern Perspective. Burr Ridge: Irwin.
Van Greuning, H., & Bratanovic, S. B. (2000). Analyzing Banking Risk. A Framework for Assessing Corporate Governance and Financial Risk Management. Washington.
Zaltauskiene, N. (2002). Palukanu normu risk valdymo teoriniai aspektai. Retrieved June 20, 2009 from http://baitas.lzuu.lt/~mazylis/julram/7/173.pdf
Zeitlin, J. (2009). GAP analysis. Retrieved April 11, 2010 from http://www.joshzeitlin.com/tag/gap/
Angele Lileikiene, Aurimas Likus
Rinkos palūkanų normos pokyčio įtakos komercinių bankų grynosioms palūkanų pajamoms analiz÷
Santrauka
Palūkanų normos rizikos valdymas komerciniuose bankuose yra vienas „kertinių akmenų“ bankų aktyvų ir pasyvų valdymo procese, nes nuo to priklauso banko pelningumas. M. Jasien÷ (1998) plačiai aprašo palūkanų normos riziką ir jos galimą poveikį aktyvų ir pasyvų struktūrai. A. Lileikien÷ ir J. Martinkien÷ (2004) moksliniuose straipsniuose pabr÷žia komercinių bankų aktyvų ir pasyvų strategijos pasirinkimo svarbą ir priemones palūkanų
normos rizikai valdyti. Palūkanų normos rizika ir valdymo priemon÷s aprašomos ir N. Žaltauskien÷s (2005) moksliniuose darbuose. Nemažai mokslinių
tyrimų ir studijų šia tema atlikta užsienio autorių. E. N. Murthy (2008), S. Priyank (2007) detaliai aprašo palūkanų normos rizikos vertinimo metodus, analizuodami komercinių bankų aktyvų ir pasyvų balanso straipsnių vertes. F. S. Mishkin (2007) pateikia komercinių bankų aktyvų ir pasyvų struktūros vertinimo matematinius būdus. Palūkanų normos rizikos vertinimo metodai ir mokslinių tyrimų rezultatai aprašomi ir specializuotuose periodiniuose leidiniuose, kurie viešai platinami ir šiuo metu, pavyzdžiui, JAV centrinio banko iniciatyva leidžiamas periodinis leidinys „GAP Analysis“.
Atlikta ekonomin÷s mokslin÷s literatūros šaltinių analiz÷ rodo, kad daugiausia mokslinių tyrimų palūkanų normos rizikos valdymo tema atlikta analizuojant rizikos mažinimo arba neutralizavimo priemones – palūkanų apsikeitimo ir ateities palūkanų sandorius, taip pat palūkanų opcionus. Autorių
nuomone, be palūkanų normos rizikos valdymo, turi būti išskiriama atskira mokslinių tyrimų sritis – palūkanų normos rizikos vertinimas. Nors mokslin÷je literatūroje žinomi palūkanų normos rizikos vertinimo metodai tiksliai ir išsamiai įvertina palūkanų normos riziką, tačiau sud÷tinga rasti kiekybinių palūkanų normos rizikos vertinimo modelių, kurie rinkos palūkanų normos pokyčius susietų su bankų finansiniais veiklos rodikliais. Palūkanų
pajamos yra pagrindinis komercinių bankų pajamų šaltinis. Kitiems veiksniams nekintant, rinkos palūkanų normos pokyčiai gali reikšmingai daryti įtaką
komercinių bankų palūkanų pajamoms. M. Jasien÷ (1998) pabr÷žia, kad rinkos palūkanų normos lygis ir ekonomikos aktyvumo ciklas kinta vienu metu. Lietuvos ekonomikai žengiant į ekonomikos smukimo ir nuosmukio ciklo etapus, tik÷tinas rinkos palūkanų normos lygio kitimas. Tarpbankinių palūkanų
normos dinamin÷ analiz÷ rodo reikšmingus palūkanų normos lygio pokyčius. Tai padidina palūkanų normos riziką ir sustiprina rinkos palūkanų normos pokyčiųįtaką grynosioms komercinių bankų palūkanų pajamoms.
Mokslinio straipsnio tyrimo objektas – palūkanų normos rizikos vertinimo metodai ir pritaikymo galimyb÷s. Tyrimo tikslas – sukurti komerciniams bankams grynųjų palūkanų pajamų jautrumo rinkos palūkanų normos pokyčiams modelį ir praktiškai jį pritaikyti AB Šiaulių bankas ir AB Medicinos bankas palūkanų normos rizikai įvertinti ir valdyti, taip didinant mažmeninių bankų konkurencingumą finansų rinkoje.
Tyrimo tikslui pasiekti buvo suformuluoti ir iškelti šie uždaviniai:
1. Išnagrin÷ti ir aprašyti analiz÷s metodus, galinčius įvertinti komercinių bankų palūkanų normos riziką ir vykdomą aktyvų ir pasyvų valdymo politiką terminų suderinamumo atžvilgiu.
2. Nustatyti rinkos palūkanų normos svyravimųįtaką komercinių bankų grynosioms palūkanų pajamoms.
3. Spragos analiz÷s metodu įvertinti AB Šiaulių bankas ir AB Medicinos bankas palūkanų normos riziką bei aktyvų ir pasyvų formavimo principus 2006 – 2009 metų laikotarpiu.
Tyrimo metodai – ekonomin÷s mokslin÷s ir akademin÷s literatūros analiz÷, palyginimas, apibendrinimas, statistiniai ir ekonometriniai metodai, sintez÷ ir ekstrapoliacija, grafinis vaizdavimas, statinių ir dinaminių duomenų analiz÷, prognozavimas ir imitacinis modeliavimas.
Teorinis ir praktinis tyrimo rezultatų reikšmingumas grindžiamas sisteminiu požiūriu į palūkanų normos riziką ir aktyvų bei pasyvų valdymą, kuris realizuojamas teoriniu grynųjų palūkanų pajamų jautrumo rinkos palūkanų normai modeliu. Šis modelis projektuojamas atsižvelgiant į plačias praktinio pritaikymo galimybes, kurios iš esm÷s priklauso nuo pradinių tyr÷jų prielaidų ir sudaro galimybes didinti regioninių komercinių bankų veiklos konkurencingumą, nes mažmeniniam bankui gaunant didesnes grynąsias palūkanų pajamas, atsižvelgiant į jautrias rinkos palūkanų normas, maž÷ja banko rizikos laipsnis, did÷ja pelningumas. Praktinis modelio reikšmingumas pasižymi galimybe kiekybiškai įvertinti palūkanų normos riziką ir įtaką
komercinių bankų grynosioms palūkanų pajamoms. Taikant imitacinį modeliavimą , siekiama įvertinti grynųjų palūkanų pajamų rizikos vertę – tam tikrą
pajamų pokytį d÷l rinkos palūkanų normos pasikeitimo per pasirinktą laikymo terminą, kai kitos sąlygos nekinta. Kuriamas modelis ir aprašomų metodų
visuma yra priemon÷, galinti pad÷ti banko vadovams rasti pusiausvyrą tarp banko veiklos pelningumo, likvidumo ir saugumo. Aprašomi metodai ir kuriamas teorinis modelis netinka analizuoti grynųjų pajamų svyravimus, priklausančius nuo banko sugeb÷jimo kontroliuoti ne palūkanų išlaidas ir gauti pajamų ne iš palūkanų. Komercinių bankų aktyvų ir pasyvų struktūros formavimo politika terminų suderinamumo atžvilgiu nulemia, kokį palūkanų
normos rizikos laipsnį prisiima bankas.
Palūkanų normos rizikos vertinimas taikant pajamų spragos analiz÷s metodą suteikia galimybę nustatyti, kokia aktyvų ir pasyvų strategija vadovaujasi komerciniai bankai skirtingais perkainojimo terminais. Jautrių palūkanų normai balanso straipsnių aktyvų ir jautrių pasyvų straipsnių verčių
santykis rodo palūkanų normos riziką perkainojimo terminų suderinamumo atžvilgiu. Kuo šis rodiklis artimesnis vienetui, tuo palūkanų normos rizika mažesn÷. Šio metodo trūkumas – ribotos galimyb÷s kiekybiškai įvertinti rinkos palūkanų normos pokyčio įtaką banko pelningumo rodikliams.
Palūkanų normos rizikos vertinimas taikant vidutin÷s svertin÷s perkainojimo laiko trukm÷s spragos metodą suteikia galimybę atsiriboti nuo perkainojimo terminų ir sistemiškai įvertinti bendrą jautrių palūkanoms aktyvų ir bendrą jautrių pasyvų skirtumo perkainojimo trukmę. Šis tyrimo metodas leidžia kiekybiškai apskaičiuoti, kiek vidutiniškai trunka perkainuoti palūkanoms jautrių aktyvų ir jautrių pasyvų skirtumą.
Pajamų ir vidutin÷s svertin÷s perkainojimo laiko trukm÷s spragos analiz÷s metodai – tai priemon÷ alternatyviems veiklos modeliams kurti, rinkos palūkanų normą laikant kintamuoju dydžiu. Taikant šiuos metodus kartu su jautrumo analize, komerciniai bankai gali ne tik tiksliai apsiskaičiuoti rinkos palūkanų normos pokyčių riziką, bet ir tą riziką valdyti pelno siekimo tikslais. Metodų sintez÷ ir imitacinis modeliavimas leidžia numatyti komercinių
bankų grynųjų palūkanų pajamų vert÷s pasikeitimus įvairiomis rinkos sąlygomis.
Žinodami, kad verslo ekonominių ciklų ir rinkos palūkanų normos lygis kinta vienu metu, komerciniai bankai gali prognozuoti rinkos palūkanų
normos kitimą ir, taikydami imitacinį modeliavimą, prognozuoti grynųjų palūkanų pajamų pokyčius.
Taikant grynųjų palūkanų pajamų jautrumo rinkos palūkanų normos pokyčiams imitacinį modelį, galima įvertinti komercinių bankų aktyvų ir pasyvų struktūros formavimo principus ir jųįtaką grynosioms palūkanų pajamoms. Taip pat taikant imitacinį modeliavimą, galima įvertinti grynųjų
palūkanų pajamų rizikos vertę – tam tikrą pajamų pokytį d÷l rinkos palūkanų normos pasikeitimo per pasirinktą laikymo laikotarpį. Šiam uždaviniui
įgyvendinti sujungiami pajamų ir vidutin÷s svertin÷s perkainojimo laiko trukm÷s spragos, taip pat jautrumo ir imitacinio modeliavimo metodai, kurie sudaro grynųjų palūkanų pajamų jautrumo rinkos palūkanų normos pokyčiams teorinio modelio pagrindą.
Remiantis 2006 - 2009 metų metin÷s finansin÷s atskaitomyb÷s duomenimis, atliktas AB Šiaulių bankas ir AB Medicinos bankas aktyvų ir pasyvų