bru
n
a
ška
rica
:
d
eterm
in
a
nts
of
non
-pe
r
for
mi
ng
loa
n
s
in
cen
tra
l
and
eas
tern
europ
ea
n
co
u
n
tries
financial
theor
y
and
practice
38 (1) 37-59 (2014)
37
Determinants
of non-performing loans
in Central and Eastern
European countries
BRUNA ŠKARICA*
Article**
JEL: E32, E44, E52, G10 doi: 10.3326/fintp.38.1.2
* The author would like to thank two anonymous referees for their helpful comments and suggestions as well as Dr Petar Sorić for his mentorship.
** Received: June 1, 2013 Accepted: December 28, 2013
The article won the prize for the best student category paper in the annual award of the Prof. Dr. Marijan Hanžeković Prize for 2013.
Bruna ŠKARICA
bru
n
a
ška
rica
:
d
eterm
in
a
nts
of
non
-pe
r
for
mi
ng
loa
n
s
in
cen
tra
l
and
eas
tern
europ
ea
n
co
u
n
tries
financial
theor
y
and
practice
38 (1) 37-59 (2014)
38
abstractThis paper analyses the determinants of the changes in the non-performing loan (NPL) ratio in selected European emerging markets. The model was estimated on a panel dataset using a fixed effects estimator for seven Central and Eastern Eu-ropean (CEE) countries between Q3:2007 and Q3:2012. The countries analyzed are Bulgaria, Croatia, Czech Republic, Hungary, Latvia, Romania and Slovakia. Although the literature on NPLs is quite extensive, this is the first empirical rese-arch on the countries of CEE region using aggregate, country-level data on pro-blem loans. The results suggest that the primary cause of high levels of NPLs is the economic slowdown, which is evident from statistically significant and econo-mically large coefficients on GDP, unemployment and the inflation rate.
Keywords: non-performing loans, macro-financial linkages, Central and Eastern Europe, panel regressions, financial stability
1 introduction
The recent financial crisis has left a legacy of extremely high levels of NPLs in the CEE region. In 2008, countries that had based their economic growth on the boo-ming banking sector (Sirtaine and Skamnelos, 2007) at the beginning of the past decade found themselves faced with a sudden credit growth halt (European Banking Coordination ‟Vienna” Initiative, 2012). This is attributable to both the reduced demand for financing and reduced willingness to lend on the part of the European banks. The high levels of NPLs are becoming a growing issue, given that experiences from past financial crises show that a lasting recovery requires a ‟clean-up” of the financial sector. It is also clear that NPLs induce uncertainty and impact the banks’ willingness and ability to keep lending, therefore affecting ag-gregate demand and investments. Furthermore, unresolved NPLs suppress the economic activity of currently overextended borrowers and trap resources in unproductive uses. All of these problems are particularly prominent in the CEE region, where recovery following the extreme economic slowdown has been very weak. To illustrate the strong impact of the global recession on the economic per-formance of CEE countries, it is sufficient to state that in 2009 all of the 7 coun-tries analyzed in this paper suffered negative annual real GDP growth rates of over 4% (Latvia’s economy, for example, contracted by 17.7% in 2009, on a year-to-year basis).
bru
n
a
ška
rica
:
d
eterm
in
a
nts
of
non
-pe
r
for
mi
ng
loa
n
s
in
cen
tra
l
and
eas
tern
europ
ea
n
co
u
n
tries
financial
theor
y
and
practice
38 (1) 37-59 (2014)
39
figure 1
Annual levels of NPLs, 2008-2011
2008 2009 2010 2011
4.5 4.0 3.5 3.0 2.5 2.0 1.5 1.0 0.5 0.0
Source: World Bank.
Although the literature on NPLs is quite extensive, this is the first empirical rese-arch on the countries of CEE region using aggregate, country-level data on pro-blem loans. This empirical analysis includes 7 countries of the CEE region: Bul-garia, Croatia, Czech Republic, Hungary, Latvia, Romania and Slovakia. It needs pointing out that the choice of the countries analyzed (as well as the observed time period) was determined primarily by the scarcity of data on NPLs. The data was collected from quarterly financial stability reports by central banks of the 7 countries included in the research; no earlier data were available for all 7 coun tries (or other CEE countries) – therefore, in order to have a balanced panel for all 7 countries, with aggregate data, this time period was chosen. The model was esti-mated on a panel dataset using ordinary least squares and including fixed effects. The results suggest that the primary cause of high levels of NPLs is the extreme economic slowdown.
The rest of the paper is organized as follows. Section two provides a summary of the relevant literature discussing the determinants of NPLs. Section three descri-bes some stylized facts about recent developments in the banking sectors of the CEE countries, data used in the analysis and states the potential impact of each variable on the NPL ratio. This is followed by a description of methodology and the presentation of results. Section five concludes.
2 literatureoverview
The macroeconomic determinants of NPLs, or the quality of bank assets in gene-ral, have generated a substantial amount of interest since the outbreak of the finan-cial crisis in the autumn of 2008.
develo-bru
n
a
ška
rica
:
d
eterm
in
a
nts
of
non
-pe
r
for
mi
ng
loa
n
s
in
cen
tra
l
and
eas
tern
europ
ea
n
co
u
n
tries
financial
theor
y
and
practice
38 (1) 37-59 (2014)
40
ped the concept of the ‟financial accelerator”, arguing that credit markets are procyclical and that information asymmetries between lenders and borrowers as well as the balance sheet effect work to amplify and propagate credit market shocks to the economy. The Kiyotaki and Moore (1997) model showed how rela-tively small shocks might suffice to explain business cycle fluctuations, if credit markets are imperfect.2.1 empiricalstudies:singleeconomyanalyses
bru
n
a
ška
rica
:
d
eterm
in
a
nts
of
non
-pe
r
for
mi
ng
loa
n
s
in
cen
tra
l
and
eas
tern
europ
ea
n
co
u
n
tries
financial
theor
y
and
practice
38 (1) 37-59 (2014)
41
and Dahl (2003) used panel regression models to suggest that credit terms have asignificant effect on Indian non-performing loans in the presence of bank size in-duced risk preferences and macroeconomic shocks. The changes in the cost of credit in terms of expectations of higher interest rates induce a rise in NPLs. On the other hand, factors like the horizon of maturity of credit, better credit culture, favorable macroeconomic and business conditions all lead to the lowering of NPLs. Quagliariello (2003) presented a regression between the evolution of Ita-lian NPLs as the dependent variable and a set of explanatory variables: the real GDP growth rate, growth of real gross fixed investment and consumption, change in the unemployment rate, CPI, real exchange rate and M2 growth rate. He sho-wed that the declining GDP growth and increasing unemployment rate have a si-gnificant negative effect on loan portfolio quality in Italy. Arpa et al. (2001) also applied regression analysis showing that risk provisions in the total loans of the Austrian banking sector vary with real GDP growth, CPI inflation, real estate price inflation and real interest rates. Shu (2002) examined the NPL ratio in Hong Kong using regression models. His analysis showed that the increasing NPL ratio can be attributed to the increasing nominal interest rates and the number of bankruptcies, whereas the NPL ratio decreases with higher CPI inflation, economic growth and property price inflation. Louzis, Vouldis and Metaxas (2011) explored both bank-specific and macroeconomic determinants of NPLs in Greece, using dynamic pa-nel data sets separately for each loan category (consumer, business loans and mortgages). Their study shows that all categories of Greek NPLs can be explained by macroeconomic variables (GDP growth, unemployment, interest rates, public debt) as well as by management quality.
2.2 panelanalyses
bru
n
a
ška
rica
:
d
eterm
in
a
nts
of
non
-pe
r
for
mi
ng
loa
n
s
in
cen
tra
l
and
eas
tern
europ
ea
n
co
u
n
tries
financial
theor
y
and
practice
38 (1) 37-59 (2014)
42
there is a slowdown in the economy, the NPL level is likely to increase, as une-mployment rises and borrowers face greater difficulties in repaying their debt.3 dataandstylizedfacts
In the following chapter, a discussion on the common treatment of the non-perfo-rming loans in macroeconomic statistics will be presented. In addition, the varia-bles used in the analysis and their expected channel of impact on the NPL ratio will be introduced, as well as a short overview of the banking sector in the CEE region.
3.1 data
bru
n
a
ška
rica
:
d
eterm
in
a
nts
of
non
-pe
r
for
mi
ng
loa
n
s
in
cen
tra
l
and
eas
tern
europ
ea
n
co
u
n
tries
financial
theor
y
and
practice
38 (1) 37-59 (2014)
43
NPL definitions based on national credit quality classifications of CEE countrieslargely appear to be comparable as they are based on the ‟90-days-past-due crite-rion”.
However, it should be noted that apart from the days of overdue, there are other differences among the definitions and NPL classification criteria across countries. These include taking into account whether or not a judicial procedure has been started against the debtor (e.g. Romania), reporting NPL levels net of provisions (instead of in gross terms, which is the international standard) and the role of col-lateral and guarantees.
3.2 variablesandexpectedchannelsofimpact
The independent variables are commonly used country-specific macroeconomic indicators and the level of loans in the banking sector. The aforementioned macro-economic aggregates include the real GDP growth, unemployment rate, nominal effective exchange rate (NEER), harmonised index of consumer prices (HICP), share prices index and the 3 month money market interest rate. The data on real GDP growth, unemployment rates, HICP, 3 month money market interest rates and the share prices indices are obtained from Eurostat. Nominal effective exch-ange rates are calculated as geometric weighted averages of bilateral exchexch-ange rates, with 61 economies included in the basket, and are taken from the Bank for International Settlements database. The data on total loans refers to outstanding amounts of domestic loans in all currencies (originally in millions of euro) at the end of each period (quarter), and are retrieved from the European Central Bank statistics.
The relevance and expected signs of the relationships between NPL ratio and the selected variables are as follows:
– Following the results of previous empirical studies on NPLs and their pro-ven countercyclical nature, it can be expected that real GDP growth and employment will be negatively associated with NPLs. A growing economy increases borrowers’ income and ability to repay debts and it generally in-creases overall financial stability.
– An increase of NEER represents an appreciation of the domestic currency. Currency appreciation can weaken debt-servicing capabilities of export-oriented firms and thus increase the NPL ratio. However, it could also posi-tively affect private debtors whose loans are denominated in foreign cur-rency, reducing the NPL ratio. The sign of the relationship between NEER and the NPL ratio is thus indeterminate. However, it should be noted that the countries of the CEE regions are known for a large proportion of foreign currency loans.
bru
n
a
ška
rica
:
d
eterm
in
a
nts
of
non
-pe
r
for
mi
ng
loa
n
s
in
cen
tra
l
and
eas
tern
europ
ea
n
co
u
n
tries
financial
theor
y
and
practice
38 (1) 37-59 (2014)
44
servicing easier. However, high inflation may pass through to nominal inte-rest rates, reducing borrowers’ loan-servicing capacity or it can negatively affect borrowers’ real income when wages are sticky. It is also necessary to emphasize the short run relationship between inflation and NPLs as well. If the income does not increase in line with inflation, a rise in inflation increa-ses costs (for both households and corporates) and thus lowers the amount of available funds for debt repayment. Finally, price stability is generally considered a prerequisite for economic growth. Bearing in mind this background, the relationship between NPLs and inflation can be positive or negative. Rinaldi and Sanchis-Arellano (2006) find a positive relationship between the inflation rate and non-performing loans, while Shu (2002) re-ports a negative relation.– An increase in interest rates weakens borrowers’ debt servicing capacity, more so if loan rates are variable. Therefore, NPL is expected to be positi-vely related to interest rates.
– In the case of share prices, the direct impact on NPLs in not obvious. Beck, Jakubik and Piloiu (2013) use this variable in their examination of NPL de-terminants, assuming that share prices are correlated with housing prices, on which there are insufficient data. Empirical analysis should then reflect the notion that a drop in the value of collateral for housing loans could negati-vely affect the quality of consumer loans. At the same time, shares, while rarely used as collateral, might be correlated with other risky assets which serve as a collateral for loans.
– NPLs should increase following rapid credit growth; therefore the increase of domestic loans should be associated with higher levels of NPLs. How-ever, high loan levels could indicate high debt burdens, which make debtors more vulnerable to adverse shocks affecting their wealth or income, thereby raising the likelihood of running into debt-servicing problems.
3.3 stylizedfacts
bru
n
a
ška
rica
:
d
eterm
in
a
nts
of
non
-pe
r
for
mi
ng
loa
n
s
in
cen
tra
l
and
eas
tern
europ
ea
n
co
u
n
tries
financial
theor
y
and
practice
38 (1) 37-59 (2014)
45
Economic recovery in this country has been very slow, with persistently highunemployment rates. In 2012, however, two more countries slid back into reces-sion – Czech Republic and Hungary.
figure 2
Real GDP growth rates
15
10
5
0
-5
-10
-15
-20
07Q3 Q4 08Q1 Q2 Q3 Q4 09Q1 Q2 Q3 Q4 10Q1 Q2 Q3 Q4 11Q1 Q2 Q3 Q4 12Q1 Q2 Q3
Romania Slovakia
Bulgaria Croatia
Source: Eurostat.
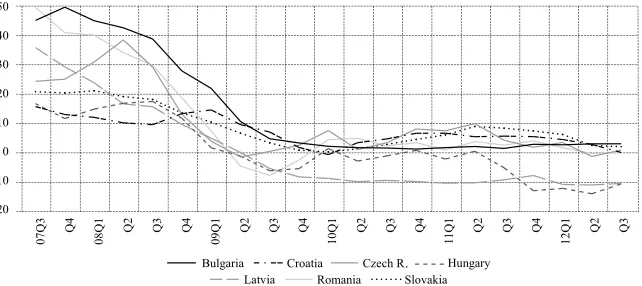
Figure 3 shows quarterly growth rates of all domestic loans, as compared to the same quarter in the previous year. A strong downwards trend in loan growth rates can be noticed in the graph for virtually all the countries of the CEE region in the period between the third quarter of 2007 and the beginning of 2009. As presented in the banking overview section of this paper, a halt in credit demand, particularly by households, is still a big problem in the countries of the region, and has been slowing down further economic recovery.
figure 3
Loans growth rates
Romania Slovakia
Bulgaria Croatia
50
40
30
20
10
0
-10
-20
07Q3 Q4 08Q1 Q2 Q3 Q4 09Q1 Q2 Q3 Q4 10Q1 Q2 Q3 Q4 11Q1 Q2 Q3 Q4 12Q1 Q2 Q3
bru
n
a
ška
rica
:
d
eterm
in
a
nts
of
non
-pe
r
for
mi
ng
loa
n
s
in
cen
tra
l
and
eas
tern
europ
ea
n
co
u
n
tries
financial
theor
y
and
practice
38 (1) 37-59 (2014)
46
Apart from the second half of 2008 and the beginning of 2009 (the start of the global recession) – especially in Romania and Bulgaria, NEER has been relatively stable in all the analyzed countries. It can be argued that NEER is not an appro-priate measure for exchange rate volatility in this analysis, and this will be further elaborated in the empirical section of the paper. Finally, inflation rates (as measu-red by Eurostat’s HICP) have been rising steadily in all CEE countries, but parti-cularly in Hungary, Romania, Bulgaria and Latvia.3.4 bankingsectoroverviewincee
The banking sector development of CEE countries has been a vital part of their overall economic growth and financial integration. As a part of the economic tran-sition, domestic banks had been sold to strategic foreign investors, who were ex-pected to import better bank governance, more modern banking practices and in-duce better supervision by home authorities. High foreign ownership is still one of the main characteristics of banking sectors throughout the region, as BIS data show that bank assets owned by foreign banks exceed 50 percent of GDP in vir-tually all countries. This translates into dominant market shares, in some places as high as 90 percent (IMF, 2013c). High foreign ownership has led to high foreign funding in the mid-2000s when foreign banks provided financing to CEE through their own subsidiaries, fueled by high global liquidity and rapid economic growth in the region (IMF, 2013c). This led to a credit boom in the region and a surge in foreign currency loans which raised concerns about the increasing systemic risks to financial stability emerging from such a large exposure of households and the corporate sector to foreign currency risks. Between 2008 and 2012, however, there was substantial deleveraging in CEE countries, where most of the outflows were the result of a reduction in loans to banks. The following section will give a brief overview of the current state of the banking system for each of the analyzed countries.
cha-bru
n
a
ška
rica
:
d
eterm
in
a
nts
of
non
-pe
r
for
mi
ng
loa
n
s
in
cen
tra
l
and
eas
tern
europ
ea
n
co
u
n
tries
financial
theor
y
and
practice
38 (1) 37-59 (2014)
47
racterized by a current halt in credit demand. The CNB states that, regardless of ‟anumber of measures taken by the CNB to encourage more favorable financing of the economy, loans granted held steady in 2012”.
The Czech banking system grew rapidly in the run-up to the global recession, but growth has been moderate since 2009. The banking sector is concentrated; the 5 largest banks control 70% of total assets, and they are wholly or majority-owned subsidiaries of big European financial conglomerates (IMF, 2012b). Unlike the other countries in the CEE region, the Czech banking sector has a conservative balance sheet, with a high share of resident deposits and loans denominated in local currency. Credit growth is fueled mainly by domestic deposits with a loans-to-deposits ratio of 70%, and only one fifth of loans are denominated in foreign currency. All of this made the Czech banking sector one of the few in the CEE region which did not need any exceptional measures during crisis. Even though, as of 2012, banks report strong capital, liquidity, and profitability, credit growth is slow and NPLs are at around 5%, which is comparable to NPL levels in advanced economies. Slovakia is very similar to the Czech Republic – its banking sector is also dominated by foreign bank subsidiaries, but the banking system’s reliance on external funding is limited, as lending is mostly financed through domestic retail deposits. NPL ratios are relatively low – around 4% in 2012, and have been decli-ning steadily after peaking in 2010 at 5.28% (IMF, 2012b).
The Hungarian banking system and overall financial stability were heavily af-fected by the global financial crisis. After a slowdown in economic activity, the Hungarian government was forced to implement some rather non-standard mea-sures to balance the budget – such as the banking tax. In this difficult landscape, banks are, naturally, scaling down their operations. Credit growth is projected to remain negative in 2013 on the back of weak household demand and banks’ limi-ted appetite to lend (IMF, 2013b). High levels of NPLs (over 16% since Q2:2012) are associated with a high level of Swiss franc-denominated loans and the weake-ning of the forint. This has prompted the Hungarian monetary authorities to under-take various ‟unorthodox” measures, compiled under the name of Funding for Growth (MNB, 2013). One part of this plan was to enable the replacement of fo-reign exchange loans with low-interest forint loans, as well as introduce a tempo-rary exchange-rate limit program. Under the program, borrowers may cap their repayments based on the exchange-rate limit for up to five years. The difference between the capped exchange-rate and the actual exchange-rate during the period is placed in a special account, the balance of which the borrowers will repay later. Nevertheless, levels of NPLs have been increasing steadily up to the third quarter of 2012. The ratio of non-performing loans to total loans is expected to peak at the end of 2013.
bru
n
a
ška
rica
:
d
eterm
in
a
nts
of
non
-pe
r
for
mi
ng
loa
n
s
in
cen
tra
l
and
eas
tern
europ
ea
n
co
u
n
tries
financial
theor
y
and
practice
38 (1) 37-59 (2014)
48
system’s balance sheet assets at the year’s close (BNB, 2012). Furthermore, in the same year the share of gross loans denominated in euro was 61.3%, where loans in levs accounted for 34.6% of the total loans. Bulgaria is also struggling with the decline of household credit demand, but in 2012 there was an increase in credit demand by the corporate sector. However, despite very high levels of NPLs, the IMF argues that ‟...macroeconomic and financial stability has been maintained in recent years” (IMF, 2012a).Despite the economic growth observed in Latvia in 2012, credit institutions’ as-sets continued to shrink, primarily because of private sector deleveraging and low lending activity (BoL, 2012). Latvia had dramatically high levels of NPLs in the period observed – for example, in 2010 NPL ratio was higher than 19%, but as of that peak in mid – 2010, the banking sector has been slowly recovering. The im-provement in the corporate loan portfolio has been more marked than the hou-sehold loan portfolio; partly because the latter was particularly hard hit by the collapse of the housing bubble (over three-fourths of household loans comprise mortgage lending). The share of NPLs is now about 11 percent for corporate lo-ans, but 16 percent for household loans.
At the end of 2012, there were 31 banks in Romanian banking system, with addi-tional 8 foreign bank branches. Two of these 31 banks had fully or majority state-owned capital, and a total of 26 banks had majority foreign capital – 81.8% of the total assets was owned by foreign banks. The top five (largest) banks held 54.7% of aggregate assets in 2012. At the end of 2012, foreign currency denominated loans still held the highest share (62.5 percent) in total loans. However, in Roma-nia the plummeting real estate prices are mentioned as the leading cause of credit portfolio quality deterioration (NBR, 2012).
bru
n
a
ška
rica
:
d
eterm
in
a
nts
of
non
-pe
r
for
mi
ng
loa
n
s
in
cen
tra
l
and
eas
tern
europ
ea
n
co
u
n
tries
financial
theor
y
and
practice
38 (1) 37-59 (2014)
49
figure 4
Non-performing loans ratio
Romania Slovakia
Bulgaria Croatia
20 18 16 14 12 10 8 6 4 2 0
07Q3 Q4 08Q1 Q2 Q3 Q4 09Q1 Q2 Q3 Q4 10Q1 Q2 Q3 Q4 11Q1 Q2 Q3 Q4 12Q1 Q2 Q3
Source: Central banks of selected countries.
4 methodology
In this study, panel data techniques are used to analyze and quantify the impact of the macroeconomic and financial variables described above on asset quality du-ring the period between the Q3:2007 and Q3:2012. The estimation technique used is a fixed effects model, which allows controlling for time-constant unobserved heterogeneity across countries. If the equation for the fixed effects model is:
yit = x'it β + αi + εit (1)
bru
n
a
ška
rica
:
d
eterm
in
a
nts
of
non
-pe
r
for
mi
ng
loa
n
s
in
cen
tra
l
and
eas
tern
europ
ea
n
co
u
n
tries
financial
theor
y
and
practice
38 (1) 37-59 (2014)
50
to use this particular estimation technique. Finally, dynamic panel methodology is not applied in this study, as Pesaran, Shin and Smith (1999) argue that in the case where T dimension in larger than N ‟traditional procedures for estimation of poo-led models produce inconsistent, and potentially very misleading estimates of the average values of the parameters in dynamic panel data models”.4.1 stationaritytesting
There is a variety of tests for unit roots or stationarity in panel datasets. The Levin, Lin and Chu (2002), Harris and Tzavalis (1999), Breitung and Das (2005), Im, Pesaran and Shin (2003), and Fisher-type (Choi, 2001) tests have as the null hypo-thesis that all the panels contain a unit root. The Hadri (2000) Lagrange multiplier (LM) test has the null hypothesis that all the panels are (trend) stationary. The assorted tests make different asymptotic assumptions regarding the number of cross-section units in the dataset and the number of time periods for each unit.
Here, the Levin-Lin-Chu test is applied to examine whether any of the series con-tain a unit root. The null hypothesis is that the series concon-tains a unit root, and the alternative is that the series is stationary. The Levin-Lin-Chu test assumes a com-mon autoregressive parameter for all panels, so it does not allow for the possibi lity that some countries’ data time series contain unit roots while other countries’ data time series do not. The Levin-Lin-Chu test requires that the number of time pe-riods grows more quickly than the section dimension, so the ratio of cross-sections to time periods tends to zero. For this reason, this particular test is well suited for datasets with a larger number of time periods than cross-sections – such as the one presented in this paper.1
The variables are defined as follows: nplgr denotes the yearly percentage changes in NPL ratio, rgdpgr is the real GDP yearly growth rate, unplgr is the yearly per-centage change in the unemployment rate, hicpgr denotes annual percentage change in inflation, neergr tracks yearly percentage change in the nominal effec-tive exchange rate, eqgr denotes the share price indices annual percentage change and loansgr are the yearly percentage changes of the quarterly levels of outstan-ding loans for each country; ir are the 3 month money market interest rates.
The Levin-Lin-Chu test decisively rejects the null hypothesis of non-stationarity, at 1 percent, for all variables, except the interest rates, which are thus excluded from further analysis.
bru
n
a
ška
rica
:
d
eterm
in
a
nts
of
non
-pe
r
for
mi
ng
loa
n
s
in
cen
tra
l
and
eas
tern
europ
ea
n
co
u
n
tries
financial
theor
y
and
practice
38 (1) 37-59 (2014)
51
table 1
Stationarity testing
Variables tstatistic pvalue
nplgr -2.3394 0.0097
unplgr -5.7601 0.0000
rgdpgr -3.8437 0.0001
neergr -5.0462 0.0000
eqgr -9.0780 0.0000
hicpgr -2.3952 0.0083
loansgr -4.4803 0.0000
ir -0.6689 0.2518
Source: Author’s calculations.
4.2 modelspecificationandresults
According to the above considerations, the following equation is estimated:
nplgri,t = β0 + β1rgpdgri,t + β2unplgri,t + β3hicpgri,t + β4neergri,t
+ β5eqgri,t + β6loansgri,t + αi + εi,t (2)
All variables are expressed as logarithmic differences of the original series in or-der to ensure data stationarity. The βs are parameters, αi is the unobserved country effect, εi,t denotes the disturbances; i and t denote cross-section and time indica-tors, respectively.
Because of the relatively short time series, this data panel is estimated with ordi-nary least squares and it includes country fixed effects, which should account for all unobserved country heterogeneity.
Estimation results broadly confirm the postulated relationships between the cho-sen explanatory variables and the NPL ratio.
The suitability of the fixed effects model can be assessed using the F-test, which is strongly justified in this case (F(6, 105) = 7.55, p-value = 0.000). Furthermore, Wooldridge test for autocorrelation in panel data shows that at 5% the null hypo-thesis of no auto-relation cannot be rejected.
bru
n
a
ška
rica
:
d
eterm
in
a
nts
of
non
-pe
r
for
mi
ng
loa
n
s
in
cen
tra
l
and
eas
tern
europ
ea
n
co
u
n
tries
financial
theor
y
and
practice
38 (1) 37-59 (2014)
52
that recent economic developments in CEE countries have a strong negative im-pact on their financial stability.table 2
Estimation results
Dependent variable: nplgr
explanatory variable Coefficient std. error tstatistic (prob.)
rgdpgr -3.970 0.636 -6.24 (0.000)
unplgr 1.006 0.129 7.82 (0.000)
hicpgr 1.657 0.868 1.91 (0.059)
neergr 0.624 0.426 1.46 (0.146)
eqgr 0.083 0.056 1.49 (0.140)
loansgr 0.128 0.326 0.39 (0.696)
cons 19.122 3.358 5.69 (0.000)
Observations 118
R-squared between = 0.33 within = 0.83
overall = 0.77
Source: Author’s calculations.
The NPL ratio growth increases following an increase in inflation rates. This esti-mate indicates that in this sample of CEE countries, inflation negatively affects banks’ asset quality. It can be concluded that the effect of higher interest rates due to inflation and the declining economic conditions usually associated with rising inflation prevails over the positive impact that inflation might have on borrowers’ debt servicing capacities. It is important to state that the central banks of the countries in the dataset all name maintaining price stability as their principal objective, as can be verified in the national laws on the said central banks (for example, Law on the Bulgarian National Bank, Article 2: ‟...the primary objective of the Bulgarian National Bank shall be to maintain price stability through ensu-ring the stability of the national currency and implementing monetary policy as provided for by this Law.”). Such an objective and the overall focus of central banks on keeping inflation low are justified by this particular result within this analysis.
bru
n
a
ška
rica
:
d
eterm
in
a
nts
of
non
-pe
r
for
mi
ng
loa
n
s
in
cen
tra
l
and
eas
tern
europ
ea
n
co
u
n
tries
financial
theor
y
and
practice
38 (1) 37-59 (2014)
53
The effect of the growth of the current level of indebtedness is statisticallyinsigni-ficant. This can be attributed to the levels of outstanding loans in the observed period. The data on loan level growth covers the time between the Q3:2007 and Q3:2012 when credit growth in the CEE countries was abruptly halted due to global liquidity shocks caused by the global financial crisis. The NPL ratio in all the countries in our sample, on the contrary, grew rapidly throughout the afore-mentioned period.
It is somewhat surprising that the coefficient on the increase of NEER is not signi-ficant. The countries of the CEE region are characterized by high level of foreign currency loans, and it is expected that the NPL ratio will react strongly to excha-nge rate volatility. Exchaexcha-nge rate depreciations are, thus, expected to lead to an increase of NPL ratio (growth rate) in countries with a high degree of lending in foreign currency to unhedged borrowers. In this analysis, the country with the highest level of foreign currency denominated loans in total loans is Latvia. How-ever, Latvia has maintained its currency board arrangement vis-à-vis the euro du-ring the crisis, so the exchange rate could not have affected NPLs significantly. On the other hand, since interest rates had to increase to defend the currency board, higher lending rates might have contributed to the large increase of NPLs in that country. Hungary and Croatia are two other countries in the sample where foreign currency lending is widespread. In both countries the depreciation of the national currency against the Swiss franc was associated with the deterioration of bank assets’ quality. However, NEER is calculated as the geometric weighted averages of bilateral exchange rates, where the most recent weights are based on trade in 2008-2010. For both countries, the largest weight is on the euro exchange rate (for Croatia 60.6% of the index, for Hungary 51.5%) – which has remained relatively stable during the crisis.
5 conclusion
The econometric analysis of the empirical determinants of NPLs presented in this paper, show that the real GDP growth was the main driver of the increase of the NPL ratio during the past 5 years in CEE countries. The coefficient of the stated explanatory variable is economically large, proving that the slowdown in the eco-nomic activity has greatly affected the financial stability of the region. High levels of NPLs across the region are a legacy of the crisis, and as economic recovery came to the countries of the region relatively late and can be described as weak, they are still expected to cause problems.
bru
n
a
ška
rica
:
d
eterm
in
a
nts
of
non
-pe
r
for
mi
ng
loa
n
s
in
cen
tra
l
and
eas
tern
europ
ea
n
co
u
n
tries
financial
theor
y
and
practice
38 (1) 37-59 (2014)
54
significantly increase inflation rates, which, as estimated, causes NPL ratios to grow. The countries of the region are, however, persistent in keeping inflation ra-tes low, which is, of course, related also to the general economic conditions in each country (high levels of both public and private foreign currency-denomi-nated debt, the obligation to respect Maastricht guidelines, etc.). Finally, it must be emphasized also that some of the countries of the region have very limited space for expansionary monetary policy. Slovakia is a member of the Eurozone, Bulgaria has a currency board arrangement, and some other counties in the sample have effectively pegged exchange rates, which limits the scope of monetary po-licy.bru
n
a
ška
rica
:
d
eterm
in
a
nts
of
non
-pe
r
for
mi
ng
loa
n
s
in
cen
tra
l
and
eas
tern
europ
ea
n
co
u
n
tries
financial
theor
y
and
practice
38 (1) 37-59 (2014)
55
appendix
table a1 Robustness tests
Dependent variable: nplgr explanatory
variable 1 2 3 4 5 6 7
rgdpgr -3.970 [0.636]*** -3.939 [0.628]*** -3.465 [0.541]*** -3.554 [0.549]*** -3.712 [0.555]*** -3.410 [0.633]*** -3.611 [0.616]***
unplgr [0.129]***1.006 [0.128]***1.009 [0.120]***1.076 [0.122]***1.047 [0.120]***0.977 [0.124]***0.961 [0.124]***0.962
hicpgr [0.868]*1.657 [0.743]**1.831 [0.704]**1.468 [0.714]**1.614 [0.831]*1.573 [0.756]1.112
neergr [0.426]0.624 [0.378]*0.699 [0.356]**0.896 [0.415]**0.872 [0.366]*0.613
eqgr [0.056]0.083 [0.050]0.074 [0.058]***0.156 [0.058]***0.166
loansgr [0.326]0.128 -0.477[0.363]
loansgr_lag [0.214]***0.697 [0.184]***0.553
cons 19.122[3.358] 18.897[3.296] 18.744[3.312] 17.221[3.323] 23.388[1.933] 17.081[3.276] 18.119[3.189]
Observations 118 118 118 118 118 118 118
R-squared within 0.83 between 0.33 overall 0.77
0.83 0.35 0.77
0.83 0.31 0.77
0.82 0.42 0.77
0.81 0.27 0.75
0.85 0.43 0.80
0.84 0.34 0.78
Standard errors are in parenthesis. * indicates 10% significance level, ** indicates 5% signifi-cance level, and *** indicates 1% signifisignifi-cance level.
Source: Author’s calculations.
bru
n
a
ška
rica
:
d
eterm
in
a
nts
of
non
-pe
r
for
mi
ng
loa
n
s
in
cen
tra
l
and
eas
tern
europ
ea
n
co
u
n
tries
financial
theor
y
and
practice
38 (1) 37-59 (2014)
56
refrences1. Arpa, M. [et al.], 2001. The influence of macroeconomic developments on Austrian banks: implications for banking supervision. BIS Papers, 1, pp. 91-116. Available at: <https://www.bis.org/publ/bppdf/bispap01.pdf#page=99>. 2. Babouček, I. and Jančar, M., 2005. Effects of macroeconomic shocks to the
quality of the aggregate loan portfolio. Czech National Bank Working Paper Series, No. 1. Available at: <http://www.cnb.cz/miranda2/export/sites/www. cnb.cz/en/research/research_publications/cnb_wp/download/cnbwp_2005_ 01.pdf>.
3. Barisitz, S., 2011. Nonperforming Loans in CESEE – What do they Comprise? Focus on European Economic Integration Q, 4, pp. 46-68.
4. Beck, R., Jakubik, P. and Piloiu, A., 2013. Non-performing loans: what mat-ters in addition to the economic cycle? ECB Working Paper Series, No. 1515. Available at: <http://www.ecb.europa.eu/pub/pdf/scpwps/ecbwp1515.pdf>. 5. Bernanke, B. and Gertler, M., 1989. Agency Costs, Net Worth, and Business
Fluctuations. The American Economic Review, 79(1), pp. 14-31.
6. Bernanke, B., Gertler, M. and Gilchrist, S., 1998. The Financial Accelerator in a Quantitative Business Cycle Framework. NBER Working Paper, No. 6455. Available at: <http://www.nber.org/papers/w6455.pdf?new_window=1>. 7. BIS, 2006. Basel II: International Convergence of Capital Measurement and
Capital Standards: A Revised Framework – Comprehensive Version. Basel: Basel Committee on Banking Supervision. Available at: <http://www.bis.org/ publ/bcbs128.pdf>.
8. BNB, 2012. Annual Report – 2012. Sofia: Bulgarian National Bank. Avail able at: <http://www.bnb.bg/bnbweb/groups/public/documents/bnb_publication/ anual_report_2012_en.pdf>.
9. BoL, 2012. Annual Report – 2012. Riga: Bank of Latvia. Available at: <http://m.bank.lv/images/stories/pielikumi/parlatvijasbanku/gada_parskati/ BoL_Annual_Report_2012.pdf>.
10. Breitung, J. and Das, S., 2005. Panel Unit Root Tests Under Cross Sectional Dependence. Statistica Neerlandica, 59(4), pp. 414-433. Doi: 10.1111/ j.1467-9574.2005.00299.x
11. Choi, I., 2001. Unit Root Tests for Panel Data. Journal of International Money and Finance, 20(2), pp. 249-272. Doi: 10.1016/S0261-5606(00)00048-6 12. CNB, 2012. Banks Bulletin, No. 25. Zagreb: Croatian National Bank.
Availa-ble at: <http://www.hnb.hr/publikac/bilten-o-bankama/ebilten-o-bankama-25. pdf>.
bru
n
a
ška
rica
:
d
eterm
in
a
nts
of
non
-pe
r
for
mi
ng
loa
n
s
in
cen
tra
l
and
eas
tern
europ
ea
n
co
u
n
tries
financial
theor
y
and
practice
38 (1) 37-59 (2014)
57
14. European Banking Coordination ‟Vienna” Initiative, 2012. Working Group onNPLs in CESEE. Available at: <http://www.imf.org/external/region/eur/ pdf/2012/030112.pdf>.
15. Gambera, M., 2000. Simple forecasts of bank loan quality in the business cycle. Emerging Issues. Available at: <http://www.chicagofed.org/digital_as-sets/publications/risk_management_papers/sr_2000_3.pdf >.
16. Green, W. H., 2004. Econometric analysis. Singapore: Pearson Education. 17. Hadri, K., 2000. Testing for Stationarity in Heterogeneous Panel Data.
Econo-metrics, Journal, 3(2), pp. 148-161. Doi: 10.1111/1368-423X.00043
18. Harris, R. D. F. and Tzavalis, E., 1999. Inference for Unit Roots in Dynamic Panels where the Time Dimension is Fixed. Journal of Econometrics, 91(2), pp. 201-226. Doi: 10.1016/S0304-4076(98)00076-1
19. Hoggarth, G., Logan, A. and Zicchino, L., 2005. Macro stress tests of UK banks. BIS papers, No. 22. Available at: <http://citeseerx.ist.psu.edu/viewdoc/ download?rep=rep1&type=pdf&doi=10.1.1.225.3146>.
20. IIF, 1999. Report of the Working Group on Loan Quality, 1999. Washington: Institute of International Finance. Available at: <www.iif.com>.
21. Im, K.S., Pesaran, M. H. and Shin, Y., 2003. Testing for Unit Roots in Hetero-genous Panels. Journal of Econometrics, 115(1), pp. 53-74. doi: 10.1016/ S0304-4076(03)00092-7
22. IMF, 2006. The Financial Soundness Indicators Compilation Guide of March 2006. Available at: <http://www.imf.org/external/pubs/ft/fsi/guide/2006/>. 23. IMF, 2012a. Bulgaria: 2013 Article IV Consultation. IMF Country Report, No.
12/328. Washington: IMF. Available at: <http://www.imf.org/external/pubs/ft/ scr/2012/cr12328.pdf>.
24. IMF, 2012b. Czech Republic: Financial System Stability Assessment Update. IMF Country Report, No. 12/177. Available at: <http://www.imf.org/external/ pubs/ft/scr/2012/cr12177.pdf>.
25. IMF, 2013a. Slovak Republic: 2013 Article IV Consultation. IMF Country Report, No. 13/262. Available at: <http://www.imf.org/external/pubs/ft/ scr/2013/cr13262.pdf>.
26. IMF, 2013b. Hungary: 2013 Article IV Consultation. IMF Country Report, No. 13/85. Available at: <http://www.imf.org/external/pubs/cat/longres. aspx?sk=40438.0>.
27. IMF, 2013c. Financing Future Growth: The Evolving Role of the Banking Sy-stems in CESEE. Available at: <http://www.imf.org/external/pubs/ft/reo/2013/ eur/eng/pdf/tn0413.pdf>.
bru
n
a
ška
rica
:
d
eterm
in
a
nts
of
non
-pe
r
for
mi
ng
loa
n
s
in
cen
tra
l
and
eas
tern
europ
ea
n
co
u
n
tries
financial
theor
y
and
practice
38 (1) 37-59 (2014)
58
29. Kiyotaki, N. and Moore, J., 1997. Credit chains. Journal of Political Economy, 105(21), pp. 211-248. doi: 10.1086/26207230. Levin, A., Lin, C. and Chu, C. J., 2002. Unit Root Tests in Panel Data: Asym-ptotic and Finite-sample Properties. Journal of Econometrics, 108(1), pp. 1-24. doi: 10.1016/S0304-4076(01)00098-7
31. Louzis, D. P., Vouldis, A. T. and Metaxas, V. L., 2011. Macroeconomic and bank-specific determinants of non-performing loans in Greece: A comparative study of mortgage, business and consumer loan portfolios. Journal of Banking & Finance, 36(4), pp. 1012–1027. Doi: 10.1016/j.jbankfin.2011.10.012 32. Majnoni, G. [et al.], 2001. Stress Testing of Financial Systems: An Overview of
Issues Methodologies and FSAP Experiences. Washington: International Mo-netary Fund.
33. MNB, 2013. Report on Financial Stability – May 2013. Budapest: Magyar Nemzeti Bank. Available at: <http://english.mnb.hu/Root/Dokumentumtar/ ENMNB/Kiadvanyok/mnben_stabil/mnben_stab_jel_201305/jelentes_pen-zugyi_stabilitas_201305_en.pdf>.
34. NBR, 2012. Annual Report – 2012. Bucharest: National Bank of Romania. Available at: <http://www.piraeusbankgroup.com/~/media/Com/Piraeus-Bank-Documents/Enimerosi-Ependiton/Etisies-Ekthesis/2012/PiraeusBank_ AR_ENG_Edit6.ashx>.
35. Nkusu, M., 2011. Nonperforming Loans and Macrofinancial Vulnerabilities in Advanced Economies. IMF Working Paper, No 11/161. Available at: <http:// www.imf.org/external/pubs/ft/wp/2011/wp11161.pdf>.
36. Pesaran, M. H., Shin, Y. and Smith, R. P., 1999. Pooled Mean Group Estima-tion of Dynamic Heterogeneous Panels. Journal of the American Statistical Association, 94(446), pp. 621-634. doi: 10.1080/01621459.1999.10474156 37. Quagliariello, M., 2003. Are Macroeconomic Indicators Useful in Predicting
Bank Loan Quality? Evidence from Italy. Bank of Italy, Paper Series, (1). 38. Rajan, R. and Dahl, S. C., 2003. Non-performing Loans and Terms of Credit
of Public Sector Banks in India: An Empirical Assessment. Reserve Bank of India Occasional Papers, 24(3), pp. 81-121. Available at: <http://rbidocs.rbi. org.in/rdocs/Publications/PDFs/60613.pdf>.
39. Rinaldi, L. and Sanchis-Arellano, A., 2006. Household Debt Sustainability: What Explains Household Non-performing Loans? An Empirical Analysis. ECB Working Paper, No. 570. Available at: <http://www.ecb.europa.eu/pub/ pdf/scpwps/ecbwp570.pdf>.
40. Salas, V. and Saurina, J., 2002. Credit risk in two institutional regimes: Spa-nish commercial and savings banks. Journal of Financial Services Research, 22(3), pp. 203-224. doi: 10.1023/A:1019781109676
bru
n
a
ška
rica
:
d
eterm
in
a
nts
of
non
-pe
r
for
mi
ng
loa
n
s
in
cen
tra
l
and
eas
tern
europ
ea
n
co
u
n
tries
financial
theor
y
and
practice
38 (1) 37-59 (2014)
59
42. Shu, C., 2002. The Impact of macroeconomic environment on the asset qualityof Hong Kong’s banking sector. Hong Kong Monetary Authority Research Memorandums.
43. Sirtaine, S. and Skamnelos, I., 2007. Credit growth in emerging Europe: a cause for stability concerns? World Bank Publications, Vol. 4281. Available at: <http://elibrary.worldbank.org/doi/book/10.1596/1813-9450-4281>.