DA
VOR
KUNOV
AC
:
ASYMMETRIC
CORRELA
TIONS
ON
THE
CROA
TIAN
EQUITY
MARKET
FINANCIAL
THEOR
Y
AND
PRACTICE
35 (1) 1-24 (201
1)
1
Asymmetric correlations
on the Croatian equity
market
DAVOR KUNOVAC* Croatian National Bank, Zagreb dkunovac@hnb.hr
Article**
JEL
:
G11,
G12 UDC:
336.7* The author would like to thank Sheri Markose and two anonymous referees for their valuable comments. ** Received: June 1, 2010
DA
VOR
KUNOV
AC
:
ASYMMETRIC
CORRELA
TIONS
ON
THE
CROA
TIAN
EQUITY
MARKET
FINANCIAL
THEOR
Y
AND
PRACTICE
35 (1) 1-24 (201
1)
2
AbstractThis paper compares the equity market in Croatia in bad (bear or turbulent) and good (bull, calm) market conditions. The two market regimes are formally identi-fi ed under the Markov Regime Switching (MRS) framework. The analysis con-ducted suggests that correlations between equity prices are more than twice as high during bear than in bull markets. This result holds both for the shares inclu-ded in the CROBEX and for the relationship among various European equity in-dices. In the context of international diversifi cation the result suggests only a limi-ted benefi t that foreign investors can count on when diversifying their portfolios by expanding to developing European markets. In addition, by evaluating a por-tfolio optimization model that takes asymmetric correlations into account in an out-of-sample exercise, this paper also illustrates the losses that may occur if the asymmetry is ignored in practice.
Keywords: portfolio optimization, Markov Regime Switching, CAPM
1INTRODUCTIONANDMOTIVATION
In fi nancial economics research, special attention is paid to the phenomenon of asymmetric correlations among equity prices (Ramchand and Susmel, 1997; Lon-gin and Solnik, 2001; Ang and Chen, 2002; Ang and Bekaert, 2004; Markose and Yang, 2008). In this context, asymmetry refers to correlation among returns varying much more during times of turbulence in the market than in periods of calm. In general, during calm periods in the capital markets the correlation among returns is low, which enables investors successfully to diversify their portfolios, depending on their attitude to risk. In contrast, turbulent times are characterised by a sudden rise in correlations, portfolio diversifi cation under such conditions beco-ming diffi cult. Recent literature primarily studies the asymmetries in the develo-ped markets and, in context of the new EU members, also some of the leading central and eastern European markets (Syriopoulos, 2004; Égert and Kočenda, 2007; Syllignakis and Kouretas, 2006). It is therefore diffi cult to fi nd any informa-tion on the asymmetric nature of the domestic equity market. For that reason this paper formally identifi es regimes in the Croatian equity market and also tries to identify their causes. Moreover it tests whether taking the regimes into account can help to optimize an equity portfolio on a daily basis in practice. In addition, the paper studies the asymmetric relations between the domestic market and the equity markets of the new and the old Europe, principally in order to derive a better insight into the level of integration of the domestic markets and developed European markets and also to analyse the potential of diversifi cation of internatio-nal portfolios by expanding onto developing markets.
DA
VOR
KUNOV
AC
:
ASYMMETRIC
CORRELA
TIONS
ON
THE
CROA
TIAN
EQUITY
MARKET
FINANCIAL
THEOR
Y
AND
PRACTICE
35 (1) 1-24 (201
1)
3
value of all future cash fl ows relating to the share (i.e. dividends), markets react tochanges in the real business cycle. For instance, if the market expects a drop in real activity in the near future, it also expects weaker business results of compa-nies in the market and consequently lower profi ts in the form of smaller dividends. Thus, the ultimate consequence of the expected real drop in retail activity is the fall in the price of shares. As a result, stock exchange indices are often good lea-ding indicators of real economic activity1. Figure 1 compares the world’s output
and world’s equity indices in the last 20 years. The fi gure suggests that while de-velopments in fi nancial markets used to lead real dede-velopments up to several quar-ters ahead, in more recent years the two sectors have become more synchronised. At the global level this relationship is relatively stable. Still it is more diffi cult to establish at the country level, which is particularly the case for a small open eco-nomy where relations with foreign countries have a major impact on domestic developments.
FIGURE 1
World’s equity prices and GDP
Note: The graph compares deviations from the long run equilibrium, i.e. the gaps for world’s real GDP and equity market index for the period 1990-2010. Gaps are extracted using the Hodrick-Prescott fil-ter and can be infil-terpreted as percentage points deviations from the trend.
Correlation between national equity markets has a strong impact on the perfor-mance of an international equity portfolio. One of the basic reasons for holding an
1 The most quoted remark in this context is due to Paul Samuelson: Wall Street indexes predicted nine out of
the last five recessions! (Samuelson, 1966).
90 -3
-30 -2
-20 -1
-10 0
0
1 10
2 20
91 92 93 94 95 96
World's equity prices (RHS) World's GDP
DA
VOR
KUNOV
AC
:
ASYMMETRIC
CORRELA
TIONS
ON
THE
CROA
TIAN
EQUITY
MARKET
FINANCIAL
THEOR
Y
AND
PRACTICE
35 (1) 1-24 (201
1)
4
international portfolio is the potential for diversifi cation. A precondition for a suc-cessful international diversifi cation is that all the shocks hitting national markets are idiosyncratic. Since during turbulent periods the correlation between the markets suddenly increases, it is not easy to materialize the potential benefi ts of diversifi cation. In order to be able to take advantage of correlation between the markets when optimizing an international portfolio it is crucial to identify the main channels of the international propagation of fi nancial shocks. For example, a consequence of the increased economic integration at the global level is that global macro shocks may simultaneously affect fi nancial markets via national channels between the fi nancial sector and the real sector. Beside that, a real shock of a country may affect the fundamentals of another country and consequently its fi nancial sector. Correlations between returns may also rise independently on the real developments, fundamentals, policy changes, etc. Correlation between equity markets may be surprisingly high, even for countries with different developments in their fundamentals and with no direct links between the markets. The kind of propagation is called contagion2. Finally, investors often prefer to monitor theaggregate market convinced it already includes all the relevant information and do not conduct their own, often costly and demanding analysis. International propa-gation of fi nancial shocks is studied in details in Calvo and Reinhart (1996), Calvo and Mendoza (2000), and Forbes and Rigobon (2002).
At the micro level, while a portfolio is being optimised, a valid identifi cation of the current market regime has a crucial impact on the performance of a portfolio. A reason for this is that expectations and variances of individual shares and corre-lations between them are important inputs when determining an optimal equity portfolio. Because the estimates of these moments may be different across the regimes, an investor will choose a non-optimal portfolio if it anticipates the wrong regime or even worse ignores the market regimes. To illustrate, the standard Markowitz Mean Variance (MV) theory of asset allocation can guarantee the op-timal allocation only presuming that actual values of the moments are known (Markowitz, 1952). Of course, this is not a case in practice and one needs to ope-rate with statistical estimates of the moments of interest. For that reason the MV methodology has often been criticized as one that delivers unusual asset allocation (Black and Litterman, 1992). The algorithm prefers shares with high estimates of expected returns and low estimates of their standard deviations. Yet these estima-tes are not stable in practice and often do not refl ect the most recent dynamics of the share of interest. For that reason the MV model allocates the wealth according to wrong inputs and therefore often yields unexpected results. Although these in-stabilities have been known for some time, the fi rst models really to take market regimes into account were developed only in the last few years.
2 Mullainathan (1998) explains the increased correlation in capital markets from the psychological point of
DA
VOR
KUNOV
AC
:
ASYMMETRIC
CORRELA
TIONS
ON
THE
CROA
TIAN
EQUITY
MARKET
FINANCIAL
THEOR
Y
AND
PRACTICE
35 (1) 1-24 (201
1)
5
Ang and Bekaert (2004) exploit asymmetric correlations within an internationalportfolio optimisation framework in the period from 1975-2000. Their analysis suggests that there exist two regimes in the world equity market. The fi rst regime is a normal regime with high returns and low volatility and second regime is cha-racterised by low returns and high volatility. In addition, they showed that asset returns are indeed more correlated under a high volatility regime. They also show that taking into consideration the existence of bull/bear (or calm/turbulent) market regimes may signifi cantly improve international portfolio performance. Markose and Yang (2008) study regimes in the UK equity market and manage to identify bull and bear regimes in the FTSE 100 index. Similarly to Ang and Bekaert (2004), their out-of-sample portfolio optimisation exercise clearly illustrates the benefi ts of recognising market regimes. In both analyses the authors assume sudden and unexpected transitions between market states. In line with that the moments of the shares, the expected returns, standard deviations and correlations between shares, are also regime dependent. Transition between the states of the market is conve-niently modelled under Markov Regime Switching framework (Hamilton, 1998; 1999; 2004), which implies the states of the market to be unobservable.
Building on the related literature, this paper studies the asymmetric correlation in the domestic equity market. In the fi rst step it studies the relationship between the Croatian market and several European markets. Results of the Markov switching model suggest that all the markets under analysis, including the Croatian, operate under one of the two regimes. The fi rst regime appears to be characterised with high expected returns and low volatility and is therefore identifi ed as bull or calm regime. On the other hand, the second regime on average exhibits negative retu-rns, followed by high volatility and is identifi ed as a bear or turbulent regime. Furthermore, the increased synchronization of the market regimes in all the coun-tries suggests an increased integration of the new and the old European councoun-tries. Croatia, the only non-member state of the EU, is not an exception in this context. In line with related literature on developed markets (Ramchand and Susmel, 1997; Longin and Solnik, 2001; Ang and Chen, 2002) this paper also fi nds that correla-tions between the markets under analysis are asymmetric. During the bad periods these correlations are more than twice as big as the good market periods. The re-sult also holds for the links between the new and the old European countries. These results are important in the context of international diversifi cation and sug-gest only a limited benefi t that foreign investors can count on when diversifying their portfolios by expanding to developing European markets.
optimiza-DA
VOR
KUNOV
AC
:
ASYMMETRIC
CORRELA
TIONS
ON
THE
CROA
TIAN
EQUITY
MARKET
FINANCIAL
THEOR
Y
AND
PRACTICE
35 (1) 1-24 (201
1)
6
tion exercise is conducted on the period 2007-2010, which suggests that taking the regimes into account can improve the performance of a standard MV model3.During the boom periods, MRS portfolios yield higher returns than a standard model. On the other hand, during the bad periods on the equity market, the stan-dard model ignores the market regimes and therefore anticipates the crisis slowly. As a consequence, it holds a large share of risky assets during the bad periods and fi nally performs poorly in our out-of-sample exercise.
In the context of the methodology used, this paper builds on the existing fra-mework with two important details. First, the model employed in this paper assu-mes that only the market index is explicitly regime-sensitive and individual shares are regime sensitive only via CAPM relations with the market index. These rela-tions are not stable on the Croatian market and therefore this paper tests whether correction for this instability improves the performances of the standard Markov switching model. The results obtained in their paper suggest that taking this insta-bility into account can signifi cantly improve the model. The second technical de-tail deals with the reliability of a Markov switching model. By using a simple Monte Carlo analysis it was shown that it is possible to replicate reliably monthly returns of CROBEX by the Markov model which is not a case for a standard nor-mal distribution.
The structure of the paper is as follows. The second section deals with the Markov Regime switching methodology. The third section studies the asymmetric correla-tion between the domestic market and its internacorrela-tional environment. The fourth section develops a portfolio optimization model that takes asymmetric correla-tions into account and shows the result of an out-of-sample exercise. The fi fth section concludes.
2 METHODOLOGY
The main results of the paper are based on an assumption that one can easily iden-tify several regimes in equity returns. For example, the identifi cation is performed by conditioning on various real or fi nancial indicators. Furthermore, one can iden-tify market regimes by assuming that the equity returns are generated from a dif-ferent statistical distribution, depending on the current market regime. The latter strategy is adopted in this paper and is usually based on Markov Regime Switching (MRS) methodology.
2.1MARKOVREGIMESWITCHINGFRAMEWORK
Unexpected, sudden breaks in time series, say in returns series yt are easily captu-red by a simple Markov switching model. Assuming that there are two states of the market/world, most often one consider bull and bear market regime, variable
3 Mean Variance models for Croatian equity market are tested in Fruk and Huljak (2004), Jakšić (2007),
DA
VOR
KUNOV
AC
:
ASYMMETRIC
CORRELA
TIONS
ON
THE
CROA
TIAN
EQUITY
MARKET
FINANCIAL
THEOR
Y
AND
PRACTICE
35 (1) 1-24 (201
1)
7
of interest is assumed to be drawn from one of the two Gaussian distributions,depending on the state of the market St:
(1)
or equivalently, in regression form:
where St denotes the current state of the market, εt denotes standard normal white noise and µi and σi parameters to be estimated. State variable St is unobservable and it is conveniently assumed that it obeys a discrete Markov process on the state space S = {bull, bear} = {1, 2}. In that case, the transition probabilities of the process are characterized by two properties:
(2)
(3) and transition probabilities form a matrix to be estimated:
.
In our context, the fi rst property ensures that transition probabilities between bull and bear market periods are constant over time, while the second one implies that the market regime for the following period depends only on the current regime.
2.1.1 Parameter estimation
Before proceeding to the optimisation step we need to resolve the parameter esti-mation problem fi rst. The set of parameters θ = (µ1,µ2, σ1, σ2, p11, p22) to be estimated consists of expectations and standard deviations for two regimes (µ1,µ2, σ1, σ2) and probabilities (p11 and p22) for the market to stay in the current state. The regime process {St} is unobservable and, therefore, the likelihood function (i.e. the joint density function for the market process {yt}) needs to be evaluated in a series of steps.
The log-likelihood function is:
where It–1 = {y1,..., yt–1} denotes the investor’s information set available at time t–1 and conditional normal densities f(yt | st , It–1) = f(yt | st ) are known from (1). In order to complete the likelihood function we need to calculate the f (St, | It–1) = P(St = st | y1,...,yt-1) iteratively using the Hamilton’s fi lter(see Hamilton, 1989; 1994):
θ;
DA
VOR
KUNOV
AC
:
ASYMMETRIC
CORRELA
TIONS
ON
THE
CROA
TIAN
EQUITY
MARKET
FINANCIAL
THEOR
Y
AND
PRACTICE
35 (1) 1-24 (201
1)
8
(4)(5)
In order to obtain the vector of estimates θ which is the most consistent with the observed data, we need to maximise ln L(θ; y1,..., yT) using numerical optimisa-tion4. The fi ltered probabilities P(S
t = i | It ) can be estimated recursively from (5)
given appropriate initial values (see Hamilton, 1994) and vector θ. These probabi-lities refl ect investor’s inference of the current world market regime given the observed world market return up to time t. In addition, one can also estimate ex-post inference, i.e. the smoothed probabilities P(St = i | y1,...,yT ) given full sample. The algorithm for calculating these ex-post probabilities can be found in Kim (1994), and Hamilton (1994). By construction, it is clear that fi ltered probability equals the smoothed probability for the last observation in our sample. The fra-mework can be easily extended to more general Markov chains.
3 ASYMMETRICCORRELATIONONEQUITYMARKETSINEUROPE
This section studies the asymmetry on the Croatian equity markets and on several European equity markets of interest. New member states of the EU are represen-ted by Czech Republic, Romania and Bulgaria while the old Europe is represenrepresen-ted by Germany. For comparison purposes, the aggregate equity indices of a group of the Central and Eastern European Countries (CEEC), the EU market and overall world equity market are also considered. The analysis is conducted in two steps. First, for each equity index under analysis the two market regimes are identifi ed by employing the Markov Regime Switching framework. After that, the correla-tion between markets is calculated for each of the identifi ed regimes. All the cal-culation is conducted with the use of monthly data for the period 2001-2009. Data source is Bloomberg5.
4Alternatively, parameters can be estimated via EM algorithm as shown in Hamilton (1990).
5 For the purpose of the analysis the following equity indices are used: CROBEX (Croatia), PX (Czech
DA
VOR
KUNOV
AC
:
ASYMMETRIC
CORRELA
TIONS
ON
THE
CROA
TIAN
EQUITY
MARKET
FINANCIAL
THEOR
Y
AND
PRACTICE
35 (1) 1-24 (201
1)
9
3.1REGIMESONEUROPEANMARKETS
Table 1 reports expected nominal returns and standard deviations across identifi ed Markov regimes for eight markets under analysis.
TABLE 1
Basic statistics for market regimes
CRO CZ ROM BU CEEC GER EU World
Expected return (%)
Full sample -0.80 -0.80 -1.50 -1.80 -0.90 -0.6 -0.4 -0.3
Bull regime
(µ1) -2.00 -2.30 -3.90 -4.20 -1.30 -1.8 -1.6 -1.1
Bear regime
(µ1) -1.00 -1.30 -8.80 -2.80 -2.70 -2.3 -0.4 -0.8
Standard deviation (%)
Full sample -7.50 -6.60 -9.50 -9.50 -7.20 -5.8 -5.2 -4.3
Bull regime
(σ1) -4.60 -4.00 -7.50 -5.80 -6.10 -3.5 -2.6 -2.3
Bear regime
(σ1) 10.40 -7.50 10.10 13.00 13.60 -6.9 -6.1 -5.5
P -0.98 0.96 -0.99 -0.98 -0.99 -0.96 -0.96 -0.97
Q -0.97 0.97 -0.91 -0.97 -0.89 -0.90 -0.97 -0.95
Note: CRO (Croatia), CZ (Czech Republic), ROM (Romania), BU (Bulgaria), GER (Germany).
The reported results suggest that the equity markets of interest operate under one of the two states of the world, i.e. regimes, characterized by negatively-related expected returns and standard deviations. The fi rst regime appears to be characte-rised by high expected returns and low volatility and is therefore identifi ed as bull or calm regime. On the other hand, the second regime on average exhibits negati-ve returns, followed by high volatility and is identifi ed as a bear or turbulent regi-me. The probability for the market to stay in the current state/regime (parameters P and Q) is close to unity for both regimes which is a property that suggests a high persistence of the estimated regimes in past years.
DA
VOR
KUNOV
AC
:
ASYMMETRIC
CORRELA
TIONS
ON
THE
CROA
TIAN
EQUITY
MARKET
FINANCIAL
THEOR
Y
AND
PRACTICE
35 (1) 1-24 (201
1)
10
By comparing market regimes across the markets of interest one can illustrate the integration dynamics of international equity markets. Figure 2 therefore shows the ex-post probability for different markets to be in a bear/turbulent regime during the last ten years. The fi rst part of the period is largely characterized by still unde-veloped fi nancial markets of central and eastern Europe and also their weak inte-gration into international markets as well as the poor general economic linkages with international environment. As a consequence, an increased (or decreased) volatility in transition countries is primarily a consequence of domestic fi nancial and economic developments and to much less extent of some external activities. On the other hand, during the past several years, the links with developed markets have strengthened dramatically. A direct consequence of the increased integration is that the market regimes have become more synchronized.
FIGURE 2
Ex-post probabilities for various markets to be in the bear regime
0.0 0.4 0.8 1.2
World Czech Rep. Germany Croatia EU
Probability of the turbulent regime CROBEX (MoM) 30
1.2
0.8
0.4
0.0 20
10
0
-10
-20
-30
Probability
%
FIGURE 3
Nominal monthly returns on CROBEX together with ex-post probabilities of being in a turbulent (bear) regime
00 01 02 03 04 05 06 07 08 09
DA
VOR
KUNOV
AC
:
ASYMMETRIC
CORRELA
TIONS
ON
THE
CROA
TIAN
EQUITY
MARKET
FINANCIAL
THEOR
Y
AND
PRACTICE
35 (1) 1-24 (201
1)
11
Figure 3 shows the ex-post probability for the Croatian equity market to operateunder a turbulent regime. Markov switching methodology identifi ed two turbulent regimes on that period. The estimated turbulent periods however have very diffe-rent causes. The fi rst crisis from 1997-1999 coincides with domestic recession triggered by the turbulences in the domestic banking sector. In contrast to that, the recent global recession caused by the problems of the international banking sector, has spilled over onto fi nancial markets worldwide.
3.2ASYMMETRICCORRELATIONINEUROPEANEQUITYMARKET
This section compares correlations of the nominal monthly returns among several European equity indices for two identifi ed regimes – the bull and the bear market regime. Every market is considered to operate under a bull regime if ex post pro-bability for the EU market to be in the bull state is larger than 0.5, i.e.
We indicate a bear regime in a similar way. Due to a high co-movement between European equity markets, the state of the market in the EU really is a valid indicator for market conditions in other European coun-tries under analysis (see fi gure 2).
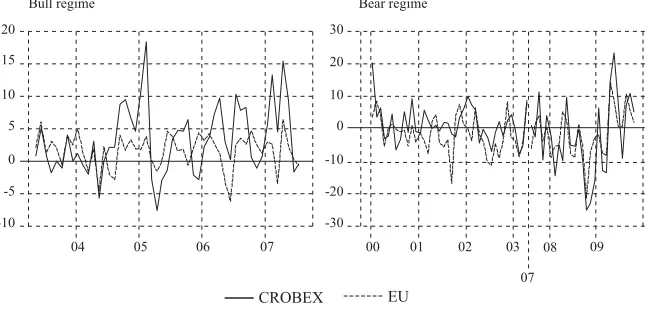
FIGURE 4
Monthly returns on the CROBEX together with returns on the aggregate EU index for two identifi ed regimes
-10 -30
04
Bull regime Bear regime
00
05 06 01 03
07 02
07 08 09
-5 -20
0 -10
5 0
10 10
15 20
20 30
CROBEX EU
In order to illustrate the asymmetric correlation among European markets fi gure 4 compares co-movement between returns of Croatian CROBEX and aggregate EU market for two identifi ed regimes. The fi gure illustrates much tighter links between the two markets during the turbulent periods compared to the calm market periods.
DA
VOR
KUNOV
AC
:
ASYMMETRIC
CORRELA
TIONS
ON
THE
CROA
TIAN
EQUITY
MARKET
FINANCIAL
THEOR
Y
AND
PRACTICE
35 (1) 1-24 (201
1)
12
among the markets of interest is established for all the markets, both developed and transitional. The reported results therefore suggest the only limited benefi t that foreign investors can count on when diversifying their portfolios by expan-ding to developing European markets.TABLE 2
Asymmetric correlations
BU CEEC CRO CZ ROM GER EU
BU 1.00 0.55 0.61 0.62 0.58 0.35 0.42
CEEC 0.30 1.00 0.62 0.89 0.64 0.76 0.83
CRO 0.04 0.27 1.00 0.58 0.59 0.57 0.63
CZ 0.18 0.86 0.29 1.00 0.72 0.71 0.77
ROM 0.18 0.43 0.34 0.45 1.00 0.36 0.47
GER 0.05 0.44 0.28 0.48 0.15 1.00 0.96
EU 0.07 0.57 0.38 0.66 0.30 0.92 1.00
Note: Turbulent (above the diagonal), calm (under).
BU (Bulgaria), CRO (Croatia), CZ (Czech Republic), ROM (Romania), GER (Germany).
4 ASYMMETRICCORRELATIONINTHECROATIAN EQUITYMARKET This section studies asymmetric correlations in the Croatian equity market. Mo-reover, a portfolio optimization model that incorporates the asymmetric nature of the market is introduced and fi nally, by using this model, we illustrate potential losses that may arise if an investor ignores identifi ed asymmetries.
4.1PORTFOLIOOPTIMIZATIONUNDERANASYMMETRICCORRELATION
Let us consider an investor who allocates his wealth in N different stocks. At each period the investor is able to conveniently borrow and lend at his home risk-free rate. Asset allocation is based on the standard mean-variance portfolio optimisa-tion framework. Furthermore, our investor is aware of the existence of bull/bear market regimes and estimates the inputs for his optimisation algorithm conditio-nally on his beliefs for the current period regime (provided by the econometri-cian). Let us formalise the story.
Assume that market returns may be drawn from one of the two different Gaussian distributions, conditionally on the current market regime.
(6)
DA
VOR
KUNOV
AC
:
ASYMMETRIC
CORRELA
TIONS
ON
THE
CROA
TIAN
EQUITY
MARKET
FINANCIAL
THEOR
Y
AND
PRACTICE
35 (1) 1-24 (201
1)
13
where denotes excess return of the market, market St takes on the states 1 or 2 (bull or bear), εt denotes standard white noise and µi and σi regime parameters to be estimated.
As in Markose and Yang (2008), for each share (i = 1, 2,..., N) under consideration we link its (excess) returns and markets excess return via CAPM-ba-sed regressions:
(7)
and, implicitly, individual shares are now also sensitive to changes in regime in the aggregate market. Expected returns for each share are now:
(8)
and variances:
(9)
where denote systematic – market variance and idiosyncratic variance of asset i.
Our investor optimises his portfolio each month using Markowitz’s mean-varian-ce framework and, therefore, needs to supply his algorithm with the varianmean-varian-ce-co- variance-co-variance matrix of risky assets as well with individual expected returns. These moments now depend on the current world’s market regime via (7) and (8) and therefore whole-sample moment statistics would be inappropriate inputs for the optimisation. Suppose however that the investor knows the current market regime (at time t). Let us further assume that he can also estimate the probability for the market to stay in either of the two regimes, as well the probability for market to change regimes. Now, he can easily estimate next period conditional moments, both for the world market and individual country returns as follows.
The market expected return at t+1 given the current market regime is estimated as:
and conditional variances are:
DA
VOR
KUNOV
AC
:
ASYMMETRIC
CORRELA
TIONS
ON
THE
CROA
TIAN
EQUITY
MARKET
FINANCIAL
THEOR
Y
AND
PRACTICE
35 (1) 1-24 (201
1)
14
The moments for individual country returns may be estimated in the following way. First, from (7) for each country we have:
and let and be the vectors of estimated
coeffi cients.
Now we can stack individual country expectations into a vector:
Conditional expectations for the following period are now:
Conditional (regime-dependant) covariance matrix is:
where Finally, conditional covariance matrix for the period
t +1 is:
For details see Markose and Yang (2008), and Ang and Bekaert (2004).
4.2RESULTS
DA
VOR
KUNOV
AC
:
ASYMMETRIC
CORRELA
TIONS
ON
THE
CROA
TIAN
EQUITY
MARKET
FINANCIAL
THEOR
Y
AND
PRACTICE
35 (1) 1-24 (201
1)
15
but only to highlight the costs of ignoring regimes in the equity markets,indepen-dent of the investment strategy.
The selection of the shares included in the analysis was based on two criteria. First, in order to diversify possible sectoral risks, only shares from different sectors of the economy are considered. After that it was necessary for a share to have available price data for a suffi ciently long period, from 2001-2010.
One year Treasury bills are used as a risk free security in the analysis.
4.2.1 Regimes in the Croatian equity market and asymmetric correlations The model assumes the returns on the market index to be drawn from one of the two Gaussian distributions, depending on the current market regime. Table 3 shows basic statistics of the market return for two regimes identifi ed via Markov switching framework.
TABLE 3
The estimated parameters
Calm (regime I) Turbulent (regime II)
µ1 σ1 P µ2 σ2 Q
Estimate 1.75 4.81 0.99 -4.06 10.93 0.94
Std. error 0.52 0.20 0.12 2.10 1.10 0.30
The bull (the calm) regime is characterized by monthly return of 1.75% and a stan-dard deviation of 4.81%, while the bear (the turbulent) regime is characterized by a monthly loss of 4.06% followed by a standard deviation of 10.93%. Expected retu-rns, standard deviations and co-variances of individual shares are implicitly depen-dant on the current market regime via CAPM relations to the market (6). Table 4 compares correlations among individual shares across the identifi ed regimes.
TABLE 4
Asymmetric correlations
PBZ DLKV ATPL
PBZ 1.00 0.69 0.55
DLKV 0.30 1.00 0.53
ATPL 0.20 0.18 1.00
DA
VOR
KUNOV
AC
:
ASYMMETRIC
CORRELA
TIONS
ON
THE
CROA
TIAN
EQUITY
MARKET
FINANCIAL
THEOR
Y
AND
PRACTICE
35 (1) 1-24 (201
1)
16
For all the pairs of shares we found signifi cant differences in correlations among the market regimes. During the falling, turbulent market periods, the links between returns appear to be over two times stronger compared to the rising markets. Taking into account that correlation among shares is an important input for a por-tfolio optimization algorithm, a procedure that ignores the regimes on the market can be expected to perform poorly in practice.In order to get more insight into correlation dynamics between shares over time fi gure 5 shows time dependent correlations for the pair PBZ and Dalekovod. The fi gure illustrates the tighter links between shares during the bad market periods.
FIGURE 5
Dynamic correlations between Dalekovod and PBZ equity markets for two regimes
07/M07 0.0
0.2 0.4 0.6 0.8 1.0
08/M01 08/M07 09/M01 09/M07 10/M01
Note: For period t if P(St = i | It ) > 0.5 the correlation under regime i is reported. Calm Turbulent
Only implicitly via the CAPM are individual shares also regime sensitive. When modelling asymmetric correlations on the world market and the UK equity market, Ang and Bekaert (2004), and Markose and Yang (2008) assume stable CAPM relations over time. However, Kunovac (2009) shows that these relations are not stable over time and that taking these instabilities into account when building a Markov switching portfolio model can signifi cantly improve performances of the model in practice. For that reason, as well as the static CAPM equations we also test a model that uses coeffi cients calculated on a moving window of 48 months. In other words, at time t relation rit = αti + βti mt + εit is estimated where parameters
DA VOR KUNOV AC : ASYMMETRIC CORRELA TIONS ON THE CROA TIAN EQUITY MARKET FINANCIAL THEOR Y AND PRACTICE
35 (1) 1-24 (201
1)
17
TABLE 5
CAPM coeffi cients
PBZ DLKV ATPL
α 1.22 1.14 3.21
Std. error 0.61 0.72 1.50
β 1.14 1.20 1.46
Std. error 0.09 0.10 0.22
Table 5 compares the estimates of the CAPM coeffi cients for three shares on the whole sample. For all the shares under analysis the estimates of the α are larger than zero, but only marginally signifi cant. On the other hand, the β coeffi cients are estimated as larger than unity. This suggests that all the shares yield returns that are higher than the market during the good periods and returns lower than CRO-BEX during the bad market periods.
FIGURE 6
Static and moving window estimates of CAPM betas
1.0 0.9
05
full sample beta: 1.43
full sample beta: 1.13
full sample beta: 1.23
05 05 06 06 06 06 06 06 07 07 07 07 07 07 08 08 08 08 08 08 09 09 09 09 09 09 10 10 10 Atlantska plovidba PBZ Dalekovod 1.2 1.0 0.9 1.4 1.1 1.0 1.6 1.2 1.1 1.8 1.3 1.2 2.0 1.4 1.3 2.2 1.5 1.6 1.4
Note: Moving window estimates consider 48 month windows.
DA
VOR
KUNOV
AC
:
ASYMMETRIC
CORRELA
TIONS
ON
THE
CROA
TIAN
EQUITY
MARKET
FINANCIAL
THEOR
Y
AND
PRACTICE
35 (1) 1-24 (201
1)
18
Figure 6 compares moving β coeffi cients with static coeffi cients. The fi gure sug-gest that the CAPM relations for the Croatian equity market are not stable over time and therefore static estimates can provide only a rough estimate of the link between individual share and the market. A direct consequence of this instability is the instability of the main inputs of the portfolio optimization algorithm – ex-pected returns, standard deviations and correlations between shares. In order to estimate how costly it is to ignore this instability in practice, we implement both static and dynamic CAPM-based mean variance models.4.2.2 How good is our Markov-Switching model for CROBEX? Evidence from Monte Carlo experiment
Here we discuss the reliability of the estimated Markov switching models. It ap-pears that very few papers provide any evidence that the estimated MS model fi ts the data properly. On the other hand, it has been well documented that the maximi-sation of likelihood function in this context is not an easy task (Hamilton, 1994). Parameter spaces involved in the estimation are usually of large dimensions and there is no guarantee that the estimated parameters indeed maximise (generally not concave) the likelihood function globally. The main question is how we can be sure that the estimated parameters defi ne distribution which is close enough to (empiri-cal) distribution of actual, observed data, in our case to returns on CROBEX.
FIGURE 7
Densities implied by actual data on CROBEX and estimated two-regime Markov regime switching models
-40
0.00 0.00
0.01 0.01
0.02 0.02
0.03 0.03
0.04 0.04
0.05 0.05
0.06 0.06
-40
-20 0 20 40 -20 0 20 40
CROBEX Regime switching
CROBEX Gauss (no regime)
Note: For comparison purposes the figure also shows the density implied by the Gaussian dis-tribution.
DA
VOR
KUNOV
AC
:
ASYMMETRIC
CORRELA
TIONS
ON
THE
CROA
TIAN
EQUITY
MARKET
FINANCIAL
THEOR
Y
AND
PRACTICE
35 (1) 1-24 (201
1)
19
CROBEX. The test only involves a graphical comparison of two densityfunc-tions6. The fi rst is the density estimated from observed return data and the second is
the density of simulated (Monte Carlo) draws from return distribution(s) based on the maximum likelihood parameters (i.e. on the vector, θ = (µ1, µ2, σ1, σ2, p11, p22)). Although very simple, this method provides a powerful tool as a goodness-of-fi t indicator.
In the fi rst step I simulate a Markov chain via a Monte Carlo given estimated tran-sition probabilities. Market return is defi ned conditionally on the realisation of the simulated regime process and can be easily drawn from appropriate normal density. In this way I simulate 100.000 draws implied by the estimated MS model and construct an approximate density function. Now comparing this density7 to the
density calculated directly from the series of the observed market return one can make an inference on the reliability of the MS model, i.e. of the reliability of esti-mated parameters.
Figure 7 compares the density implied by the estimated Markov switching model and that estimated from the observed data on CROBEX. For comparison purpo-ses, the Gaussian density is also plotted. The fi gure suggests that the Markov switching model mimics the observed data much more accurately than the Gaus-sian density. Although the estimated models based on the two regime market mi-mic the observed data fairly well, this model is not capable of capturing extreme returns from the tails of the distribution. However this model is easily expanded to a three regime case, which is a model that easily captures the issue (Kunovac, 2009).
4.2.3 Asset allocation under regime switching
This section studies the benefi ts of taking the market regimes into account when optimizing an equity portfolio. In an out-of-sample exercise, performance of a standard mean variance model is compared to a Markov switching model that takes the asymmetric correlations into account. On the out-of-sample period, from March 2007 – March 2010, we compare the cumulative return on 1 monetary unit invested over the out-of-sample period to the cumulative return on 1 monetary unit invested under the standard mean-variance model that ignores regimes in equity markets. At each period the investor is able conveniently to borrow and lend at his home risk-free rate (1 year Treasury bills). In addition, there are short-selling constraints imposed, i.e. all the weights in the portfolio need to be non-negative. The model is evaluated in an out-of-sample as follows.
1) At time t estimate θ = (µ1, µ2, σ1, σ2, p11, p22) using the information available up to t and make an inference about the current regime for CROBEX using the
6 Probability density functions are approximated using kernel density estimation techniques (see Li and
Rac-ine, 2007).
DA
VOR
KUNOV
AC
:
ASYMMETRIC
CORRELA
TIONS
ON
THE
CROA
TIAN
EQUITY
MARKET
FINANCIAL
THEOR
Y
AND
PRACTICE
35 (1) 1-24 (201
1)
20
fi ltered probabilities. If P(St = i | It )>0.5 for some i, the market is considered to be in state i at the moment.2) Calculate conditional moments for CROBEX for the following period. 3) Estimate CAPM equations for individual shares and calculate
regime-depen-dent moments for each share for the following period. Regression coeffi cients are estimated in two different ways. Firstly, using only in-sample period data, and secondly, using the moving window regression on the period t – 48:t. 4) Given the risk aversion (3 was chosen arbitrarily here) optimise the portfolio. 5) Add another observation and go to step 1 (unless the sample is exhausted; in
that case the procedure is over).
Figure 8 compares cumulative returns on one monetary unit implied by the three mean variance models – the fi rst one is a standard MV model that ignores the market regimes and two Markov switching models.
FIGURE 8
The cumulative return on one monetary unit invested over the out-of-sample period under three strategies
07/M07 0.6
0.8 1.0 1.2 1.4 1.6 1.8 2.0
08/M01 08/M07 09/M01 09/M07 10/M01
RS model (dynamic CAPM) RS model (static CAPM) Mean variance, no RS
The fi rst MS model is static and envisages a stable relationship between individual shares and the CROBEX, while the second model takes the instability of the CAPM into account. At the very beginning of the period under analysis, Markov switching strategies based on the bull parameters outperform the standard model signifi ca-ntly. This is mainly due to a more aggressive investing strategy where, according to MS models, in good market periods, investors are even willing to borrow at a
DA
VOR
KUNOV
AC
:
ASYMMETRIC
CORRELA
TIONS
ON
THE
CROA
TIAN
EQUITY
MARKET
FINANCIAL
THEOR
Y
AND
PRACTICE
35 (1) 1-24 (201
1)
21
risk free rate in order to reinvest in risky assets. On the other hand, during the badmarket periods, the MS models were able to anticipate the crisis and accordingly the investment was based on a different set of parameters. From the mid 2008 re-gime, switching models therefore follow a conservative strategy and invest exclu-sively in the risk free asset and therefore grow at the T bill rate. In contrast to that the standard MV model allocated the wealth according to an averaged set of para-meters and therefore did not respond accurately to the crisis. As a consequence, during the recent crisis, the standard model held a large share of risky assets in its portfolio (over 30% on average) and therefore performed poorly.
Furthermore, our results suggest that the instability of the CAPM relations should be taken into account when building a MV model. Our dynamic model, based on fresh information, enables one to estimate a more accurate link between indivi-dual shares and the market, which might result in more accurate inputs for a por-tfolio optimization algorithm. A static Markov regime switching model did not outperform a standard MV model.
5CONCLUSION
This paper studies the differences on the equity market in Croatia during bad and good market periods. In order to get a better insight into propagation mechanism of fi nancial distress, links between the domestic market and several European markets are fi rst studied in more detail. After that, the paper deals with the rela-tionships among the shares included in CROBEX. The main fi ndings of the paper may be summarised as follows.
Results of the analysis suggest that all the equity markets under analysis, inclu-ding Croatia, operate under one of the two states of the world, i.e regimes, cha-racterized by negatively related expected returns and standard deviations. The fi rst regime appears to be characterised by high expected returns and low volatility and is therefore identifi ed as a bull or calm regime. On the other hand, the second re-gime on average exhibits negative returns, followed by high volatility and is iden-tifi ed as a bear or turbulent regime. In addition, the increased synchronization of the market regimes in all the countries suggests the increased integration of the new and the old European countries. Croatia, the only non-EU member state, is not an exception in this context. Tight links between the markets are primarily a direct consequence of the broader economic integration process.
DA
VOR
KUNOV
AC
:
ASYMMETRIC
CORRELA
TIONS
ON
THE
CROA
TIAN
EQUITY
MARKET
FINANCIAL
THEOR
Y
AND
PRACTICE
35 (1) 1-24 (201
1)
22
A special attention is paid to the identifi cation of the market regimes and testing the asymmetric correlations in Croatia. Moreover, a portfolio optimization model that incorporates the asymmetric nature of the market is introduced and fi nally, by using this model we illustrate potential losses that may arise if an investor ignores identifi ed asymmetries. For all the pairs of shares, signifi cant differences in corre-lations are found across the regimes. During the bad periods the links between the shares are more than twice as strong as in the good market periods. Since correla-tion between shares is an important input for a portfolio optimizacorrela-tion algorithm, procedures that ignore the regimes on the market expectedly perform poorly in practice. In order to test this for the Croatian equity market, a simple out-of-sam-ple portfolio optimization exercise is conducted where the performance of a stan-dard mean variance model is compared to the results of a Markov switching ver-sion of a model. An important difference of the two models is that Markov switching model takes the asymmetry of the market into account. The results of the exercise suggest that a good model should take the asymmetric correlations into account in practice. During good periods, Markov switching portfolios, based on bull market inputs, outperform the standard model signifi cantly. Similarly, du-ring bad periods on the equity market, the standard model ignores the market re-gimes and therefore anticipates the crisis slowly. As a consequence, it holds a large share of risky assets during bad periods and fi nally performs poorly.
In the context of the methodology used, this paper builds on the existing fra-mework with two important details. First, the model employed in this paper assu-mes that only the market index is explicitly regime sensitive and individual shares are regime sensitive only via CAPM relations with the market index. These rela-tions are not stable on the Croatian market and therefore this paper tests whether correction for this instability improves the performances of the standard Markov switching model. The results obtained in their paper suggest that taking this insta-bility into account can signifi cantly improve the model. The second technical de-tail deals with the reliability of a Markov switching model. By using a simple Monte Carlo analysis it was shown that it is possible to replicate reliably monthly returns of CROBEX by a Markov model, which is not the case for a standard normal distribution.
DA
VOR
KUNOV
AC
:
ASYMMETRIC
CORRELA
TIONS
ON
THE
CROA
TIAN
EQUITY
MARKET
FINANCIAL
THEOR
Y
AND
PRACTICE
35 (1) 1-24 (201
1
)
23
LITERATURE
Ang, A. and Bekaert, G., 2004. “How do regimes affect asset allocation”. Finan-cial Analysts Journal, 60, 86-99.
Ang, A. and Chen, J., 2002. “Asymmetric correlations of equity portfolios”. Journal of Financial Economics, 63 (3), 443-494.
Black, F. and Litterman, R., 1992. “Global Portfolio Optimization”. Financial Analysts Journal, 48 (5), 28-43.
Breunig, R. V. and Pagan, A. R., 2004. “Do Markov-switching models capture nonlinearities in the data?: Tests using nonparametric methods”. Mathematics and Computers in Simulation, 64 (3-4), 401-407.
Calvo, G. A. and Mendoza, E. G., 2000. “Rational contagion and the globaliza-tion of securities markets”. Journal of International Economics, 51 (1), 79-113.
Calvo, S. and Reinhart, C., 1996. “Capital fl ows to Latin America: Is there evi-dence of contagion effects?” Policy Research Working Paper Series, No. 1619. Washington: The World Bank.
Égert, B. and Kočenda, E., 2007. “Time-Varying Co-movements in Developed and Emerging European Stock Markets: Evidence from Intraday Data” [onli-ne]. William Davidson Institute Working Papers Series, WP861. Available from: [http://home.cerge-ei.cz/kocenda/papers/BiARCHStock.pdf ].
Forbes, K. J. and Rigobon, R., 2002. “No Contagion, Only Interdependence: Measuring Stock Market Co-movements”. Journal of Finance, 57 (5), 2223-2261.
Fruk, M. and Huljak, I., 2004. “Testiranje Sharpe-Lintnerovog modela na Zagrebačkoj burzi”[online]. Financial Theory and Practice, 28 (1), 77-91.
Hamilton, J. D., 1989. “New Approach to the Economic Analysis of Nonstatio-nary Time Series and the Business Cycle”. Econometrica, 57 (2), 357-384.
Hamilton, J. D., 1990. “Analysis of time series subject to changes in regime”. Journal of Econometrics, 45 (1-2), 39-70.
Hamilton, J. D., 1994. Time Series Analysis. Princeton: Princeton University Press.
Jakšić, S., 2007.“Primjena Markowitzeve teorije na tržište dionica Zagrebačke burze”. Zbornik Ekonomskog fakulteta u Zagrebu, 5 (1), 331-344.
Kim, C.-J., 1994.“Dynamic linear models with Markov-switching”. Journal of Econometrics, 60 (1-2), 1-22.
Kunovac, D., 2009.International Asset Allocation under Regime Switching, Uni-versity of Essex mimeo.
Latković, M. and Boršić, D., 2000. “Rizik nelikvidnosti aktivno i pasivno upra-vljanih dioničkih portfelja”. Računovodstvo i fi nancije, 46 (6), 18-22.
Latković, M., 2000. “Internacionalna diverzifi kacija portfelja za hrvatsko tržište kapitala” [online]. Hrvatska gospodarska revija. Available from: [http://www. phy.hr/~laci/art/int-div.pdf].
DA
VOR
KUNOV
AC
:
ASYMMETRIC
CORRELA
TIONS
ON
THE
CROA
TIAN
EQUITY
MARKET
FINANCIAL
THEOR
Y
AND
PRACTICE
35 (1) 1-24 (201
1)
24
Li, Q. and Racine, J. S., 2007.Nonparametric Econometrics: Theory and Prac-tice. Princeton: Princeton University Press.Limić, N., 2005. Monte Carlo simulacije slučajnih veličina, nizova i procesa. Zagreb: Element.
Lintner, J., 1965. “Security prices, risk and maximal gains from diversifi cation”. Journal of Finance, 20, 587-616.
Longin, F. and Solnik, B., 2001. “Correlation Structure of International Equity Market During Extremely Volatile Periods”. Journal of Finance, 56 (2), 649-676.
Markose, S. M and Yang, J., 2008. Optimal Portfolio Selection with Dynamic Regime Switching Weights. Mimeo, University of Essex.
Markowitz, H. M., 1952. “Portfolio Selection”. The Journal of Finance, 7 (1), 77-91.
Mullainathan, S., 1998. A memory based model of bounded rationality. Cambri-dge: MIT.
Ramchand, L. and Susmel, R., 1998. “Volatility and cross correlation across major stock markets”. Journal of Empirical Finance, 5 (4), 397-416.
Samuelson, P.,1966. “Science and Stocks”. Newsweek, September 19.
Sharpe, W. F., 1964.“Capital asset prices: A theory of market equilibrium under conditions of risk”. Journal of Finance, 19 (3), 425-442.
Syllignakis, M. and Kouretas, G., 2006. “Long and Short-Run Linkages in CEE Stock Markets: Implications for Portfolio Diversifi cation and Stock Market Integration”. William Davidson Institute Working Papers Series, WP832.