T E C H N I C A L N O T E
Open Access
Method development for the quantitative
determination of short chain fatty acids in
microbial samples by solid phase extraction
and gas chromatography with flame
ionization detection
Hayoung Kim
1, Joseph Kwon
2, So Young Choi
3and Yun Gyong Ahn
1*Abstract
Background:In order to quantitatively measure short chain fatty acids (SCFAs) in microbial samples, sample preparation and analytical conditions using gas chromatography with flame ionization detection (GC-FID) were established.
Methods:The extraction of SCFAs with ethyl ether-hexane (1:1,v/v) followed by the aminopropyl solid phase extraction (SPE) was carried out. An acid-modified poly(ethylene glycol) GC column was used for the chromatographic separation of four volatile fatty acids.
Results:Good linearity was obtained withr> 0.999 in the calibration range. The limits of quantification (LOQs) of the analytical method were in the ranges of 5.71 to 11.20μg/mL. The overall recoveries excluding acetic acid ranged between 96.51 and 108.83% with relative standard deviations (RSD) below 10% for the entire procedure from the results of matrix spiking experiments at three concentration levels.
Conclusion:The analytical method was validated in accordance with the requirements of the international guideline. The method enables the use of the most commonly used technology without derivatization and the elimination of interferences in the sample matrix.
Keywords:Short chain fatty acids (SCFAs), Microbial samples, Gas chromatography with flame ionization detection (GC-FID), Solid phase extraction (SPE)
Introduction
As the importance of short chain fatty acids (SCFAs) in-crease, a lot of research is being done in various fields. SCFAs are the main products of bacterial metabolism in the human large intestine. Evidence for the occurrence of microbial breakdown of carbohydrate in the human colon, informing the healthy state, has been sought by measuring the concentrations of SCFAs. They, also re-ferred to as volatile fatty acids (VFAs), have an
important role in biogas production as well as the hu-man body. Anaerobic digestion is essential for the pro-duction of biogas, and it takes place in the order of hydrolysis, fermentation, and methanogenesis. In the fer-mentation process, SCFAs are produced by the decom-position of amino acids, sugars, and some fatty acids and are a precursor of methanogenesis which is the final process of biogas production. For this reason, the meas-urement of SCFA in biogas production has been recog-nized as a quantitative indicator for monitoring biogas production efficiency (Sheveleva and Ramenskaya 2010, Madsen, Holm-Nielsen et al. 2011). Thus, the monitor-ing of SCFAs produced by microbial samples is neces-sary for various reasons and it can be measured from a
© The Author(s). 2019Open Access This article is distributed under the terms of the Creative Commons Attribution 4.0 International License (http://creativecommons.org/licenses/by/4.0/), which permits unrestricted use, distribution, and reproduction in any medium, provided you give appropriate credit to the original author(s) and the source, provide a link to the Creative Commons license, and indicate if changes were made.
* Correspondence:[email protected]
1Western Seoul Center, Korea Basic Science Institute, University-Industry Cooperation Building, 150, Bugahyeon-ro, Seodaemun-gu, Seoul 03759, South Korea
culture medium which is required for microbial growth (Banel, Jakimska et al.2012).
Various separation techniques have been used to de-termine SCFA in biological fluids, the most widely used being gas chromatography (GC) (McGrath, Weir et al. 1992). By combining selective GC detectors, a flame ionization detection (FID) is commonly used due to its inexpensive cost and operation, as well as its ability to detect a wide range of concentrations of organic com-pounds (Ahn, Jeon et al. 2018). Regarding the unique physicochemical properties of SCFAs, low vapor pres-sure and relatively high solubility in the aqueous phase cause the difficulties in the sample preparation (Park, Kim et al. 2017). Several types of derivatization typically done to change the analyte properties have been adopted to enhance the better separations with increased reso-lution and response (Klemm, Hintze et al.1973, Moreau, Goupry et al. 2003). However, their procedures include the steps of chemical reaction or concentration, and it can lead to serious analyte loss due to the high volatility of SCFAs. Furthermore, risks of contamination and ghost peaks are sometimes limiting factors during SCFA analysis (Pouteau, Meirim et al.2001). In this study, we report a combined method using solid phase extraction (SPE) followed by the chromatographic separation with acid-modified poly(ethylene glycol) column for the quantification of SCFAs in microbial samples. The method was validated with respect to linearity, limit of detection (LOD), limit of quantification (LOQ), and per-centage recovery from the entire procedure using the control microbial samples.
Methods
Chemicals and reagents
Four SCFAs (acetic acid, propionic acid, butyric acid, and valeric acid) and pivalic acid as an internal standard were purchased from Sigma-Aldrich (St. Louis, MO, USA). Distilled water was filtered using a Milli-Q Re-agent Water System (Millipore, Billerica, MA, USA). All organic solvents of GC analysis grade were purchased from Burdick & Jackson (Philipsburg, NJ, USA). Amino-propyl solid phase extraction cartridges (LC-NH2, 100 mg) were from Supelco (Bellefonte, PA, USA).
Preparation of samples
The quantitative determination of SCFAs produced by microorganism can be measured in culture media, and the reinforced clostridial medium was used as the ex-perimental samples. Three grams of anhydrous sodium sulfate and 300μL of sulfuric acid (2.5 mol/L) were added to 1 mL of sample containing 25μg/mL of in-ternal standard. Consecutively, the sample was extracted with 3 mL of ethyl ether-hexane mixture (1:1, v/v) for 10 min and centrifuged at 2500 rpm for 5 min. The
upper phase was collected and was performed two times with the same procedure. The extract was loaded onto the aminopropyl SPE cartridge, which had been pre-con-ditioned with 10 mL of hexane. Ten milliliters of chloro-form/2-propanol (2:1, v/v) was discarded to remove any interference, and the fraction for SCFAs was collected with elution of 6 mL of diethyl ether containing 2% for-mic acid.
Instrumentation
Agilent 6890 gas chromatographic system (Agilent Tech-nologies, Santa Clara, California, USA) equipped with a flame ionization detector and an automated liquid sam-pler was used. Chromatographic separation was achieved using a Nukol™capillary GC column (15 m × 0.53 mm × 0.5μm film thickness) from Supelco (Bellefonte, PA, USA). The oven temperature was maintained at 80 °C for 2 min and then ramped to 190 °C at a rate of 5 °C per minute. Injection was performed at 190 °C; the injec-tion volume is 1μL with split ratio 10:1 and a linear vel-ocity of 30 cm/s. The detector gases were air and hydrogen; their flow rates were regulated at 450 and 40 mL/min, respectively. Nitrogen was used as make-up gas at 40 mL/min.
Method validation
The validation of the analytical method was performed to determine the linearity of calibration, LOD, LOQ and evaluated the accuracy, precision from the results of spiking experiments. For the quantification, a standard mixture of four SCFAs in distilled water and the matrix-matched calibration standards in the concentration range of 0.1 to 100μg/mL were prepared. For the spiking experi-ment, the reinforced clostridial medium provided from the biological disaster analysis group of Korea Basic Sci-ence Institute was used. It was the supernatant of broth culture of A. rhamnosivorans sp.under anaerobic condi-tions with pH 6.8 to 7.2 at 37 °C. The percent recovery of SCFAs was calculated by analyzing five replicate spiked samples and comparing with matrix-matched calibration standards for each concentration.
Results and discussion
Derivatization and analysis of SCFAs by GC-MS
was thought that the hydrophilic nature of the re-agent yielded an unstable product that was easily hy-drolysable under conditions where water was present (Boppana, S 2013). Alternatively, tert-butyl dimethylsi-lyl (TBDMS) derivatives of SCFAs from the microbio-logical media sample were applied to separate on
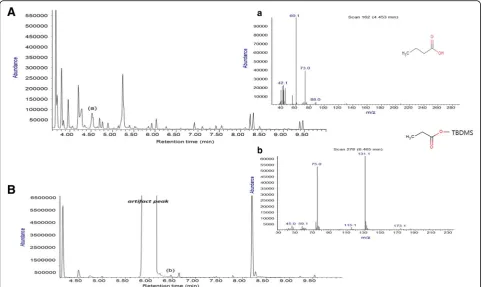
non-polar stationary phase, DB-5MS capillary column (30 m × 0.25 mm i.d., 0.25μm film thickness, 5% diphenyl, 95% dimethylsiloxane phase, J&W Scientific, Folsom, CA, USA) with a gas chromatography/mass spectrometry (GC-MS). Figure 1 indicates the total ion chromatogram of the extract of microbial media Fig. 1Total ion chromatograms of the microbial sample spiked with SCFAs in the GC-MS scan mode (A) underivatized extract (a) Mass spectrum of partially separated butyric acid (50μg/mL), (B) after TBDMS derivatization. (b) Mass spectrum of propionic acid-TBDMS eluted after the artifact
spiked with 50μg of SCFAs at the concentration of
50μg/mL in the sample obtained by GC-MS. Acetic
and propionic acids could not be found because of the early co-eluting compounds in the sample matrix even though the extracted ion chromatogram (EIC) was generated. Butyric acid was able to be found from the co-eluted other compounds in a state of partial separation by generating EIC process as shown in Fig. 1. After the TBDMS derivatization step, the chromatographic separation was improved; however, the artifacts from the derivatization reaction were in-evitable. Especially, the separation of propionic acid was influenced by the artifacts and it could not com-pletely remove even by GC-MS in selected ion-moni-toring mode. For that reason, the use of polar
stationary phase columns was considered. Instead, SPE cleanup combined with GC-FID which is the most popular GC detector was applied to separate and quantify underivatized SCFAs in the biological culture medium.
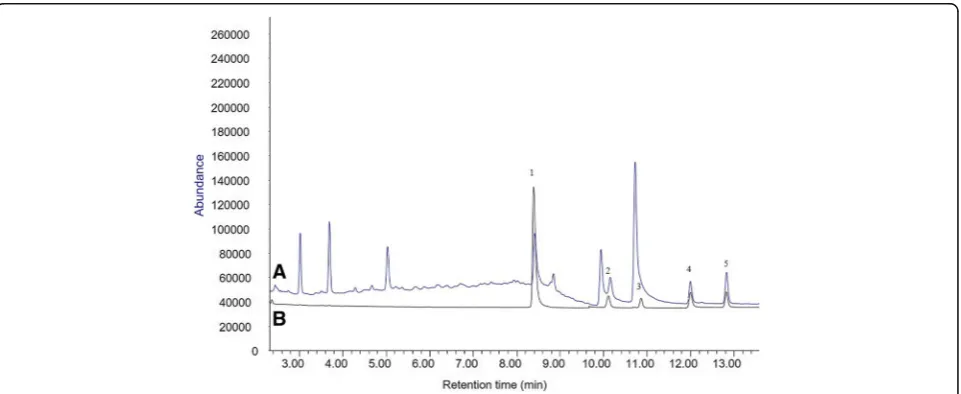
Chromatographic properties of underivatized SCFAs For the separation of SCFAs, the polarity of the column stationary phase plays a critical role, and two types of GC column, DB-Wax and Nukol™, were compared. Figure2shows the comparison of chromatograms of the eluent through SPE cartridge for the spiking control sample with SCFA standard obtained by GC-FID in two kinds of column. Since the peak resolution of SCFAs in the Nukol™column was better than the peak resolution Fig. 3Elution profile of SCFAs from aminopropyl SPE cartridge
in the DB-Wax column, therefore method validation was performed using a Nukol™column.
Optimization of SPE condition
The mixture of ethyl ether-hexane (1:1,v:v) as an extrac-tion solvent of SCFAs to be transferred from an aqueous to an organic phase was chosen to increase the extraction efficiency (Mallatou, Pappa et al. 2003, Juan, Ferragut et
al. 2008). In order to measure low concentrations of
SCFAs from biological samples, the procedure of amino-propyl SPE which is known to be in the effective separ-ation of lipids was applied (Valerie Walker2002). Figure3 shows the elution profile of SCFAs from the biological culture medium eluted with diethyl ether containing 2% formic acid after loading of the sample. From this result, 3 mL of elution solvent of diethyl ether containing 2% for-mic acid could be discarded, and afterward, 3 mL of eluent was enough for the efficient recovery to collect SCFAs. Figure 4 shows the GC chromatograms are overlaid for the biological culture medium sample before and after the SPE cleanup procedure obtained by GC-FID. After the procedure, the baseline noise on the chromatogram was reduced to increase the selectivity and sensitivity of SCFAs from the sample matrix.
Method validation
The calibration curves of SCFAs were generated in the range of 0.1~100μg/mL using least-square linear regres-sion analysis. Eight levels of standard mixtures of SCFAs (0.1, 0.5, 1, 5, 10, 25, 50, 100 μg and 25 μg of internal standard) in 1mL of distilled water were prepared and analytical procedures were carried out. The calibration equations were obtained by the peak areas for each
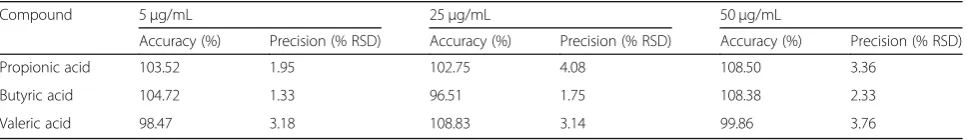
analytes against the internal standard of pivalic acid. De-tailed data is given in Additional file1: Table S1 and Fig-ure S1. The correlation coefficients to evaluate the degree of linear were all greater than 0.999. The LOD and LOQ were determined based on the standard devi-ation (SD) of y-intercept of the regression line (s) and the slope of the calibration curve (S) as LOD = 3.3 × (s/S) and LOQ = 10 × (s/S) in accordance with ICH (Inter-national Council for Harmonisation) guidelines (Don-gala, Palakurthi et al. 2019). The linearity of calibration, LOD, and LOQ parameters are summarized in Table1. For the recovery test, the pooled control sample of mi-crobial culture medium was analyzed, and target analytes were not found excluding acetic acid. Acetic acid could not be evaluated because the presence of the analyte in the control sample was attributed to the cultivation media composition. Five replicate analyses of pooled medium samples spiked with SCFAs for three different levels of concentration (5, 25, and 50μg/mL) were per-formed in accordance with the optimized procedure. The accuracy and precision were assessed by the average recovery and percentage RSD of five results at each con-centration as shown in Table 2 (see Additional file 1: Table S2). The average recovery of SCFAs ranged from 96.51 to 108.83%, with RSDs ranged from 1.75 to 4.08%. The obtained results fell within the acceptance criteria except acetic acid.
Conclusion
In the present study, SPE cleanup coupled with GC-FID was applied for the quantification of SCFAs in microbial culture samples. The use of derivatization reagent led to artifacts and interfered with the separation of propionic acid. For the chromatographic separation of underiva-tized SCFAs, a Nukol™ column was effective to increase the selectivity for them among the polar stationary phase columns. This work shows the linearity, LOD, and LOQ based on the ICH validation guideline for the optimized method. The high percentage recoveries were obtained from the entire procedure using the control microbial samples, but excluding acetic acid because of the pres-ence in the control sample. This method enables the use of the most common detector without derivatization and the elimination of interferences in the sample matrix.
Table 1Calibration, LOD, and LOQ of SCFAs obtained by GC-FID
Compound Calibration curve LOD (μg/ mL)
LOQ (μg/ mL) Slope Intercept Correlation coefficient
Acetic acid 0.0088 0.3388 0.9994 3.00 9.09
Propionic acid 0.0241 0.1869 0.9992 3.70 11.20
Butyric acid 0.0333 0.1061 0.9998 1.88 5.71
Valeric acid 0.0331 0.1415 0.9995 2.79 8.46
Table 2Accuracy and precision from the results of spiking experiments
Compound 5μg/mL 25μg/mL 50μg/mL
Accuracy (%) Precision (% RSD) Accuracy (%) Precision (% RSD) Accuracy (%) Precision (% RSD)
Propionic acid 103.52 1.95 102.75 4.08 108.50 3.36
Butyric acid 104.72 1.33 96.51 1.75 108.38 2.33
Additional file
Additional file 1:Table S1.Descriptive data of Calibration, LOD and LOQ
of SCFAs obtained by GC-FID.Table S2.Descriptive data of recovery experiment.Figure S1.Calibration curves of SCFAs. (DOCX 47 kb)
Abbreviations
EIC:Extracted ion chromatogram; GC-FID: Gas chromatography with flame ionization detection; GC-MS: Gas chromatography/mass spectrometry; ICH: International Council for Harmonisation; LOD: Limit of detection; LOQ: Limit of quantification; RSD: Relative standard deviation; SCFAs: Short chain fatty acids; SPE: Solid phase extraction; TBDMS: Tert-butyl dimethylsilyl; VFAs: Volatile fatty acids
Authors’contributions
YGA designed the study. The experiment was executed by HK and SYC. Supervision of experimental work and analysis of results were done by YGA and JK. HK and YGA contributed to the draft version of the manuscript. All authors read and approved the final manuscript.
Funding
This work was financially supported by KBSI research grant (C39705); and the internship grant was provided by Bio-Synergy Research Project of the Ministry of Science, ICT & Future Planning (NRF-2019001542) through the National Research Foundation Basic Science Research
Availability of data and materials
Research data have been provided in the manuscript and supporting information file.
Competing interests
The authors declare that they have no competing interests.
Author details
1Western Seoul Center, Korea Basic Science Institute, University-Industry Cooperation Building, 150, Bugahyeon-ro, Seodaemun-gu, Seoul 03759, South Korea.2Biological Disaster Analysis Group, Korea Basic Science Institute, Daejeon 34133, South Korea.3Department of Chemistry, Seoul Women’s University, Seoul 01797, South Korea.
Received: 10 April 2019 Accepted: 18 June 2019
References
Ahn YG, Jeon SH, Lim HB, Choi NR, Hwang G-S, Kim YP, Lee JY. Analysis of polycyclic aromatic hydrocarbons in ambient aerosols by using one-dimensional and comprehensive two-one-dimensional gas chromatography combined with mass spectrometric method: a comparative study. J Anal Methods Chem. 2018;2018:9.
Banel A, Jakimska A, Wasielewska M, Wolska L, Zygmunt B. Determination of SCFAs in water using GC-FID. Selection of the separation system. Anal Chim Acta. 2012;716:24–7.
Breves G, Krumscheid R. In vitro studies on transport and metabolism of short chain fatty acids in pig hindgut. Comp Biochem Physiol A Physiol. 1997; 118(2):399–401.
Dongala T, Palakurthi AK, Vytla Y, Katari NK. A novel UPLC-PDA isocratic method for the quantification fulvestrant in oil-based pre-filled syringe injection matrix formulations. J Anal Sci Technol. 2019;10(1):12.
Juan B, Ferragut V, Guamis B, Trujillo A-J. The effect of high-pressure treatment at 300 MPa on ripening of ewes’milk cheese. Int Dairy J. 2008;18(2):129–38. Klemm H-P, Hintze U, Gercken G. Quantitative preparation and gas
chromatography of short and medium chain fatty acid benzyl esters (C1—C12). J Chromatogr A. 1973;75(1):19–27.
L'Emeillat Y, Ménez JF, Berthou F, Bardou L. Quantitative gas chromatographic determination of low-molecular-weight straight-chain carboxylic acids as their p-bromophenacyl esters after extractive alkylation in acidic medium. J Chromatogr A. 1981;206(1):89–100.
Madsen M, Holm-Nielsen JB, Esbensen KH. Monitoring of anaerobic digestion processes: a review perspective. Renew Sust Energ Rev. 2011;15(6):3141–55.
Mallatou H, Pappa E, Massouras T. Changes in free fatty acids during ripening of Teleme cheese made with ewes’, goats’, cows’or a mixture of ewes’and goats’milk. Int Dairy J. 2003;13(2):211–9.
McGrath LT, Weir CD, Maynard S, Rowlands BJ. Gas-liquid chromatographic analysis of volatile short chain fatty acids in fecal samples as pentafluorobenzyl esters. Anal Biochem. 1992;207(2):227–30.
Moreau N, Goupry S, Antignac J, Monteau F, Le Bizec B, Champ M, Martin L, Dumon H. Simultaneous measurement of plasma concentrations and 13C-enrichment of short chain fatty acids, lactic acid and ketone bodies by gas chromatography coupled to mass spectrometry. J Chromatogr B. 2003;784(2): 395–403.
Ng L-K, Hupé M. Simple gas chromatographic method for the assay of salts of carboxylic acids as their trimethylsilyl derivatives. J Chromatogr A. 1993; 637(1):104–8.
Park NH, Kim M-S, Lee W, Lee ME, Hong J. An in situ extraction and derivatization method for rapid analysis of short chain fatty acids in rat fecal samples by gas chromatography tandem mass spectrometry. Anal Methods. 2017;9(15): 2351–6.
Pouteau E, Meirim I, Métairon S, Fay L-B. Acetate, propionate and butyrate in plasma: determination of the concentration and isotopic enrichment by gas chromatography/mass spectrometry with positive chemical ionization. J Mass Spectrom. 2001;36(7):798–805.
Sheveleva M, Ramenskaya G. Gas chromatographic analysis of short chain fatty acids in the standardization of medicinal formulations based on bacterial substrates. Pharma Chem J. 2010;44(6):334–6.
Valerie Walker GAM. Solid phase extraction in clinical biochemistry. Ann Clin Biochem. 2002;39(5):464–77.
Publisher’s Note