R E S E A R C H
Open Access
Graph-based visual analytics for cyber
threat intelligence
Fabian Böhm
*, Florian Menges and Günther Pernul
Abstract
The ever-increasing amount of major security incidents has led to an emerging interest in cooperative approaches to encounter cyber threats. To enable cooperation in detecting and preventing attacks it is an inevitable necessity to have structured and standardized formats to describe an incident. Corresponding formats are complex and of an extensive nature as they are often designed for automated processing and exchange. These characteristics hamper the readability and, therefore, prevent humans from understanding the documented incident. This is a major problem since the success and effectiveness of any security measure rely heavily on the contribution of security experts.
To meet these shortcomings we propose a visual analytics concept enabling security experts to analyze and enrich semi-structured cyber threat intelligence information. Our approach combines an innovative way of persisting this data with an interactive visualization component to analyze and edit the threat information. We demonstrate the feasibility of our concept using the Structured Threat Information eXpression, the state-of-the-art format for reporting cyber security issues.
Keywords: Cyber threat intelligence, Visual analytics, Usable cybersecurity, STIX
Introduction
Over the last years the number of IT security inci-dents has been constantly increasing among compan-ies. In order to keep pace with this development, there is a necessity for ever-improving protective measures. As single entities are no longer able to handle the vast amount of possible attack scenarios acting collaboratively against such attacks is an emer-ging trend. It is widely believed that cooperative approaches, in particular those based on the exchange of threat intelligence information, can contribute signifi-cantly to improve defensive capabilities (Shackleford
2015). A key factor for realizing cooperative approaches are the underlying threat intelligence data formats. They offer a semi-structured representation of identified threats and ensure a common understanding of security-related
observations. As they document incidents using general mark-up languages, a common characteristic of these for-mats is a good machine-readability.
However, text-intensive and semi-structured data is of very little use for security experts due to its extent and lack of human-readability. This is a major prob-lem when taking the role of security experts in to-day’s companies into consideration. As the success and effectiveness of incident prevention, detection, and reaction rely heavily on the knowledge of security experts (Shackleford 2016; Luttgens et al. 2014), they need to understand what happened, how to react ap-propriately, and how to prevent new outbreaks of cyberattacks.
Structured threat intelligence is of great value for experts as it enables them to understand threats and attacks. However, this is only possible when experts are able to read and analyze this information. It is further crucial for experts to easily edit it in order to
* Correspondence:[email protected]
Department of Information Systems, University of Regensburg, Universitätsstraße 31, 93053 Regensburg, Germany
include any additional or missing information. The interaction requires an integrity-proof approach to persist original data in order to ensure the availability of untampered evidence for possible subsequent court cases.
We propose KAVAS, a knowledge-assisted visual analytics concept for the Structured Threat Informa-tion eXpression (STIX). KAVAS enables security ex-perts to analyze and enrich cyber threat intelligence (CTI) data. We combine a novel way of persisting this semistructured data in a graph-based database with an interactive visualization. To demonstrate the feasibility of KAVAS we utilize the state-of-the-art format for structuring CTI information, STIX 2. Our work aims to improve the accessibility of cyber threat intelligence for security experts and to include them in the process of creating a comprehensive documen-tation for security incidents.
The remainder of this paper is structured as follows. Section 2 introduces the background of our work with regard to related research fields. In Section 3 we analyze related work and reach out for introducing the ad-dressed research gap. This chapter is followed by the de-scription of applied concepts and design decisions we made for KAVAS in Section 4. After introducing the main concepts of KAVAS we proceed to showcase how our approach works in Section 5. Section 6 qualitatively evaluates the applied approach to make threat intelligence accessible to security analysts. We conclude in Section 7 by discussing our concept and identifying future work.
Background
This section provides an overview of the Structured Threat Information eXpression format STIX, which is the state-of-the-art project for semi-structured represen-tation of cyber threat intelligence information. Further-more, a general view on knowledge and its role in the field of visual analytics is given.
Structured threat information eXpression (STIX)
As argued above, structured formats are a key element within the threat intelligence exchange process because they pre-define which information can be shared. Additionally, these formats define requirements for the information density of the data to be shared. Depending on the specific use-case and the required contentual ex-tent, the literature provides several formats that sup-port structuring threat intelligence information. Examples for such formats are IODEF,1 VERIS,2 and STIX.3The primary focus of IODEF is the exchange of incident information between Computer Emergency Response Teams (CERTs), whereas VERIS focuses the measurement and management of risks involved in
incidents. STIX 2, in contrast, is not bound to a specific use case and provides a comprehensive tool set for the representation of various information about incidents. As it is the format with the broadest possibilities in ap-plication (Menges and Pernul2018), we focus our work on STIX 2 as the most recent version of STIX. This choice is further substantiated by STIX being the de-facto standard format for the exchange of threat intelligence information at present, which can also be anticipated for its successor STIX 2 in the near future (Shackleford 2015; Sauerwein et al. 2017). It provides the most extensive data structures among the available formats as shown by Asgarli et al. (Asgarli and Burger
2016) as well as by Menges and Pernul (Menges and Pernul2018). This allows a wide ranging integration of expert knowledge into the analysis process. STIX 2 also provides highly flexible data structures allowing inter-actions of domain experts with very few limitations.
Regarding the content, STIX 2 provides a holistic rep-resentation for incident information, which is structured using the lightweight JavaScript Object Notation (JSON) file format. The data format provides two core compo-nent types: A STIX Domain Object (SDO) describing the characteristics of an incident and a STIX Relation-ship Object (SRO) describing relationRelation-ships between those characteristics.
In its current version, STIX 2 specifies SDO ele-ments for the representation of the attacking entity, event data describing the occurred incident as well as countermeasures initiated by the victim entity. The representation of the attacking entity includes infor-mation about the threat actor, the objectives, tools and attack patterns used within an attack. It also sup-ports the description of entire attack campaigns and the attribution of attackers to such campaigns. The lateral movement of an incident can be represented using information such as exploited vulnerabilities, detected malware or digital identities involved in the incident. Actions taken to prevent an attack as well as responses to an attack can also be represented and associated to corresponding incidents afterwards.
This listing shows the two SDO elements threat-actor
and malware as well as the SRO element relationship, which connects the SDO elements using its properties
source ref and target _ref. This example intends to illus-trate the notation for objects and dependencies within the format as well as to give an impression of the possible complexity considering more extensive STIX 2 files.
Whenever the term “STIX” is used in the following sections, we actually refer to STIX 2.
Knowledge-assisted visual analytics
Visual Analytics (VA) is a combination of two important analytic reasoning processes: interactive visualization and automated analysis both striving to gain new
insights (Keim et al.2010). Keim et al. (Keim et al.2008) define the creation of insight or knowledge as the final step in their widely accepted process for VA. This defin-ition and other VA processes describe knowledge as a solely human artifact. However, not only humans own knowledge but a specific type of knowledge also exists for any automated analysis method included in VA (Fayyad et al.2002; Sacha et al.2014).
Therefore, knowledge-assisted visual analytics distinguishes the terms explicit and tacit knowledge (Nonaka and Takeuchi 1995; Polanyi 1983). Explicit knowledge can be defined as machine knowledge which can be read, processed, and stored by ma-chines. Tacit knowledge is very specific to the individ-ual and specialized as only humans are able to extract this knowledge type. In the context of knowledgeas-sisted visual analytics, tacit knowledge can be subdi-vided into smaller notions: 1) operational knowledge and 2) domain knowledge (Chen 2005). By having the appropriate operational knowledge a user knows how to interact with a visual analytics system. Domain or context knowledge is the ability of a user to interpret the visual representation regarding a specific context. Only a combination of these two types of knowledge enables users to understand the message told by a visual analytics system and thus to derive new know-ledge (Chen 2005). Knowledge-assisted visual analytics aims to support the exchange of all these different knowledge types.
These exchanges can be formally described using knowledge conversion processes (Nonaka and Takeuchi
1995). Chen et al. (Chen et al. 2009) adapt these pro-cesses for information visualization. Wang et al. (Wang et al. 2009) as well as Federico et al. (Federico et al.
2017) further substantiate the concept of knowledge conversion to visual analytics with a special focus on ex-plicit knowledge. The four conversion processes are namely: Internalization, Externalization, Combination, and Collaboration.
Externalization describes the transfer of knowledge along the opposite direction in contrast to internaliza-tion. It is a process where tacit knowledge is translated to explicit knowledge based on the insight of a user. There are existing prototypes in the visualization com-munity showing that visualization tools taking externalization into consideration is suitable and effect-ive for persisting and making use of experts’ domain knowledge (Federico et al.2017). Externalization can be applied using two main approaches. First, the more fre-quently applied approach is enabling users to directly transfer their knowledge. There exists a range of possi-bilities for implementing direct externalization. Exam-ples are adjusting machine learning algorithms’ parameters (Theron et al. 2017), adding patterns and rules to a knowledge database (Wagner et al. 2017) or changing an ontology used by automated analysis methods (Wang et al. 2009). Second, the other way to implement externalization is an implicit one by inferring explicit knowledge based on interactions of users with the visualization (Endert et al. 2012; Zhong et al.2018). For example, dragging a node to a different location could be used to update and adjust the model of a clus-tering algorithm to fit the new position of the node.
Collaboration characterizes the exchange of tacit knowledge between humans (Wang et al. 2009). This process does not explicitly rely on computers and visualization as the most common form of sharing tacit knowledge is direct communication. However, collaboration can be supported through visual inter-faces and the possibilities to externalize tacit know-ledge and therefore, making it accessible for others at any time, supporting them to improve their own knowledge (Coleman et al. 1996).
Combination is a process where explicit knowledge from different sources is incorporated into an existing explicit knowledge system. It helps to improve available knowledge and to combine different bodies of explicit knowledge. This process is mostly independent from any visual representation of the explicit knowledge (Wang et al.2009). However, users are integrated into this process by supporting the combination, identifying relations and finding inconsistencies or redundancies.
The development of knowledge-based interfaces and the representation of knowledge generated throughout the entire analytical process has been declared a key challenge for visual analytics research (Thomas and Cook2005; Pike et al. 2009). However, in the domain of cyber security this is still underdeveloped.
Related work
Only few scientific publications tackle the problem of making threat intelligence information understandable for security experts by using visual interfaces. Even less
work is available in the area of visual analytics systems specifically designed to display STIX.
Leichtnam et al. (Leichtnam et al. 2017) introduce a visualization approach for heterogeneous data sources. To transform the diverse data into a normalized model they derive a proprietary data model inspired by STIX. They build a visualization for their proprietary format. However, a visual representation for complex threat intelligence information documented with STIX itself is not provided.
A visualization displaying STIX in its full comprehen-siveness is built by the STIX community itself.4 This visualization builds a visual representation of a STIX bundle but lacks clear and structured design principles. Especially the functionality for security experts to con-vert their domain knowledge into machinereadable threat intelligence knowledge is missing.
While there is ongoing research in the area of struc-tured formats for cyber threat intelligence (e.g. STIX) (Sauerwein et al.2017) as well as knowledge-assisted vis-ual analytics (Federico et al.2017), there are, to the best of our knowledge, no efforts towards combining these two concepts in order to make threat intelligence infor-mation accessible for security experts.
In order to address this research gap, we define the following three requirements for our solution:
R1 - Handling complex threat intelligence data: Enable integrity preserving storage and management of STIX as a notion of explicit knowledge in an appropriate database system rather than processing JSON files.
R2 - Visual representation of STIX:Create an interactive visualization for STIX-based CTI infor-mation allowing security experts to derive know-ledge and gain insights from an incident
documentation.
R3 - Conversion of experts’knowledge:Allow the exchange of explicit knowledge and security experts’ tacit knowledge. Domain knowledge can be made available in the semi-structured STIX description of an incident by externalization. Therefore, the inci-dent can be described more comprehensively and experts can benefit from each other’s knowledge.
Our concept can be interpreted as a knowledge view in the information visualization framework introduced by Shrinivasan and van Wijk (Shrinivasan and van Wijk
2008) in 2008 to support analytical reasoning.
Concept and design
(CTI Vault) to store and manage STIX as well as the corresponding visual analytics component to enable users to understand and interact with complex threat intelligence information. These concepts are aligned to the previously defined key requirements for KAVAS.
CTI vault
Hereinafter, we propose a concept for the persistence and handling of STIX cyber threat intelligence information.
R1 - handling complex threat intelligence data
STIX is designed as a graph-based model, which defines its domain objects as graph nodes and their relationships as edges. Therefore, we have chosen a graph database, as underlying technology in order to persist intelligence data appropriately.
The CTI Vault serves as an extensible knowledge base, providing access for domain experts to the threat intelligence information, which can be seen as a notion of explicit knowledge. It represents a
structured data storage for gathering captured incident data, which originate from individual files in JSON format. It serves as a technical foundation for storing incident information and additional domain expert knowledge, such as perceived similarities, differences and relationships between the different incidents.
Due to the dynamic data structures of STIX, the storage needs to provide capabilities for persisting data in a way that allows the integration of arbitrary relationships be-tween the stored entities. Another essential requirement for the data storage is to assure integrity for the cap-tured incident information. This is of special importance as the threat intelligence information could serve as piece of evidence in possible subsequent court cases. Therefore, it has to be ensured that interactions with do-main experts will not distort any of the captured data, while preserving capabilities for enriching the captured data with additional information simultaneously.
To achieve these requirements, a differentiation be-tween inventory data and appended data has to be made within the data storage. The inventory data, which represents the data foundation for incident information, describes all data that has been captured within an inci-dent. The threat information contained in the stored en-tities as well as their relationships may not be changed after their initial storage and can consequently be con-sidered constant. Therefore, this data has to be read-only. However, this is different for the use of appended data. These entities may be inserted, altered and deleted at any time and are intended to be con-nected with inventory data. Whenever information is
edited, it has to be ensured that none of the operations performed on appended entities will influence the integ-rity of the inventory data.
The proposed concept is influenced both by the de-fined data structures within the STIX specification and the requirements for an interaction of domain experts with these data structures. However, the base require-ment for the concept is the alignrequire-ment to the STIX speci-fication, to ensure the compatibility with the STIX data structures. This preserves the ability to exchange threat information with any endpoint compatible to STIX. Considering the requirements defined above, we firstly introduce an approach for persisting inventory data. This will be achieved by mapping the data available in the STIX data format, into a database representation.
The concept is subsequently extended by an approach for enriching the inventory data with appended data allowing the association of threat information to domain expert knowledge. Summarizing, the concept for hand-ling complex threat intelligence data is based on the fol-lowing two requirements, which will be specified in more detail afterwards.
R1.1 - Structured storage for threat intelligence data:The collected data is stored in a structured way within a graph database as inventory data. The data storage has to be aligned to the STIX
specification, allowing arbitrary relationships between the stored entities.
R1.2 - Integrity-proof storage and enrichment of persisted data:A further requirement for the storage of threat intelligence data is to guarantee data integrity from insert operations onward. Moreover, subsequent update operations of the inventory data must not endanger its integrity. Therefore, it is mandatory to introduce a provenance process for every performed enrichment.
R1.1 - structured storage for threat intelligence data To realize a concept of storing inventory data into the database, it is necessary to take a closer look at the STIX specification as well as to consider possibilities for the representation within a graph database.
in which the first ones represent graph node objects and the latter ones represent edges connecting these nodes.
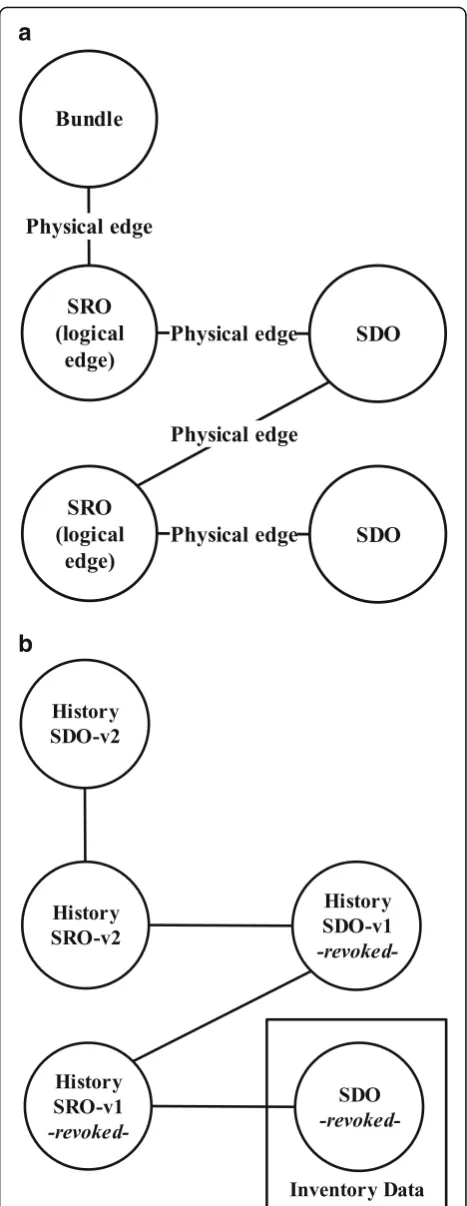
In contrast to this type of representation, graph data-bases allow the use of object types for creating nodes, whereas edges cannot be represented using object types. This leads to the necessity of adjusting the type of repre-sentation within the database in order to properly trans-late STIX into the database representation. Our approach for adjusting these interrelations between the STIX objects is visualized in Fig. 1(a) and described in more detail afterwards.
Our concept defines the representation of both SDO and SRO as physical nodes within the graph database. While SDOs act as self-sufficient nodes, SROs represent the relationships between SDOs and, therefore, act add-itionally as logical STIX edges. Finally, information about the source and target attributes of the relationship is transformed into physical edges realizing these rela-tionships within the database. This leads to a representa-tion that fully maintains the structural integrity of the STIX data model on the one hand and allows to map re-lationship properties into logical edges on the other hand. Conclusively, this results in a logical representa-tion for the directed-graph structure of STIX, which is stored using a physical non-directed graph structure within the database.
In addition to this, the STIX specification defines de-tected incident information to be pooled in relation to a root bundle element. Since the physical graph is non-directed, the bundle element can be connected to every SDO contained within an incident to achieve the pooling. This element can serve as an entry point for the traversal of incident information at the same time.
R1.2 - integrity-proof storage and enrichment of persisted data
Within the process of storing data into the CTI Vault, the integrity of captured data is essential to preserve its evidential significance for any subsequent forensic ana-lyses or even for court cases. The proposed concept pro-vides two different mechanisms to guarantee the integrity for stored incident information. On the one hand, the integrity of incident information has to be en-sured when it enters the system for the first time, on the other hand, changes on persisted information have to be conducted in an integrity preserving manner. The integ-rity of inserted information is preserved using controlled redundancies. Inserted information will intentionally not be checked for redundancies to prevent any possible dis-tortion of this data. The insertion of redundant data is possible, since the graph database assigns an internal unique identifier for every element inserted. This, in turn, prevents objects with the same content from pro-ducing collisions. However, delimitation for redundant
b
a
objects remains still possible due to the pooling of ele-ments and their affiliation to their root element, namely their bundle. The only exception for this are insertions of redundant elements within one bundle. However, this would only be the case if the elements contain identical STIX unique identifiers, which makes them both syntac-tically and semansyntac-tically identical and consequently leads to a unification of these elements.
In addition to the concept of integrity-proof persisting for inventory data, the CTI Vault is designed to provide capabilities to store additional data that enriches the available information with domain knowledge of experts. Therefore, it needs to enable the extension of existing objects and relationships of inventory data. Since the en-richment of data with domain expert knowledge is not necessarily a singular event, the database also needs to provide capabilities for historicization of all performed changes.
As stated above, the concept of enriching inventory data is based on two main requirements. It has to be en-sured that the inventory data will not be altered at any time and that the enriched data is still fully compatible to the STIX 2 specification. Consequently, the concept for enriching inventory data is also based on the STIX data structures.
According to this, only valid SDO or SRO elements that meet the STIX specification may be appended to the inventory data. Similar to the persistence of inven-tory data, appended data is also structured based on SDO nodes that are connected using logical and physical edges respectively. This results in a consistent database structure.
Figure 1(b) shows an exemplary SDO element within the inventory data extended by two subsequent changes, which are realized using a versioning structure within the database. In this process, supplementary nodes are added for each change. To indicate that nodes have been overwritten, the CTI Vault flags the respective former versions as “revoked” according to the STIX specifica-tion (Piazza et al.2017b).
The first change is realized by creating a version SDO-v1 that extends the information within the original SDO, which is part of the inventory data. SDO-v1 in turn is connected to its base entity using a newly created relationship object SRO-v1. The second change is real-ized by creating a further version SDO-v2 and a corre-sponding relationship SRO-v2. It is important to maintain the order of succession for all changes per-formed. As a result, this concept enables every node within the inventory data to carry its own chain of edi-ted data.
The presented concept for persisting cyber threat intelligence information in the STIX format fulfills therefore our requirement R1. This concept is the basis
to support the Combinationprocess as we interpret the STIX information stored in the CTI Vault to be explicit knowledge (Chen et al.2009; Ackoff1989).
Visualization design
The visual analytics component enables security experts to analyze, understand, and edit threat intelligence infor-mation. As described in Section 2.1, STIX is a powerful but text-intensive and semi-structured threat intelligence format. A single bundle can easily reach thousands of lines for complex incidents. This makes the documenta-tion very hard to analyze and understand for security ex-perts. This gets even worse when an expert appends information to the STIX file. In order to externalize do-main knowledge, the complex structure of the format in-cluding all possible objects, relationships, their attributes, and allowed values for the attributes has to be known. To support the tasks of analyzing and enriching threat intelligence documented in STIX, we developed a visual analytics component on top of the previously in-troduced CTI vault.
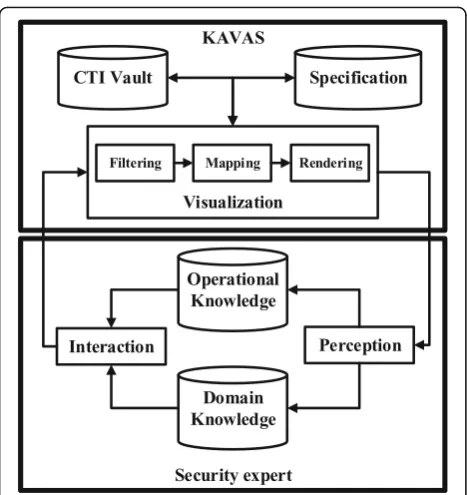
Figure 2 shows the visualization component in the overall context of the system and defines the relations between KAVAS and security experts: the visualization uses the explicit knowledge stored in the CTI vault and maps this knowledge into an interactive view using the specification. The security experts can perceive the dis-played knowledge to gain insight and situational aware-ness (Yen et al. 2014). At the same time they can use their operational knowledge to interact with the visualization in order to adjust the view specification or to enrich the information stored in the CTI vault.
R2 - visual representation of STIX
As STIX is designed to be a connected and directed graph of nodes and edges we are using a directed node-link diagram to represent knowledge persisted in the CTI Vault (Piazza et al. 2017a). This visualization technique is well suited for understanding threat intelligence as it reveals interconnections using nodes and edges (Severino 2018; Heer et al. 2010). Revealing the relationship between specific nodes (e.g. threat ac-tors, used attack patterns and the targeted entities) is a crucial task of experts analyzing STIX. This makes the node-link diagram appropriate for the data structure at hand. However, Marty (Marty 2009) as well as Card et al. (Card et al. 1999) identify two main challenges when using node-link diagrams. To address those and to en-sure the design of a suitable visual representation of STIX, we need to fulfill the following more specific requirements:
is displayed in a suitable visual representation. The visual representation is fully capable to parse, map, and render all information provided in STIX bundles according to the STIX specification.
R2.2 - Scalable visual display:As STIX bundles can contain hundreds of objects and even more links between these objects, the visual display has to be scalable. This can be assured by an appropriate layout algorithm and interactions for the users to adjust the layout.
R2.3 - Exploratory analysis:To allow that users can deduce tacit knowledge from the displayed explicit knowledge, the visual representation must provide interactions supporting the analytical process of users.
R2.1 - render complex threat intelligence
The first challenge is to identify an appropriate way for positioning the nodes and links in the visualization space. SDO and SRO are abstract data constructs and do not have any natural position like on a geographical map. The InfoVis pipeline introduced by Card et al. (Card et al. 1999) is a process for creating views based on abstract data. By applying this process to SDOs and SROs, we are able to generate a visual representation of STIX. The following paragraphs describe our adaption of the InfoVis pipeline.
Originally, the pipeline starts with a data analysis re-sponsible for data cleansing or interpolating missing values. We omit this step in our visual component as the CTI Vault is designed to persist only semantically
and syntactically correct STIX bundles. Therefore, our view generation process starts with filtering the data to be visualized, as shown in theVisualization-box in Fig.2.
Filtering is realized by receiving a single userselected STIX bundle from the vault. This ensures that the ana-lyst only sees information related to the bundle of inter-est. According to the InfoVis pipeline this single STIX bundle and the corresponding objects are referred to as focus data (Card et al.1999).
The STIX objects in the focus data do not have any available positioning in the visualization space yet. Therefore, we need to transform the STIX-specific data structure into displayable nodes and edges in a mapping-step. As the STIX format defines SDOs to be nodes and SROs to be links in its graph-based structure, we adopt this definition. However, we had to make ad-justments to improve the comprehensibility of a visually represented STIX bundle. We are displaying not only SROs as links in the node-link diagram but also import-ant relationships embedded into SDOs referencing other objects. These embedded relationships are important to understand underlying connections in the threat intelligence information. For example, when an incident report is documented with STIX, embedded relation-ships of the report highlight which objects the report re-fers to. This and similar information can be important to an expert when analyzing an incident. To allow a fast perception of embedded links, we decided to include embedded relationships of SDOs as specially denoted edges into the diagram.
Additionally, we had to adjust the way STIX Sighting objects are represented in our visualization to retain a visually understandable way of representing STIX. These objects denote the insight that an attack, threat actor, campaign or other domain object was seen (Piazza et al.
2017b). They are used whenever an already documented attack is identified at another entity as well. Therefore, they are applied to track who was targeted as well as which attacks were performed. A Sighting object is spe-cified to be a relationship. This means it would appear as a link in the visual representation although a Sighting is only connected to other SDOs via embedded relation-ships. We decided to include Sightings as nodes which are connected to SDOs via their different embedded re-lationships in the visual STIX representation to improve the perception of Sightings. These design decisions en-able rendering all STIX objects as nodes and links on the canvas.
R2.2 - scalable visual display
STIX bundles with large numbers of SDOs and SROs hamper a fast visual perception of relationships between the objects. However, a well-chosen layout algorithm and interactive functionalities for experts to adjust the layout can reduce this problem (Marty 2009). These functionalities are of great importance to ensure that a user is able to customize the visual representation of the STIX bundle. To arrange the information appropriately on the visualization canvas we apply a force-directed graph layout (Kobourov 2010). This algorithm creates a node-link diagram driven by different forces (e.g. gravity of node clusters, strength of links), which avoids over-lapping as far as possible. However, due to the possible size and complexity of highly-interconnected STIX inci-dent representations, it is necessary to provide inter-active functionalities for security experts to adjust the layout themselves. This is especially necessary, when the automated force-directed algorithm is not capable to render a feasible layout anymore. In KAVAS we imple-ment interactions allowing users to drag and drop single nodes and pin them to the desired position. Additionally, users can browse into specific parts of the STIX bundle by zooming. If the amount of nodes is overstraining the user, filters can be applied to show and hide the different types of SDOs and SROs.
R2.3 - exploratory analysis
Our concept allows security experts to interactively ex-plore visually represented incident documentation. This exploratory analysis follows the Information Seeking Mantra defined by Shneiderman: “Overview first, zoom and filter, details on demand” (Shneiderman1996). The
Overviewis provided by the initially generated node-link diagram based on the STIX intelligence information. With common interaction patterns like Pan-and-Zoom, hovering actions, filtering and Drag and Drop, security experts can adjust the view (Heer and Shneiderman
2012). This fulfills the Zoom and filterrequirement of Shneiderman’s mantra.Details on demand are displayed when an element of the node-link diagram is selected. By analyzing the visual STIX representation users broaden both their operational knowledge and their do-main knowledge (Chen et al.2009).
By implementing R2.1, R2.2, and R2.3 in our ap-proach, we are able to provide an interactive visual rep-resentation of the explicit knowledge embedded in the threat intelligence.
R3 - conversion of experts’knowledge
KAVAS allows the enrichment and editing of cyber threat intelligence while preserving the integrity of the original information at the same time. The enrichment and editing is necessary to externalize any additional or missing information from the user’s domain knowledge.
Preserving the integrity throughout this editing action allows the intelligence to serve as piece of evidence. In our approach, security experts are able to externalize their domain knowledge either through changing the at-tributes of existing SDOs and SROs or through adding new nodes and links. This functionality covers the
Externalizationprocess as users are able to transfer their domain knowledge to the CTI Vault, where it is pre-served as explicit knowledge.
Our concept supports the Collaboration of several se-curity experts by transforming it to explicit knowledge. This explicit knowledge can then be displayed to other users, which could further support them in their analysis of the incident. Thus, experts editing existing intelligence implicitly make their domain knowledge accessible for other users.
Visualization architecture
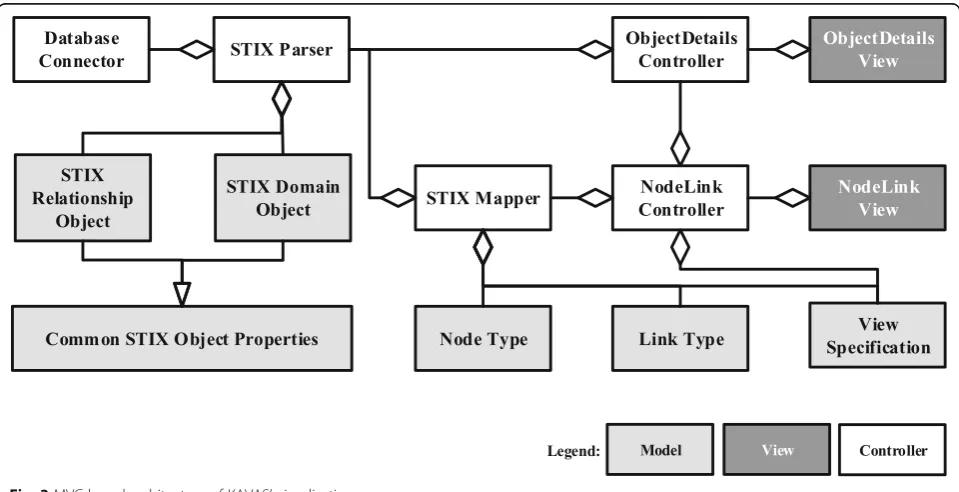
We adopted the classical Model-View-Controller (MVC) design pattern for the visual analytics compo-nent (Krasner and Pope 2000). This divides the appli-cation into three main interconnected parts to separate the internal representation of information and business logic from the visual presentation to a user. Figure 3 shows a high-level view on the MVC structure of the KAVAS visualization component. The MVC-structure of KAVAS shown in the figure is also aligned with the different steps of the InfoVis pipeline described earlier.
The Database Connector is the interface towards the available web services of the CTI vault enabling the visualization to retrieve threat intelligence data. It also enables the visualization to send updates to the database in case a security expert edited the STIX documentation. The visualization exchanges STIX-based documentations in JSON format with the vault.
The STIX Parser receives the JSON file from the
rendering of objects into a node-link diagram as well as assuring compliance of processed STIX objects with the specification.
As pointed out earlier the abstract STIX data has no position in the diagram yet. TheSTIX Mappermaps the parsed STIX objects onto the visualization canvas. It wraps every instance of the beforehand described STIX models with aNodeTypeorLinkType. These data models contain additional properties (e.g. position, movement speed, etc.) to enable the NodeLink Controllerto render the NodeLink View, which displays the interactive visual STIX representation. The View Specification tells the
NodeLink Controller important settings such as the current zoom factor, gravity, link length, node radius and others.
The details of any STIX object can now be shown by handing over the selectedNodeTypeto theObjectDetails Controller. This controller then queries the object lists of the STIX Parser to receive the corresponding STIX object instance. This instance is forwarded to the
ObjectDetails View for displaying details-on-demand. When an expert edits the STIX description, the parser receives the changes from the controllers, changes the model if necessary and forwards the changes through to theDatabase Connectorto the CTI vault.
Prototype
In the following paragraphs we explain applied technolo-gies for implementing KAVAS and give some detail of its functionalities with a short and small-scaled working exemplary bundle. A prototype of KAVAS is available
here: http://bit.ly/2v9mSna (Sauerwein et al. 2017). Please note that KAVAS is currently an academic proto-type. The linked version serves as a proof of concept. We are aware of required improvements to allow the op-erative use of KAVAS. The most emergent improve-ments are scoped for further versions of KAVAS and are described at the end of this article.
Applied technologies
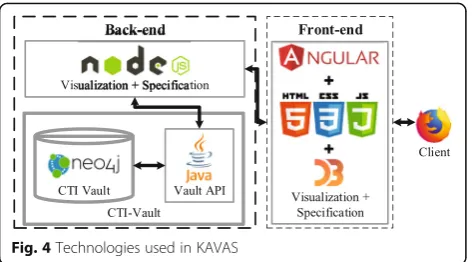
The KAVAS visual analytics component is exclusively based on open-source web technologies forming a client-server web application in combination with the CTI vault (see Fig.4). The CTI vault serves as back-end, providing the underlying data storage as described in Section 4.1 in combination with an API that enables data access for the front-end application. The vault is re-alized using the Java-based graph database Neo4j (Asgarli and Burger 2016) as base technology. Conse-quently, we also chose Java as language for realizing the access to the database as well as the related business logic managing the access. This layer assures the compli-ance to the object constraints predetermined by STIX, such as the specified object definitions and relationships. This is necessary, since the graph database does not provide such capabilities. In order to provide web-based access to the storage application, the actual Java imple-mentation is running on a JavaEE5based application ser-ver. This allows us to provide REST webservices that can be accessed from the front-end application. The main technologies on the front-end are Angular.io6and Angular Material7 which are frameworks on top of
HTML5, CSS3 and JavaScript. The interactive node-link diagram is implemented using the D3.js8-library.
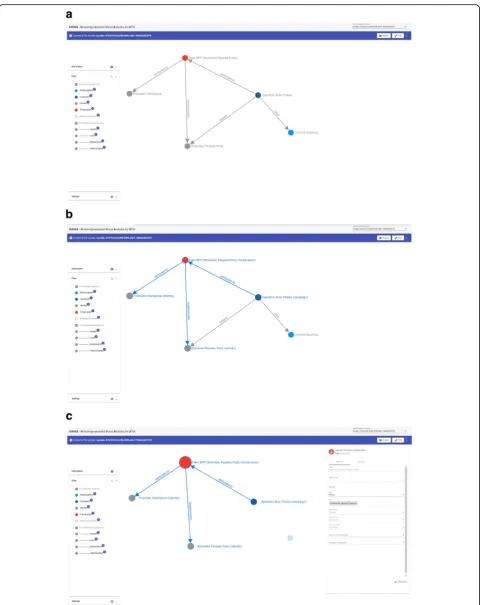
Interactive exploration
Figure5displays different views of the visual interface of KAVAS. The bundle shown in the figure is part of the official example data sets for STIX 2.9Figure5(a) shows the main view of the KAVAS visualization: an overview of a STIX bundle displayed as node-link diagram. The bundle itself documents an advanced persistent threat targeting theBranistan Peoples Party (BPP)which is one of the political parties of Branistan, a fictional country. The BPP’s homepage is hit by an attack named Oper-ation Bran Flakes where adversaries deploy Content Spoofingtrying to insert false information into the BPP’s
web page. The campaign is rolled out by a Fake BPP
which is most certainly sponsored by the Franistan Intelligence service, whereby Franistan is considered an-other fictional country. The MITRE Corporation de-tected and documented the attack.
An expert gets an overview (see Fig.5(a)) of the STIX description in the node-link diagram after selecting the STIX bundle in the tool-bar’s drop-down menu. The se-lected bundle is then received from the CTI vault, parsed and transformed for the visual display. To get a first glance of the documented incident, the expert can Pan-and-Zoom the diagram as well as drag and pin nodes to a fixed location on the canvas. Panning and zooming allows for interactive exploration. Dragging nodes across the canvas and pinning them to specific lo-cations helps the analyst with adjusting the node-link diagram to be well arranged even for large numbers of nodes and edges. Whenever the mouse is moved over a node, KAVAS highlights the nearest neighbors of this node (see Fig. 5(b)). With enabling experts to select a node or link of the diagram and displaying the detailed properties of this STIX object (see Fig. 5(c)), KAVAS fully implements the Information Seeking Mantra for threat intelligence information.
Embedded relationships are not displayed as separated edges in Fig. 5(a). This is another functionality imple-mented in the visualization component. As described
earlier, we map the embedded relationships of STIX ob-jects as specially denoted edges. However, displaying all embedded relationships leads to incomprehensible dia-grams very fast. Therefore, the embedded links as well as all other node or link types can be hidden or dis-played interactively by the user.
Editing and enriching CTI information
Analysts can enable editing whenever they want to change or add any information to the bundle. When this mode is activated the view itself stays the same to keep the analyst in the existing visual metaphor. However, the interaction behavior is different. Clicking on the blank canvas now triggers the process for adding a node to the diagram. The first step in this process is selecting the STIX object type as it defines the properties of the SDO. KAVAS adds the node to the SDO list in the STIX parser and displays it on the canvas. Afterwards, the tool brings up the details-on-demand window and the user can now edit the information for the newly added object.
Instead of dragging a node as described earlier, click-ing and movclick-ing the mouse with a node triggers the process of adding an SRO while in Editing-mode. If the mouse is released on a node, a new edge, with the start-ing node as source and the endstart-ing node as target is added to the canvas. From here on, the process for add-ing the SRO to the parser and the canvas is similar to adding a SDO. Finally, the user sees the newly created link highlighted and the editable details-ondemand window.
By clicking an existing node or link in editing mode the properties of this STIX object can be changed except for some properties, which by definition should not be element to any changes throughout the whole life-cycle of an object (e.g. its ID).
After the user clicks to save in the details-on-demand window, the input is checked for its conformity with the STIX specification. If the object is conform it is parsed into a compliant JSON. This happens regardless of whether a new object is added or an existing one is changed. Afterwards the JSON is sent to the CTI vault where the data is persisted.
Fig. 5Phases of Information Seeking Mantra in KAVAS A prototype of KAVAS is available athttp://bit.ly/2v9mSna. The displayed bundle’s id is
changed. Other users are now notified that the bundle is not locked anymore. When they activate the editing mode, the bundle is reloaded from the vault to ensure that they are working on the most recent version. They also can reload the bundle manually without switching the mode of action when they do not want to edit any-thing but still want to analyze the latest version of the STIX bundle.
Embedded knowledge processes
The KAVAS prototype is designed and implemented after a knowledge-assisted visualization approach. Therefore, the four knowledge conversion processes can be clearly identified within KAVAS’functionalities:
Internalization:This knowledge conversion process
describes the transfer of explicit knowledge into tacit knowledge through visual interfaces supporting humans to understand the explicit knowledge. KAVAS provides an interactive visual representation of explicit knowledge encompassed in the threat intelligence. In our system, internalization mainly happens through the interactive exploration of users. The node-link diagram and interaction functionalities aligned with the Information Seeking Mantra help users to inspect the knowledge and further support the discovery of unknown relationships and patterns which can become new domain knowledge.
Externalization:Our concept allows tacit knowledge
of domain experts to be externalized and persisted as explicit knowledge. Users can insert domain knowledge that does not yet exist in the threat intelligence information. Regardless of where the missing domain knowledge is originating, once acquired by the user, it can be directly inserted into the STIX bundle to augment threat intelligence. KAVAS allows this process through implementing means for users to directly edit the displayed STIX objects or add missing ones. Newly added
information is persisted in the CTI Vault. After previously existing intelligence is changed, the original information is kept and linked to the updated version to ensure traceability of any changes to the STIX bundle.
Collaboration:This process emerges when a user
analyzes intelligence, which contains the
externalized knowledge of other users. All available STIX information is persisted in the central CTI Vault and all intelligence displayed to the users is retrieved from this central intelligence storage. When one domain expert changes an incident description by editing existing intelligence or adding new pieces of information, this externalized
knowledge is available for all other experts.
Accordingly, having the CTI Vault as a centralized storage structure for all STIX intelligence and enabling users to externalize their domain knowledge, KAVAS supports the collaborative generation of tacit knowledge among its users.
Combination:This process encompasses the
insertion of new explicit knowledge into our existing knowledge base (CTI Vault), which is able to process any valid STIX bundle and to persist it. As a first step, it is highly important that the original bundle is stored regardless whether its information elements overlap with existing bundles. Hence, the bundle can be held in its original form and remains useful as possible evidence in court. After the initial storage of the original intelligence, further measures can be applied to detect and remove inconsistencies or redundancies. Currently, those measures are not yet part of the CTI Vault. However, the combination of existing explicit knowledge with new knowledge can be realized with our concept of the CTI Vault.
Evaluation
To validate our prototypical implementation of KAVAS and to provide first evidence of its usability and suitabil-ity to support knowledge conversion, we followed a two-fold research approach. An anonymous analyst sur-vey validates the general suitability of the visualization approach for the addressed problem and eliminates us-ability issues of the interface. The survey is followed by expert interviews to confirm that KAVAS can facilitate knowledge conversions between domain experts and cyber threat intelligence.
Analyst survey
This survey intends to validate the relevance of the ini-tial problem and the suitability of our design approach. Although, the survey cannot validate that the visualization facilitates all four knowledge conversion processes, it provides some hints whether the process of internalization is appropriately tackled.
Participants
The survey involved twelve security analysts from differ-ent academic institutions and companies such as inter-net service providers and security consultancies. The participants have a general understanding of threat intelligence. However, none of them is currently working with structured formats like STIX.
Design & Procedure
indication on the suitability of KAVAS for making cyber threat intelligence accessible for human analysts. Based on the definitions proposed by Staheli et al. (Staheli et al.2014) we assess the dimensions User experience, Us-ability and LearnUs-ability, Insight generation, and Feature set utility. The questionnaire encloses questions with in-formal character. Nevertheless, all questions are an-swered on an interval Likert scale ranging from 1 to 5 with the first and last numerical value being labeled with a textual description indicating the scale from 1: not at all to 5: quite a lot. The questionnaire includes the fol-lowing five questions:
Q1:Is the analysis and understanding of incidents relevant for your company/institution?
Q2:Is the proposed visual tool effective for an investigation of threat intelligence information?
Q3:Is the proposed visual tool clear and understandable?
Q4:Is the proposed visual tool adequate to display and enrich the available incident information?
Q5:Does the tool overall help to understand what
happened during the described incident?
An additional open field allows participants to report any further comments or suggestions on the tool.
Before the beginning of the survey, the analysts are in-troduced to the tool, its features and our motivation to build it. Subsequently, a JSON representation of a syn-thetic incident as described in Section 5.2 is shown. By using the JSON representation we are able to highlight the main problem with STIX-based intelligence, which is the low readability and accessibility of the format. After-wards, the participants explore the incident freely and are asked to fill out the questionnaire.
Results
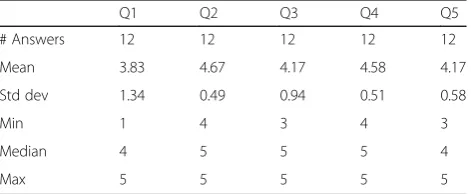
Considering Fig. 6 and Table 1 we derive the fact that the addressed problem is relevant for the respective company or institution of the analysts. The high standard deviation leads to the conclusion that the need for sharing, exchanging, and analyzing threat intelligence is not prevalent throughout the participat-ing organizations yet. The feedback on Q2 shows that a visual representation of threat intelligence is highly preferred over a text-based representation. From the answers to our third question about the usability of the proposed tool, we can conclude that the tool is indeed usable. However, we received some suggestions
for improvement. Especially the analysts who
answered Q3 with a score of 3 or lower, provided helpful feedback. For instance, one comment recom-mended that nodes should not bump back to their original position after dragging to adjust the layout of
the node-link diagram permanently. This and further received feedback was implemented into the subse-quent version of KAVAS after this survey and before the expert interviews. Feedback to the tool’s suitability
and adequacy with respect to editing threat
intelligence information (Q4) is very positive, as well. Moreover, the feedback to Question Q5 shows that KAVAS improves the understanding of incidents within the target group.
Expert interviews
In order to get in-depth insight into the support of the knowledge-assisted concepts in KAVAS, we implemented the suggestions for improvement from the survey and used the revised prototype for interviews with security ex-perts to conduct a more detailed evaluation. The main goal of these interviews is to validate that KAVAS helps security experts to understand threat intelligence and that existing information can be enriched with expert domain knowledge. By showing the fulfillment of our prototype in terms of these two requirements, we can confirm that KAVAS indeed facilitates the internalization and externalization knowledge conversion processes. The remaining knowledge conversion processes, combination and collaboration, both are implicitly implemented in KAVAS: Threat intelligence can be inserted into the CTI Vault at any time through an API (Combination). Additionally, experts can collaboratively gain knowledge through externalizing their knowledge and making it ac-cessible for other users (Collaboration). Therefore, our in-terviews focus on the internalization and externalization knowledge conversion process.
Participants
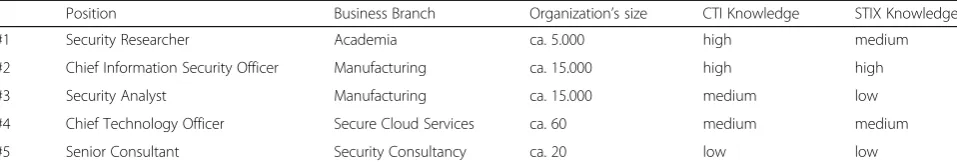
The interviewees are represented by five security experts from different sectors. We conducted interviews with a Chief Information Security Officer and a security analyst of an international machine manufacturer, with a Chief Technology Officer of a SME operating in the area of se-cure cloud services, with a consultant from a security consultancy as well as with an academic researcher in the field of IT security. None of the experts participated in the previous survey. Each participant has a medium to high knowledge regarding threat intelligence, while three of them deal with threat intelligence and related structured formats like STIX on a daily basis. However, none of the interviewed experts obtains a visual repre-sentation to facilitate this work.
Design & Procedure
(Lazar et al.2010). The interviews are separated into the following four phases:
Phase 1) Introduction: At the beginning, every participant is questioned about their experience, such as their knowledge on CTI in general and on STIX. Afterwards, each expert receives a brief introduction into the STIX format and its problem of readability and accessibility. Thereby, the experts are asked to criticize any potential issues throughout the following interview phases. Next, each
interviewee is guided to our prototypical web application. During the whole interview, the screen, of the participant using the tool, is shared with the interviewers.
Phase 2) Internalization: To be able to test the intuitivity of the explorative analysis capabilities of KAVAS, the different interactive functionalities are not introduced in detail. The participants are asked to open a synthetic, previously designed STIX bundle (7 nodes, 8 links)10and to try to understand what happened in this bundle using the visual representation. In this phase, we pay special attention to the usage of interactions as well as to how the expert try to gain insight. After this first contact with KAVAS, the focus of the interview
switches to a much more extensive bundle (65 nodes, 90 links).11With this bundle, we aim to discuss the scalability of the visual display in terms of the layout algorithm and the available interactions to adjust the layout. To conclude this phase of the interviews we ask for the experts’opinion on the tool so far and whether it supported them in understanding the threat intelligence information.
Phase 3) Externalization: The focus of this phase is to test KAVAS’suitability to facilitate the
externalization of domain knowledge, or more specifically, the insertion of new information and the modification of existing intelligence. To validate this with the interviewees, we provide a number of additional pieces of information and ask them to add this information to the previously explored smaller bundle. Again, we request them to give us feedback and criticize the tool whenever they have problems in understanding how it is working.
Phase 4) Wrap-Up: The last phase of the interviews
is dedicated to a summarizing discussion. Here, we discuss with the participant whether a more advanced version of KAVAS would be applicable to operative deployment and the conditions thereto. Finally, we collect a list of features and functionalities the interviewees find useful for improving the prototype.
Results
The interviews lasted between 45 to 70 min, which was mainly due to the summarizing discussion, where the ex-perts brought up a lot of interesting points reaching from possible improvements of STIX itself to functional-ity features of KAVAS necessary for operative deploy-ment in an organization. The results of the conducted Fig. 6Box plot reporting the KAVAS evaluation results. Solid lines mark the mean while dashed lines highlight the median
Table 1KAVAS survey results
Q1 Q2 Q3 Q4 Q5
# Answers 12 12 12 12 12
Mean 3.83 4.67 4.17 4.58 4.17
Std dev 1.34 0.49 0.94 0.51 0.58
Min 1 4 3 4 3
Median 4 5 5 5 4
interviews are presented in the following, divided ac-cording to the four phases described before.
Phase 1) Introduction: At the beginning of each
interview the participants are asked general questions to obtain basic data about the
interviewees. Therefore, they are asked about their company as well as their exact role within the company. Furthermore, they are asked about their knowledge of Cyber Threat Intelligence and the STIX format in particular to determine their level of expertise. This first phase showed, that even though interviewees are familiar with threat intelligence information in general, they are rather unfamiliar with the specifics of the STIX format in most cases. Table2gives an overview on these general
information about the interviewees.
Phase 2) Internalization: Within this phase, the interviewees are asked to take a look at a predefined STIX bundle and to understand the contents of the presented incident. The interviews showed that KAVAS supports users to quickly understand an incident without having any previous knowledge. Especially the included filter functions of KAVAS turned out to be particularly helpful in this context. The consistently positive feedback within this phase showed, that the chosen representation is both suitable for representing incident information and makes it easily available for the user.
However, this phase also revealed some disadvantages and problems with the graph visualization in general and the realization in particular. While hassle-free usage was possible on large resolution displays, it turned out that problems arise when working on lower resolution displays, especially for handling larger datasets. The interviewees also missed some functionalities. For instance, they asked for advanced filter functions for different use-cases such as filtering the k-nearest neighbor nodes within specific tree sections. The interviews further revealed that existing filters and possible interactions with the user interface to re-structure the layout prove themselves as very useful features. It was also shown that the interface could be improved by implementing some add-itional features, such as on-demand windows dis-playing further information for objects with their associated relationships and an improved initial structuring of the presented graph representation. Altogether, the interviews show that KAVAS has a high utility for security specialists to convey and understand incident information. This manifested
both in the assessment of the approach in general and the usability of the tool itself. However, it was also stated that a special training for employees might be necessary to cope with the complexity of STIX data. The interviewees also considered the tool to probably be helpful for practical usage. In this context they could for example think of a feed service to obtain incident information from a cen-tral authority, which could be used to understand attacks and prevent them from happening.
Phase 3) Externalization: Within this phase, the
interviewees are asked to use KAVAS to enrich the incident representation with additional, predefined knowledge made available by the interviewers. The process of editing information overall turned out to be mostly intuitive and easy to use for the experts.
Adding and editing nodes was perceived as intuitive by all participants, whereas some
participants argued that editing relationships was a bit counter-intuitive when working with the tool for the first time. The fact that KAVAS distin-guishes between explore and edit mode was per-ceived differently by the participants. While some accentuated the benefits of this clear separation, others found it cumbersome. However, the tool could be helpful to collect and enrich forensic evi-dence in e.g. CERT or incident response teams reconstructing how an incident compromised an organization. In this context, it was envisioned that this tool could especially be helpful within team meetings to collaboratively collect and edit threat intelligence information. It was also accen-tuated that there is most likely a need for integrity-proof intelligence data in the foreseeable future. Altogether, the enrichment of intelligence data was overall easy to use for the participants and mostly intuitive. The interview reveals that editing intelligence information is equally import-ant to analyzing it. Moreover, the interviewees highlighted that there is an actual need for this feature within companies.
Phase 4) Wrap-Up: Within the last phase, possible
One key problem revealed by the interviews is the question how threat intelligence data can be acquired. This concerns both the acquisition from external sources and the question how threat intelligence data can be produced within the company. In this context, it was also argued that there is a need for an automated generation of basic intelligence data that can be enriched by experts using tools like KAVAS afterwards. Integrating external intelligence feeds, cooperatively analyzing threat data as well as creating visual threat reports seems to be beneficial for companies. The
interviewees also suggested several additional features to improve the user interface. These, for example, include improved highlighting for
important and editable attributes or additional filter functions. Furthermore, the interviewees named some additional object properties that were necessary for practical usage, such as additional timestamps defining the point in time when the object was detected. These are not defined within the current STIX standard and consequently not available in KAVAS.
Discussion
The results of the conducted interviews show that KAVAS provides the ability for internalization and externalization of threat intelligence information. Given the fact, that it is still in the stage of a proof of concept prototype, the experts’ feedback was already good. Fur-thermore, the experts provided several suggestions for future improvements of the tool.
The interviews also demonstrated that there is a strong interest for visualizing threat intelligence infor-mation among companies. The experts already have sev-eral use-cases for this kind of application in mind. However, the question of how to generate intelligence data in the first place remains.
Moreover, the interviews also showed that there are several weaknesses in the STIX standard, which became obvious while evaluating KAVAS. An example for this is the absence of a top-level element to represent and structure specific company assets such as IT systems af-fected by an incident.
Conclusion and future work Conclusion
In this work we presented KAVAS, a concept for inter-active visual analytics of threat intelligence information. Our approach persists information in a graph database to maintain an integrity-preserving data structure. This database is connected to a visual interface supporting se-curity experts in understanding and analyzing incident descriptions. Additionally, the visual analytics compo-nent of KAVAS facilitates the process of including the knowledge of the security experts into CTI information. KAVAS achieves this with its functionalities to edit exist-ing descriptions and addexist-ing new knowledge allowexist-ing for more thorough incident documentations.
While designing KAVAS, and especially its visual compo-nent, we aimed to follow the concept of knowledge-assisted visual analytics. More precisely we designed our concept to support the four main knowledge conversion processes which are essential to improve the collaboration of human and machines.Internalizationis done in KAVAS by visually representing the incident documentations stored in the CTI vault. This way, the explicit knowledge in the CTI vault is accessible for security experts and they can gain knowledge using the visualization. KAVAS also supports
Externalization as it allows for editing the STIX bundles. The tacit knowledge is externalized when the expert edits the threat intelligence information visually displayed in KAVAS. Being implemented as graph database the CTI vault has the essential functionalities to support the Com-bination knowledge conversion. This process is imple-mented in KAVAS as the CTI vault can be fed with new threat intelligence information and it includes this newly available knowledge into the existing knowledge base. A similar process in KAVAS supports theCollaboration. As externalization of an expert’s tacit knowledge is possible, other security experts can profit from the externalized knowledge of each other providing an implicit form of collaboration.
The application KAVAS described throughout this work, clearly fulfills the three requirements we started with:
R1 - Handling of complex threat intelligence data:The CTI Vault persists STIXbased threat intelligence information in a graph database. It additionally provides the possibilities to store
Table 2General information on the interview participant
Position Business Branch Organization’s size CTI Knowledge STIX Knowledge
#1 Security Researcher Academia ca. 5.000 high medium
#2 Chief Information Security Officer Manufacturing ca. 15.000 high high
#3 Security Analyst Manufacturing ca. 15.000 medium low
#4 Chief Technology Officer Secure Cloud Services ca. 60 medium medium
externalized user knowledge in its knowledge base, while the integrity of the original information is preserved and ensured. Moreover, any data stored in the vault is compliant with the STIX format at any point in time.
R2 - Visual representation of STIX:KAVAS’ visual component can display threat intelligence and enables security experts to interactively explore incidents and gain insight about what happened.
R3 - Conversion of experts’knowledge: As described above, KAVAS provides functionalities for each of the four knowledge conversion processes.
Fulfilling all the stated requirements, KAVAS offers a flexible platform for sharing, analyzing, annotating and visualizing cyber threat intelligence information based on the STIX data format.
Future work
Although we met the previously defined requirements for KAVAS, some challenges remain, which have to be addressed in future work.
A key challenge for future work regarding the CTI Vault will be the analysis of STIX data to find intercon-nections and redundancies between different bundles, which currently are standalone object pools, not at-tached to each other. Enabling the interconnections be-tween and the merging of bundles could contribute greatly to the usage of STIX features. Additionally, this would improve the quality of available threat intelligence information. Examples for this are the merging of differ-ent inciddiffer-ents into a whole campaign of attacks and the determination of correlations between observed events within different incidents. The process for merging bun-dles and finding redundancies has to be subject for fur-ther research as it is a challenging task to identify interconnections and quality problems across independ-ent bundles.
Additionally, there are some potential improvements regarding the functionalities of the visual component. During the interviews, the participants highlighted the need for a number of different advanced filters as well as some other features, which would help them even more to work with complex threat intelligence. Furthermore, experts should be included into the process of merging and connecting bundles. KAVAS could also be extended to support more sophisticated collaboration features for security experts like annotating CTI information to ex-change domain knowledge in a more direct manner.
Another important future challenge regarding our pro-posed visual analytics tool is a comprehensive user study to quantify its effects on the work of security experts. These effects need to be quantified. Also the tool’s impact on the quality of threat intelligence documentation has to
be measured as expert knowledge can be externalized with KAVAS. Currently, KAVAS is only validated in terms of being able to work with the very limited examples pro-vided by the OASIS committee and by a qualitative evalu-ation to show its feasibility. The main reason for this small-scaled evaluation is the lack of available real-world threat intelligence data being documented with STIX 2 up to this point in time. Its predecessor STIX 1 is the industry-wide state-of-the-art for documenting this type of information and we presume that it is very likely for STIX 2 to achieve the same amount of acceptance in the near future. Since the specification of STIX 2 is still under development, it is not reasonable to evaluate the effective-ness and efficiency of KAVAS in a comprehensive and quantitative manner yet.
Another topic for future work has to be the analysis and assurance of data quality among STIX bundles. As STIX supports collaborative efforts to maximize the number of prevented cyberattacks, the data quality of the incident descriptions is crucial. This is becoming even more true when the information is analyzed and enriched by human operators. High quality information is essential to ensure trust. Therefore, existing data qual-ity metrics have to be applied on STIX-based descrip-tions to assess the added value they provide. Moreover, visual metaphors for these metrics have to be added to the KAVAS visual representation helping analysts to as-sess the trustworthiness of the information.
Endnotes 1
https://trac.tools.ietf.org/html/rfc7970 2
http://veriscommunity.net 3
https://stixproject.github.io 4
https://github.com/oasis-open/cti-stix-visualization 5
https://www.oracle.com/technetwork/java/javaee/ overview
6
https://angular.io 7
https://material.angular.io 8
https://d3js.org 9
https://oasis-open.github.io/cti-documentation/ex-ample/defining-campaign-ta-is/
10
http://bit.ly/2NLDn3W 11
http://bit.ly/2xX74EO
Acknowledgements
This research was supported by the Federal Ministry of Education and Research, Germany, as part of the BMBF DINGfest project (https:// dingfest.ur.de).
Funding
Not applicable.
Availability of data and materials
Source code - CTI Vault
Project name: CTI Vault