The Thirty-Third AAAI Conference on Artificial Intelligence (AAAI-19)
PhoneMD:
Learning to Diagnose Parkinson’s Disease from Smartphone Data
Patrick Schwab
Institute of Robotics and Intelligent Systems ETH Zurich, Switzerland
patrick.schwab@hest.ethz.ch
Walter Karlen
Institute of Robotics and Intelligent Systems ETH Zurich, Switzerland
walter.karlen@ieee.org
Abstract
Parkinson’s disease is a neurodegenerative disease that can affect a person’s movement, speech, dexterity, and cognition. Clinicians primarily diagnose Parkinson’s disease by per-forming a clinical assessment of symptoms. However, mis-diagnoses are common. One factor that contributes to misdi-agnoses is that the symptoms of Parkinson’s disease may not be prominent at the time the clinical assessment is performed. Here, we present a machine-learning approach towards distin-guishing between people with and without Parkinson’s dis-ease using long-term data from smartphone-based walking, voice, tapping and memory tests. We demonstrate that our attentive deep-learning models achieve significant improve-ments in predictive performance over strong baselines (area under the receiver operating characteristic curve = 0.85) in data from a cohort of 1853 participants. We also show that our models identify meaningful features in the input data. Our results confirm that smartphone data collected over extended periods of time could in the future potentially be used as a digital biomarker for the diagnosis of Parkinson’s disease.
Introduction
Parkinson’s disease (PD) affects more than 6 million peo-ple worldwide (Vos et al. 2016) and is the second most common neurodegenerative disease after Alzheimer’s dis-ease (De Lau and Breteler 2006). The symptoms of PD pro-gressively worsen over time, leading to a stark loss in qual-ity of life (Schrag, Jahanshahi, and Quinn 2000), and a sig-nificant reduction in life expectancy (De Lau and Breteler 2006). While there currently exists no cure for PD, avail-able pharmacological and surgical treatment options are ef-fective at managing the symptoms of PD (Goetz et al. 2005; Connolly and Lang 2014). Receiving a timely and accurate diagnosis is paramount for patients because access to treat-ments could improve their quality of life (Global Parkin-son’s Disease Survey Steering Committee 2002). Currently, clinicians diagnose PD primarily based on subjective clin-ical assessments of patients’ symptoms (Pahwa and Lyons 2010). However, research has shown that around 25% of PD diagnoses are incorrect when compared to results of post-mortem autopsy (Pahwa and Lyons 2010). Diagnosing PD is difficult because there are other movement disorders that
Copyright c2019, Association for the Advancement of Artificial Intelligence (www.aaai.org). All rights reserved.
! " # $
!
%
%
"&
%
#
%
$
12 ?
?
#
walking voice tapping memory
tests
signals
' ○ ○ ○ ○ ○ x
y
z )) )'
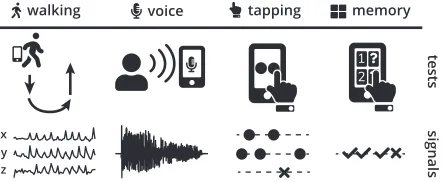
Figure 1: Smartphones can be used to perform tests that are designed to trigger symptoms of Parkinson’s disease (top). During these tests, smartphone sensors record high-resolution signals (bottom) that we can use to distinguish between people with and without Parkinson’s disease.
may appear similar to PD, and because symptom severity in PD may fluctuate over time (Pahwa and Lyons 2010).
Smartphone-based tests could potentially give clinicians access to long-term measurements of symptom severity and symptom fluctuation by enabling patients to record them-selves outside the clinic (Figure 1). However, making sense of observational smartphone data is extremely challenging for both humans and machines due to the large number of diverse data streams sampled at high resolution over long periods of time. Major unsolved questions include how to si-multaneously cover the wide range of symptoms associated with PD, how to best aggregate the vast amounts of clinically relevant data collected over time, and how to communicate the decisions of predictive models to clinicians.
Contributions.Our contributions are as follows:
• We present machine-learning models to assess symptoms of PD from signals recorded during smartphone-based walking, voice, tapping and memory tests.
• We introduce an evidence aggregation model (EAM) to integrate arbitrary numbers of symptom assessments from multiple types of tests over long periods of time to pro-duce a single diagnostic score.
• We develop a hierarchical neural attention mechanism that quantifies the importance of both individual tests and segments within those tests towards the diagnostic score. • We perform experiments on real-world data collected
from 1853 mPower participants with and without PD that show that our approach leads to significant improvements in prediction performance over several strong baselines.
Related Work
Background. Machine learning has a rich history in fa-cilitating medical diagnoses. Machine learning has, for ex-ample, been applied to diagnosing breast cancer from tu-mor features (Zheng, Yoon, and Lam 2014), cardiac ar-rhythmias and cardiac risk factors from smartphone-based heart rate sensors (Oresko et al. 2010; Schwab et al. 2017; Ballinger et al. 2018), skin cancer from clinical images (Es-teva et al. 2017), depressed moods from information self-reported via smartphones (Suhara, Xu, and Pentland 2017), and a wide range of clinical diagnosis codes from elec-tronic health records and lab test results (Lipton et al. 2015; Choi et al. 2016; Razavian, Marcus, and Sontag 2016). Pre-dicting a person’s disease status is difficult because there is a vast range of factors that may influence an individ-ual’s health. Wearable sensors and smart devices enable us to capture a number of these factors with minimal burden on users by passively and continuously tracking behaviors and environmental factors (Quisel et al. 2017). However, in contrast to clean, standardised benchmark datasets, obser-vational data collected by wearable sensors and smart de-vices in the real-world is often difficult to integrate with ex-isting machine-learning approaches. The difficulty of apply-ing existapply-ing machine-learnapply-ing methods to complex datasets has led to the development of specialised methods to deal with several of the idiosyncrasies of observational health data, such as missingness (Lipton, Kale, and Wetzel 2016; Che et al. 2018), long-term temporal dependencies (Choi et al. 2016), noise (Schwab et al. 2017), heterogeneity (Lib-brecht and Noble 2015), irregular sampling (Lipton et al. 2015), sparsity (Lasko, Denny, and Levy 2013), and mul-tivariate input data (Ghassemi et al. 2015; Schwab et al. 2018). However, adapting existing machine-learning meth-ods to account for the idiosyncrasies of healthcare data re-mains an ongoing challenge (Ghassemi et al. 2018).
Monitoring and Diagnosis of PD. There has been much interest in leveraging new technologies and data modalities to better diagnose and assess symptom severity in PD. There are a number of driving factors behind the interest in new ap-proaches: Firstly, despite the severity of the disease, clinical PD diagnoses are currently relatively inaccurate. Diagnoses
are particularly difficult in the earlier stages of the disease and in the presence of other disorders that may appear sim-ilar to PD (Rizzo et al. 2016). Secondly, new technologies could lead to patients receiving their diagnoses earlier. An early diagnosis could potentially improve a patient’s quality of life by giving them access to symptom-suppressing treat-ments (Global Parkinson’s Disease Survey Steering Com-mittee 2002). Lastly, both clinical trials for new pharma-ceutical treatments and clinical decision-making require the ability to accurately diagnose and objectively assess symp-toms of PD (Shulman et al. 2006; Dorsey et al. 2017). Pre-vious works have for example used data from pen move-ments (Smith et al. 2007), wearables (Patel et al. 2009; Klucken et al. 2013), and speech features (Little et al. 2007; 2009; Tsanas et al. 2010; 2011; 2012) to objectively moni-tor or diagnose PD. A number of works have also proposed the use of smartphone sensors for continuously monitoring symptoms in PD (Hammerla et al. 2015; Arora et al. 2015; Zhan et al. 2016; 2018; Prince, Andreotti, and Vos 2018). Recently, the PD Digital Biomarker DREAM challenge1
aimed to develop machine-learning models to diagnose PD from accelerometer data in a collaborative effort. (Emrani, McGuirk, and Xiao 2017) proposed a multitask-learning framework to identify biomarkers that are predictive of pro-gression in PD. However, their approach did not integrate raw sensor data and could not handle missing input data.
In contrast to existing works, we present the first machine-learning approach to distinguishing between people with and without PD that integrates information from sensor measure-ments of several types of smartphone-based tests over long periods of time. Our approach is able to simultaneously (i) assess single test instances and (ii) produce a unified diag-nostic score. In addition, we introduce a hierarchical neural attention mechanism that enables us to reason about both the importance of specific tests as well as the importance of indi-vidual segments within those tests towards the final diagnos-tic score. Furthermore, we perform our experiments on data collected from 1853 mPower participants, the largest cohort used to validate a machine-learning approach to diagnosing PD from smartphone data to date.
Methodology
Overview. We utilise data collected during the mPower study, a large-scale observational study about PD conducted entirely through a smartphone app (Bot et al. 2016). In the study, participants with and without PD are asked to per-form four smartphone-based tests (walking, voice, tapping and memory; Figure 1) up to three times a day without any supervision. In addition to regularly performing the tests, participants provide their detailed demographic profile, in-cluding possible prior clinical diagnoses of PD, using self-reporting forms within the app2. The main idea of the pre-sented approach is to connect the sensor data collected by the participants’ smartphones with their prior professional diagnoses to train machine-learning models to learn to diag-nose PD.
1
http://synapse.org/DigitalBiomarkerChallenge
2
y
y
y
y
input model output
P
P
P
P
x
x
x
x
○ ○ ○
○ ○
Figure 2: An illustration of the data processing pipelines for each of the test types (vertical) from the input signalsx?
(left) over the specialised predictive modelsP? (center) to
the single-test output predictionsy?(right). The use of
spe-cialised predictive models for each test type enables us to choose the most suitable model for each of the heterogenous input signals.
Smartphone Tests. mPower participants perform the fol-lowing four types of tests using their personal smartphones:
Walking Test.To perform the walking test, participants are asked to put their smartphone in their pocket, walk 20 steps forward, turn around, stand still for 30 seconds, and then walk 20 steps back. We denote the three distinct segments of the walking test as: Outbound, rest, and re-turn, respectively. During the test, the smartphone’s ac-celerometer and gyroscope record the participant’s three-dimensional linear and angular acceleration. This test is designed to measure movement impairments associated with PD, such as tremor, rigidity, and freezing of gait. Voice Test.In the voice test, participants are asked to say
”aaaah” into their smartphones’ microphone for up to 10 seconds. The smartphone’s microphone records the audio data during the test and during the preceding countdown. The goal of the audio test is to expose speech impairments that are commonly found in people with PD.
Tapping Test.In the tapping test, participants are asked to position their smartphones on a flat surface and alternat-ingly tap two buttons on the screen for 20 seconds. The smartphone records the positions and timestamps of the participant’s taps on the screen. In addition, the smart-phone’s accelerometer measures the three-dimensional movements of the smartphone during the test. The tap-ping test is aimed at uncovering signs of impaired finger dexterity. Impaired finger dexterity is a common symptom in people with PD.
Memory Test.In the memory test, participants are pre-sented with a grid of flowers on their smartphone screens. During the test, different flowers are illuminated one at a time. Participants are then asked to repeat the observed sequence by touching the flowers in the same order. The collected data includes the positions and timestamps of the participant’s taps on the smartphone’s screen and the sequence order as displayed to the participant. This test measures the spatial memory of the participant, which may be impaired due to PD (Bot et al. 2016).
(m,1, y,1) (m,2, y,2) (m,3, y,3) (m,4, y,4)
y
h1 h2 h3 h4
EAM
Figure 3: Temporal ensembling using an evidence aggrega-tion model (EAM). The EAM (grey) receives per-test meta-data (m?,j) and per-test output predictions (y?,j) in temporal
order as input. In this example, the EAM’s hidden state (hj)
aggregates the information from thek = 4performed tests to produce a final outputythat indicates whether or not the participant is likely to have PD.
Multistage Approach. Our approach to distinguishing be-tween people with and without PD consists of two stages. In the first stage, we use specialised predictive models P?
to identify PD in signalsx? from a single type of test with ? ∈ {(walking), (voice), (tapping), (memory)}. The specialised models are trained to predict a participant’s diagnosis given the signal data from exactly one sample in-stance of one type of test (Figure 2). The output of the spe-cialised models is a local predictiony? that indicates, on a
scale from 0 to 1, how likely it is that the participant that performed the given test instance has PD:
y?=P?(x?) (1)
The specialised modelsP? are the building blocks for the
second stage. In the second stage, the outputsy?,j, withj∈
[1, k], of the specialised models and the metadatam?,j for
allktests performed by a user are aggregated into a single diagnostic predictionyusing an EAM (Figure 3):
y=EAM([(m?,1, y?,1), ...,(m?,k, y?,k)]) (2)
The primary idea behind Equations 1 and 2 is to disentangle learning how to assess symptom severity from each test and how to aggregate multiple tests over a period of time. This compositional approach to modelling the problem of diag-nosing PD from a range of diverse smartphone tests enables us to choose the most suitable predictive model for the var-ious test types and the EAM. Furthermore, each specialised predictive modelP? is optimised for one type of test only.
outbound rest return
CNN Feature CNN Feature CNN Feature
AUC 0.53(0.50, 0.56) 0.50 (0.50, 0.53) 0.53(0.50, 0.56) 0.52 (0.50, 0.55) 0.77(0.74, 0.79) 0.77(0.75, 0.79) AUPR 0.60(0.57, 0.64) 0.60(0.55, 0.62) 0.62(0.59, 0.66) 0.61 (0.55, 0.62) 0.72 (0.53, 0.87) 0.86(0.84, 0.88)
voice tapping memory
CNN Feature CNN Feature RNN Feature
AUC 0.53 (0.50, 0.55) 0.56(0.54, 0.58) 0.59 (0.57, 0.61) 0.62(0.60, 0.64) 0.65(0.60, 0.69) 0.52 (0.50, 0.57) AUPR 0.48(0.45, 0.51) 0.45 (0.43, 0.48) 0.56 (0.53, 0.59) 0.65(0.62, 0.67) 0.91(0.88, 0.93) 0.87 (0.84, 0.89)
Table 1: Comparison of the AUC and AUPR values for the different test types when only given the data of a single test to make a diagnostic decision. We compared the performances of neural networks (CNN, RNN) with expert features from biomedical literature fed to a random forest model (Feature) on the validation set. The listed models were the best models encountered over 35 hyperparameter optimisation runs for each test and model type. We calculated the 95% confidence intervals (CIs) using bootstrap resampling with 1000 bootstrap samples. A comparison between the test types was not possible, because the evaluated subsets differed significantly due to different user groups preferring to do certain tests in different amounts (Appendix D).
Hierarchical Neural Attention. In addition to the diag-nostic scorey, our approach provides the clinician with in-formation about which tests and test segments in the data recorded by the user were most important for the model’s output. Presenting information about which data the model output is based on can help put the diagnostic scoreyin per-spective and inform the clinician’s further clinical decision-making. For example, in a patient whose diagnostic pre-diction focused primarily on motor symptoms, the clinician can focus her efforts on ruling out other movement disor-ders that may cause similar symptoms. In order to high-light (i) which individual tests were most important for the EAM’s outputy, and (ii) which segments of specific tests were most important for the local predictionsy?, we
intro-duce a hierarchical neural soft attention mechanism. When using neural networks as predictive models, the upper-level attention mechanism (i) is a component of the EAM and the lower-level attention mechanism (ii) is part of the spe-cialised modelsP?. Both the upper- and lower-level
atten-tion mechanism use the same mathematical formulaatten-tion. Given the top-most hidden feature representationshiof (i)
all the tests performed by a user, or (ii) segments in the recorded signal streams for a single test, we calculate at-tention factorsaiusing (Xu et al. 2015; Schwab et al. 2017;
Schwab, Miladinovic, and Karlen 2019):
ai=
exp(uT ius)
Pm
j=1exp(u
T jus)
(3)
where
ui=activation(Wshi+bs) (4)
Equation (4) corresponds to a single-layer MLP with a weight matrixWsand biasbs. The single-layer MLP projects hi into a suitable hidden representationui for comparison
withus. We then calculate the attention factorsaiby
com-puting the softmax similarity ofuitous.usis the most
infor-mative hidden representation, i.e. the hidden representation for whichai would be the highest (Schwab, Miladinovic,
and Karlen 2019).Ws,bsandusare learned parameters and
jointly optimised with the other parameters during training.
Experiments
Our experiments aimed to answer the following questions: 1 What is the comparative performance of various
spe-cialised modelsP?in diagnosing PD from a single test?
2 How do EAMs compare to existing methods for aggregat-ing multiple local predictions?
3 What is the overall diagnostic accuracy of our approach? 4 Does the proposed hierarchical neural attention
mecha-nism identify meaningful data points?
To answer these questions, we performed experimental com-parisons between various baselines, predictive models and EAMs both on predicting PD from a single test and from an arbitrary number of tests.
Dataset and Study Cohort. We use data from the mPower study, a worldwide observational study about PD conducted entirely through smartphones (Bot et al. 2016). Starting in March 2015, the study recruited participants aged 18 and older around the world through a mobile app. Partic-ipants provided their demographic profile, including prior diagnoses of PD, through self-reporting, and performed the four test types regularly. Out of the study cohort, we used the subset of participants that were 45 or older, because there were very few participants in the dataset that had a clini-cal diagnosis at younger age. We used only those tests that were performed off medication, except for the memory tests. We performed a random split stratified by participant age to divide the available dataset into a training set (70%), vali-dation set (10%), and test set (20%). Each participant and the tests they performed were assigned to exactly one of the three folds without any overlap (Table ).
Models. For each test type, we trained several specialised predictive models P? using both automated feature
Method AUC AUPR F1 Sens@95%Spec
EAM (Both) + age + gender 0.85(0.81, 0.89) 0.87(0.82, 0.91) 0.81 (0.75, 0.85) 0.43(0.19, 0.54) EAM (Neural networks) + age + gender 0.84 (0.80, 0.88) 0.86 (0.81, 0.90) 0.82(0.74, 0.86) 0.33 (0.21, 0.51) EAM (Feature) + age + gender 0.84 (0.79, 0.88) 0.86 (0.81, 0.90) 0.76 (0.73, 0.84) 0.40 (0.23, 0.56) End-to-end neural network + age + gender 0.50 (0.50, 0.56) 0.54 (0.46, 0.62) 0.27 (0.20, 0.70) 0.04 (0.01, 0.07)
Age + gender 0.74 (0.69, 0.79) 0.75 (0.68, 0.82) 0.72 (0.67, 0.79) 0.16 (0.09, 0.31)
EAM (Both) 0.70 (0.64, 0.75) 0.74 (0.66, 0.79) 0.67 (0.60, 0.71) 0.23 (0.15, 0.41) EAM (Neural networks) 0.71 (0.65, 0.76) 0.75 (0.67, 0.80) 0.67 (0.61, 0.72) 0.24 (0.14, 0.41) EAM (Feature) 0.71 (0.66, 0.76) 0.75 (0.67, 0.80) 0.68 (0.61, 0.73) 0.24 (0.14, 0.39)
Mean Aggregation (Neural networks) 0.64 (0.58, 0.69) 0.67 (0.58, 0.73) 0.60 (0.52, 0.68) 0.22 (0.10, 0.27) Mean Aggregation (Feature) 0.62 (0.56, 0.68) 0.60 (0.51, 0.66) 0.62 (0.53, 0.69) 0.13 (0.00, 0.19) Max Aggregation (Neural networks) 0.61 (0.55, 0.67) 0.61 (0.53, 0.68) 0.59 (0.54, 0.68) 0.03 (0.01, 0.19) Max Aggregation (Feature) 0.61 (0.54, 0.66) 0.61 (0.52, 0.68) 0.60 (0.52, 0.65) 0.07 (0.03, 0.18)
Table 2: Comparison of the AUC, AUPR, F1, and sensitivity at a fixed specificity of 95% (Sens@95%Spec) on the test set of 347 participants across the methods that we evaluated. In parentheses are the 95% CIs calculated with 1000 bootstrap samples.
neural networks, we used different architectures of neural networks for each test depending on the type of input sig-nal. For the walking, voice and tapping task, we used multi-layer convolutional neural networks (CNNs) with max pool-ing and temporal convolutions. For the memory test, we used a recurrent neural network (RNN) with bidirectional long short-term memory (BLSTM). Except for the voice test, the neural networks hosted the segment-level neural attention mechanisms described previously. For the voice CNN, we did not employ a neural attention mechanism because we found that it was detrimental to predictive performance. To implement the previously described EAM, we used a RNN architecture consisting of BLSTM cells. We trained EAMs using (1) only the RF models, (2) only the neural networks, and (3) an ensemble of both as specialised models to com-pare the performances of both approaches and whether their outputs are complementary. The detailed architectures for the neural networks and EAM are given in Appendix B. The EAM received a one-hot encoded unique identifier of the specialised predictive model as input metadata m?,j with
each local per-test predictiony?. The unique identifier
en-abled the EAM to differentiate between the various spe-cialised predictive models. We additionally tested passing timing information, including the time since the last
per-Property Training Validation Test
Subjects (#) 1314 (70%) 192 (10%) 347 (20%)
PD (%) 52.36 50.00 56.20
Female (%) 28.00 36.98 25.94 Age (years) 59.29± 9.40 59.53± 9.03 58.90± 9.24 Walking (#) 13.89±35.07 15.58±33.90 14.03±45.20 Voice (#) 16.11±40.21 19.47±44.55 14.88±45.12 Tapping (#) 15.20±38.04 18.50±43.12 14.78±42.67 Memory (#) 14.01±33.30 20.78±35.92 17.58±38.11 Usage (days) 24.27±41.01 29.66±45.73 25.43±43.24
Table 3: Population statistics of the training, validation, and test set. Numbers (#) shown are mean±standard deviation.
formed test and the hour of day at which the test was formed, for each performed test. However, we found no per-formance benefit in adding timing information to the meta-data. Lastly, in order to determine whether the use of an EAM improves performance over simpler approaches, we evaluated the performances of aggregating over local pre-dictionsy?using the mean and maximum values of all local
predictions. As a simple baseline based on demographics, we trained a MLP that received as input the age and gen-der of a participant and no information of any of their per-formed tests. To determine whether the proposed separation of learning to assess single test instances and learning to in-tegrate multiple tests tests is beneficial, we also trained an end neural network jointly on both tasks. The end-to-end neural network used the same architectures as the spe-cialised models to assess the tests and the same architecture as the EAM to integrate multiple tests.
atest
aseg
1 2
aseg
outbound rest
3 4 5 6 7 8 9 10 11 12 13 14 15 16 17 18
2 3 4 5 6 7 8
1 1 2 3 4 5 6 7 8 9 10 11 12 13 14 15 16 17
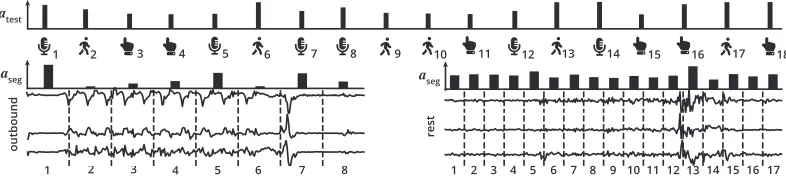
Figure 4: The outputs of the employed hierarchical neural attention mechanism on a user with PD that performed 18 tests. The timeline (top, left to right) shows all the tests performed by the user in temporal order. The tests performed (top,atest) and the
data segments within the tests (center,aseg) were assigned attention weights that quantify their relative importance towards the
final diagnostic scorey. We show the outbound accelerometer data (left) and the rest accelerometer data (right) from walking test10. In the outbound recording, the attention mechanism focused strongly on the long delay to start moving (segment 1), increasingly choppy movement while setting foot (segments 3, 4, and 5), and the abrupt stop (segment 7). In the rest recording, we found that the attention was evenly distributed across the recording, likely because the whole recording contained signs of what could have been resting tremor. Sightly more attention was paid to segments with increased motion (segments 5 and 13).
Preprocessing. For computational performance reasons, we downsampled the input signals for the walking, voice and tapping test by factors of 10, 4, and 10, respectively. In our initial evaluation, we did not see significant differences in predictive performance when using higher resolution data. After downsampling, we zero-padded or truncated the size of the sensor data to fixed lengths for each test type if they were too short or too long, respectively. The fixed lengths were 300, 250, 25, and 300 samples per record for the walk-ing, voice, memory and tapping tests, respectively. For the voice test, we did not pass the raw voice signal to the neu-ral networks. Instead, we passed the Mel-frequency cepstneu-ral coefficients (MFCC) that we extracted from the audio signal using a window size of 30 ms, a stride of 10 ms and 40 coef-ficients as input signal. For the RFs, we used the raw audio signals downsampled from their original sampling rate of 44100 Hz with factor 20 as inputs to the feature extractors. We standardised the accelerometer data for the walking and tapping tests to have zero mean and unit variance.
Metrics. We computed the area under the receiver operat-ing characteristic curve (AUC) and the area under the pre-cision recall curve (AUPR) when comparing the different specialised predictive models. We evaluated the specialised models on the validation set to avoid test set leakage that could affect the evaluation of the models that aggregate in-formation from multiple tests. We chose the best-performing specialised predictive models for each test for use in the ag-gregation models based on validation set performance. To compare the models that aggregated all available tests of a single user into a single diagnostic score, we additionally calculated the F1 score and the sensitivity at a fixed speci-ficity level of 95%. Some of the data folds were not balanced between people with and without PD. In particular, compar-ing scompar-ingle-test performances between test types was not pos-sible due to differences in the number of tests performed be-tween people with and without PD (Appendix D). We eval-uated the performances of the three parts of the walking test (outbound, rest, and return) separately to determine their rel-ative importances for diagnosing PD.
Results
Single-test Performance. In terms of single-test perfor-mance, we found that, generally, both RFs with expert fea-tures and automated feature extraction with neural networks achieved competitive results for all tests (Table 1). The performances of RFs with expert features and neural net-works were similar across all tests, except for the tapping test, where the expert features significantly outperformed the neural networks, and the memory test, where the neural networks likewise outperformed the expert features. When comparing the three segments of the walking test, we found that return was the most informative for diagnosing PD.
Overall Performance. We found large differences in per-formance between the various aggregation models that took into account all the performed tests of a user (Table 2). Notably, EAMs outperformed all baselines by a large mar-gin, and significantly improved upon the demographics-only model by integrating information from the tests performed by participants. We also found that expert features and neu-ral network features were to some degree complementary, as the best EAM using both sets of predictive models outper-formed its counterparts that only used one set of specialised predictive models. The neural networks trained end-to-end to simultaneously assess all types of tests and aggregate in-formation from the available tests over time failed to con-verge. Closer analysis revealed that the end-to-end network was unable to effectively propagate gradients through the initially more attractive upper layers down to the per-test layers. Disentangling symptom assessment and temporal ag-gregation enabled EAMs to overcome this issue entirely.
Discussion
Our work expands on prior studies (Arora et al. 2015) by de-veloping an effective methodology for integrating evidence from multiple types of smartphone-based tests over long pe-riods of time, introducing tools to identify the most salient data segments across the vast amounts of generated data points, and evaluating these novel approaches in a large, representative cohort. The availability of smartphone-based tools for diagnosing PD could have a profound impact on clinical practice by enabling clinicians to access long-term observational data on patients. These additional data points could help give clinicians a more comprehensive and objec-tive view on their patients’ symptoms and symptom fluc-tuations, and therefore possibly enable more accurate diag-noses and treatment regimes. Another major potential bene-fit of enabling patients to record themselves with their smart-phones is that it could enable clinicians to monitor their pa-tients without requiring in-person visits that may be time-consuming and expensive, particularly in rural locations and developing countries. While our initial results are promising, further clinical validation is needed to determine whether the availability of smartphone data, the proposed diagnostic score, and in-depth information about the most relevant data points improve clinicians’ ability to accurately diagnose PD.
Limitations. The main limitation of this work is that we use prior clinical diagnoses of users to train and evaluate our models. Clinical diagnoses for PD are themselves of-ten inaccurate (Rizzo et al. 2016), and are therefore not a flawless gold standard to evaluate against. In addition, much like in clinical assessments, smartphone-based tests depend on PD symptoms being clearly distinguishable for at least some of the tests being performed. While smartphones en-able patients to record themselves when they believe that their symptoms are most pronounced, they still might not be clearly distinguishable against normal human variability, particularly in early-onset PD. Furthermore, the accuracy of smartphone diagnostics may be reduced when confronted with other movement and neurologic disorders that may ap-pear similar to PD. More data, ideally from a prospective study, is needed to conclusively determine the robustness of machine-learning and smartphone-based tests against these confounding factors.
Conclusion
We presented a machine-learning approach to distinguish-ing between people with and without PD from multiple smartphone-based tests. Our multistage approach is built on the idea of separately training (i) specialised models to as-sess symptom severity in instances of a single test, and (ii) an EAM to integrate all available single-test assessments into a final diagnostic score. In addition, we introduced a hierarchi-cal attention mechanism that shows both which tests out of all performed tests, and which segments within those tests were most important for the model’s decision. We demon-strated experimentally that the presented approach leads to significant improvements over several strong baselines with an AUC of 0.85 (95% CI: 0.81, 0.89), an AUPR of 0.87
(95% CI: 0.82, 0.91) and a sensitivity at 95% specificity of 43% (95% CI: 0.19, 0.54) in data from a cohort of 1853 participants. Our results confirm that machine-learning al-gorithms and smartphone data collected in the wild over ex-tended periods of time could in the future potentially be used as a digital biomarker for the diagnosis of PD.
Acknowledgments. This work was partially funded by the Swiss National Science Foundation (SNSF) projects 167302 and 150640. We acknowledge the support of NVIDIA Cor-poration with the donation of the GPUs used for this re-search. The data used in this manuscript were contributed by users of the Parkinson mPower mobile application as part of the mPower study developed by Sage Bionetworks and de-scribed in Synapse (doi:10.7303/syn4993293).
References
Arora, S.; Venkataraman, V.; Zhan, A.; Donohue, S.; Biglan, K.; Dorsey, E.; and Little, M. 2015. Detecting and monitoring the symptoms of Parkinson’s disease using smartphones: A pilot study. Parkinsonism & related disorders21(6):650–653.
Ballinger, B.; Hsieh, J.; Singh, A.; Sohoni, N.; Wang, J.; Tison, G. H.; Marcus, G. M.; Sanchez, J. M.; Maguire, C.; Olgin, J. E.; et al. 2018. DeepHeart: Semi-Supervised Sequence Learning for Cardiovascular Risk Prediction. InAAAI Conference on Artificial Intelligence.
Bot, B. M.; Suver, C.; Neto, E. C.; Kellen, M.; Klein, A.; Bare, C.; Doerr, M.; Pratap, A.; Wilbanks, J.; Dorsey, E. R.; et al. 2016. The mPower study, Parkinson disease mobile data collected using ResearchKit.Scientific data3:160011.
Che, Z.; Purushotham, S.; Cho, K.; Sontag, D.; and Liu, Y. 2018. Recurrent neural networks for multivariate time series with missing values.Scientific reports8(1):6085.
Choi, E.; Bahadori, M. T.; Schuetz, A.; Stewart, W. F.; and Sun, J. 2016. Doctor AI: Predicting clinical events via recurrent neural networks. InMachine Learning for Healthcare Conference. Connolly, B. S., and Lang, A. E. 2014. Pharmacological treatment of Parkinson disease: a review.JAMA311(16):1670–1683. De Lau, L. M., and Breteler, M. M. 2006. Epidemiology of Parkin-son’s disease.The Lancet Neurology5(6):525–535.
Dorsey, E. R.; Papapetropoulos, S.; Xiong, M.; and Kieburtz, K. 2017. The first frontier: digital biomarkers for neurodegenerative disorders.Digital Biomarkers1(1):6–13.
Emrani, S.; McGuirk, A.; and Xiao, W. 2017. Prognosis and Diag-nosis of Parkinson’s Disease Using Multi-Task Learning. In Pro-ceedings of the 23rd ACM SIGKDD International Conference on Knowledge Discovery and Data Mining, 1457–1466. ACM. Esteva, A.; Kuprel, B.; Novoa, R. A.; Ko, J.; Swetter, S. M.; Blau, H. M.; and Thrun, S. 2017. Dermatologist-level classification of skin cancer with deep neural networks.Nature542(7639):115. Ghassemi, M.; Pimentel, M. A.; Naumann, T.; Brennan, T.; Clifton, D. A.; Szolovits, P.; and Feng, M. 2015. A Multivariate Timeseries Modeling Approach to Severity of Illness Assessment and Fore-casting in ICU with Sparse, Heterogeneous Clinical Data. InAAAI Conference on Artificial Intelligence.
Ghassemi, M.; Naumann, T.; Schulam, P.; Beam, A. L.; and Ran-ganath, R. 2018. Opportunities in Machine Learning for Health-care.arXiv preprint arXiv:1806.00388.
Goetz, C. G.; Poewe, W.; Rascol, O.; and Sampaio, C. 2005. Evidence-based medical review update: pharmacological and sur-gical treatments of Parkinson’s disease: 2001 to 2004. Movement Disorders20(5):523–539.
Hammerla, N. Y.; Fisher, J.; Andras, P.; Rochester, L.; Walker, R.; and Pl¨otz, T. 2015. PD Disease State Assessment in Naturalis-tic Environments Using Deep Learning. InAAAI Conference on Artificial Intelligence.
Klucken, J.; Barth, J.; Kugler, P.; Schlachetzki, J.; Henze, T.; Marxreiter, F.; Kohl, Z.; Steidl, R.; Hornegger, J.; Eskofier, B.; et al. 2013. Unbiased and mobile gait analysis detects motor impairment in Parkinson’s disease.PloS one8(2):e56956.
Lasko, T. A.; Denny, J. C.; and Levy, M. A. 2013. Com-putational phenotype discovery using unsupervised feature learn-ing over noisy, sparse, and irregular clinical data. PloS one 8(6):e66341.
Libbrecht, M. W., and Noble, W. S. 2015. Machine learning appli-cations in genetics and genomics.Nature Reviews Genetics. Lipton, Z. C.; Kale, D. C.; Elkan, C.; and Wetzel, R. 2015. Learn-ing to diagnose with LSTM recurrent neural networks. In Interna-tional Conference on Learning Representations.
Lipton, Z. C.; Kale, D. C.; and Wetzel, R. 2016. Directly modeling missing data in sequences with RNNs: Improved classification of clinical time series. InMachine Learning for Healthcare Confer-ence.
Little, M. A.; McSharry, P. E.; Roberts, S. J.; Costello, D. A.; and Moroz, I. M. 2007. Exploiting nonlinear recurrence and frac-tal scaling properties for voice disorder detection. BME Online 6(1):23.
Little, M. A.; McSharry, P. E.; Hunter, E. J.; Spielman, J.; Ramig, L. O.; et al. 2009. Suitability of dysphonia measurements for tele-monitoring of Parkinson’s disease.IEEE Transactions on Biomed-ical Engineering56(4):1015–1022.
Oresko, J. J.; Jin, Z.; Cheng, J.; Huang, S.; Sun, Y.; Duschl, H.; and Cheng, A. C. 2010. A wearable smartphone-based platform for real-time cardiovascular disease detection via electrocardio-gram processing. IEEE Transactions on Information Technology in Biomedicine14(3):734–740.
Pahwa, R., and Lyons, K. E. 2010. Early diagnosis of Parkinson’s disease: recommendations from diagnostic clinical guidelines.Am J Manag Care16(4):94–99.
Patel, S.; Lorincz, K.; Hughes, R.; Huggins, N.; Growdon, J.; Stan-daert, D.; Akay, M.; Dy, J.; Welsh, M.; and Bonato, P. 2009. Moni-toring motor fluctuations in patients with Parkinson’s disease using wearable sensors. IEEE Transactions on Information Technology in Biomedicine13(6):864–873.
Prince, J.; Andreotti, F.; and Vos, M. D. 2018. Multi-Source en-semble learning for the remote prediction of Parkinson’s disease in the presence of source-wise missing data. IEEE Transactions on Biomedical Engineering.
Quisel, T.; Foschini, L.; Signorini, A.; and Kale, D. C. 2017. Col-lecting and analyzing millions of mHealth data streams. In Pro-ceedings of the 23rd ACM SIGKDD International Conference on Knowledge Discovery and Data Mining, 1971–1980. ACM. Razavian, N.; Marcus, J.; and Sontag, D. 2016. Multi-task predic-tion of disease onsets from longitudinal laboratory tests. In Ma-chine Learning for Healthcare Conference.
Rizzo, G.; Copetti, M.; Arcuti, S.; Martino, D.; Fontana, A.; and Logroscino, G. 2016. Accuracy of clinical diagnosis of Parkinson disease: A systematic review and meta-analysis.Neurology.
Schrag, A.; Jahanshahi, M.; and Quinn, N. 2000. How does Parkin-son’s disease affect quality of life? A comparison with quality of life in the general population.Movement Disorders.
Schwab, P.; Scebba, G. C.; Zhang, J.; Delai, M.; and Karlen, W. 2017. Beat by Beat: Classifying Cardiac Arrhythmias with Recur-rent Neural Networks. InComputing in Cardiology.
Schwab, P.; Keller, E.; Muroi, C.; Mack, D. J.; Str¨assle, C.; and Karlen, W. 2018. Not to Cry Wolf: Distantly Supervised Multitask Learning in Critical Care. InInternational Conference on Machine Learning.
Schwab, P.; Miladinovic, D.; and Karlen, W. 2019. Granger-causal Attentive Mixtures of Experts: Learning Important Features with Neural Networks. InAAAI Conference on Artificial Intelligence. Shulman, L. M.; Pretzer-Aboff, I.; Anderson, K. E.; Stevenson, R.; Vaughan, C. G.; Gruber-Baldini, A. L.; Reich, S. G.; and Weiner, W. J. 2006. Subjective report versus objective measurement of ac-tivities of daily living in Parkinson’s disease.Movement Disorders. Smith, S. L.; Gaughan, P.; Halliday, D. M.; Ju, Q.; Aly, N. M.; and Playfer, J. R. 2007. Diagnosis of Parkinson’s disease using evolu-tionary algorithms.Genetic Programming and Evolvable Machines 8(4):433–447.
Suhara, Y.; Xu, Y.; and Pentland, A. 2017. Deepmood: Forecast-ing depressed mood based on self-reported histories via recurrent neural networks. InInternational Conference on World Wide Web. Tsanas, A.; Little, M. A.; McSharry, P. E.; and Ramig, L. O. 2010. Accurate telemonitoring of Parkinson’s disease progression by noninvasive speech tests.IEEE Transactions on Biomedical En-gineering57(4):884–893.
Tsanas, A.; Little, M. A.; McSharry, P. E.; and Ramig, L. O. 2011. Nonlinear speech analysis algorithms mapped to a standard met-ric achieve clinically useful quantification of average Parkinson’s disease symptom severity.Journal of the Royal Society Interface. Tsanas, A.; Little, M. A.; McSharry, P. E.; Spielman, J.; and Ramig, L. O. 2012. Novel speech signal processing algorithms for high-accuracy classification of Parkinson’s disease. IEEE Transactions on Biomedical Engineering59(5):1264–1271.
Vos, T.; Allen, C.; Arora, M.; Barber, R. M.; Bhutta, Z. A.; Brown, A.; Carter, A.; Casey, D. C.; Charlson, F. J.; Chen, A. Z.; et al. 2016. Global, regional, and national incidence, prevalence, and years lived with disability for 310 diseases and injuries, 1990– 2015: a systematic analysis for the global burden of disease study 2015.The Lancet388(10053):1545–1602.
Xu, K.; Ba, J.; Kiros, R.; Cho, K.; Courville, A.; Salakhudinov, R.; Zemel, R.; and Bengio, Y. 2015. Show, attend and tell: Neural image caption generation with visual attention. InInternational Conference on Machine Learning, 2048–2057.
Zhan, A.; Little, M. A.; Harris, D. A.; Abiola, S. O.; Dorsey, E.; Saria, S.; and Terzis, A. 2016. High Frequency Remote Monitor-ing of Parkinson’s Disease via Smartphone: Platform Overview and Medication Response Detection.arXiv preprint arXiv:1601.00960. Zhan, A.; Mohan, S.; Tarolli, C.; Schneider, R. B.; Adams, J. L.; Sharma, S.; Elson, M. J.; Spear, K. L.; Glidden, A. M.; Little, M. A.; et al. 2018. Using Smartphones and Machine Learning to Quantify Parkinson Disease Severity: The Mobile Parkinson Dis-ease Score. JAMA Neurology.